

How to Kill a Black Swan Remy Briand and David Owyong ...
How to Kill a Black Swan Remy Briand and David Owyong ...
How to Kill a Black Swan Remy Briand and David Owyong ...

You also want an ePaper? Increase the reach of your titles
YUMPU automatically turns print PDFs into web optimized ePapers that Google loves.
period that covers major crises that include the Asian crisis,<br />
LTCM, Tech Bubble, Sept. 11 <strong>and</strong> the Quant Meltdown in<br />
August 2007. VaR figures are generated using two methods:<br />
the traditional way in which returns are assumed <strong>to</strong> be normally<br />
distributed <strong>and</strong> exponentially weighted across time, <strong>and</strong><br />
through using extreme value theory. We choose a confidence<br />
level of 99 percent <strong>and</strong> a time horizon of one day, so that the<br />
resultant VaR figures should represent the maximum daily loss<br />
that would be incurred with 99 percent probability.<br />
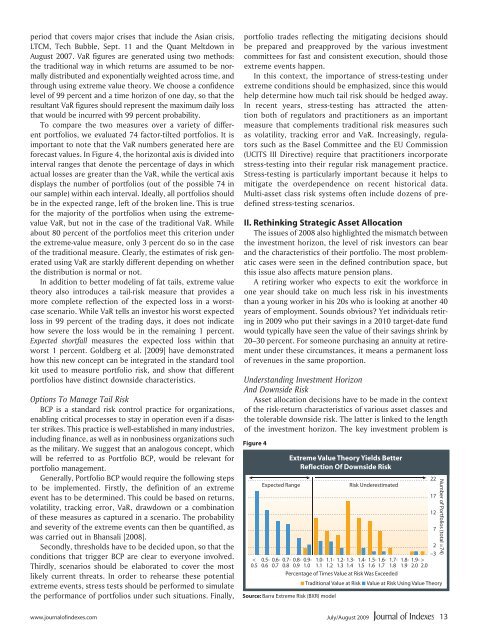
To compare the two measures over a variety of different<br />
portfolios, we evaluated 74 fac<strong>to</strong>r-tilted portfolios. It is<br />
important <strong>to</strong> note that the VaR numbers generated here are<br />
forecast values. In Figure 4, the horizontal axis is divided in<strong>to</strong><br />
interval ranges that denote the percentage of days in which<br />
actual losses are greater than the VaR, while the vertical axis<br />
displays the number of portfolios (out of the possible 74 in<br />
our sample) within each interval. Ideally, all portfolios should<br />
be in the expected range, left of the broken line. This is true<br />
for the majority of the portfolios when using the extremevalue<br />
VaR, but not in the case of the traditional VaR. While<br />
about 80 percent of the portfolios meet this criterion under<br />
the extreme-value measure, only 3 percent do so in the case<br />
of the traditional measure. Clearly, the estimates of risk generated<br />
using VaR are starkly different depending on whether<br />
the distribution is normal or not.<br />
In addition <strong>to</strong> better modeling of fat tails, extreme value<br />
theory also introduces a tail-risk measure that provides a<br />
more complete reflection of the expected loss in a worstcase<br />
scenario. While VaR tells an inves<strong>to</strong>r his worst expected<br />
loss in 99 percent of the trading days, it does not indicate<br />
how severe the loss would be in the remaining 1 percent.<br />
Expected shortfall measures the expected loss within that<br />
worst 1 percent. Goldberg et al. [2009] have demonstrated<br />
how this new concept can be integrated in the st<strong>and</strong>ard <strong>to</strong>ol<br />
kit used <strong>to</strong> measure portfolio risk, <strong>and</strong> show that different<br />
portfolios have distinct downside characteristics.<br />
Options To Manage Tail Risk<br />
BCP is a st<strong>and</strong>ard risk control practice for organizations,<br />
enabling critical processes <strong>to</strong> stay in operation even if a disaster<br />
strikes. This practice is well-established in many industries,<br />
including finance, as well as in nonbusiness organizations such<br />
as the military. We suggest that an analogous concept, which<br />
will be referred <strong>to</strong> as Portfolio BCP, would be relevant for<br />
portfolio management.<br />
Generally, Portfolio BCP would require the following steps<br />
<strong>to</strong> be implemented. Firstly, the definition of an extreme<br />
event has <strong>to</strong> be determined. This could be based on returns,<br />
volatility, tracking error, VaR, drawdown or a combination<br />
of these measures as captured in a scenario. The probability<br />
<strong>and</strong> severity of the extreme events can then be quantified, as<br />
was carried out in Bhansali [2008].<br />
Secondly, thresholds have <strong>to</strong> be decided upon, so that the<br />
conditions that trigger BCP are clear <strong>to</strong> everyone involved.<br />
Thirdly, scenarios should be elaborated <strong>to</strong> cover the most<br />
likely current threats. In order <strong>to</strong> rehearse these potential<br />
extreme events, stress tests should be performed <strong>to</strong> simulate<br />
the performance of portfolios under such situations. Finally,<br />
portfolio trades reflecting the mitigating decisions should<br />
be prepared <strong>and</strong> preapproved by the various investment<br />
committees for fast <strong>and</strong> consistent execution, should those<br />
extreme events happen.<br />
In this context, the importance of stress-testing under<br />
extreme conditions should be emphasized, since this would<br />
help determine how much tail risk should be hedged away.<br />
In recent years, stress-testing has attracted the attention<br />
both of regula<strong>to</strong>rs <strong>and</strong> practitioners as an important<br />
measure that complements traditional risk measures such<br />
as volatility, tracking error <strong>and</strong> VaR. Increasingly, regula<strong>to</strong>rs<br />
such as the Basel Committee <strong>and</strong> the EU Commission<br />
(UCITS III Directive) require that practitioners incorporate<br />
stress-testing in<strong>to</strong> their regular risk management practice.<br />
Stress-testing is particularly important because it helps <strong>to</strong><br />
mitigate the overdependence on recent his<strong>to</strong>rical data.<br />
Multi-asset class risk systems often include dozens of predefined<br />
stress-testing scenarios.<br />
II. Rethinking Strategic Asset Allocation<br />
The issues of 2008 also highlighted the mismatch between<br />
the investment horizon, the level of risk inves<strong>to</strong>rs can bear<br />
<strong>and</strong> the characteristics of their portfolio. The most problematic<br />
cases were seen in the defined contribution space, but<br />
this issue also affects mature pension plans.<br />
A retiring worker who expects <strong>to</strong> exit the workforce in<br />
one year should take on much less risk in his investments<br />
than a young worker in his 20s who is looking at another 40<br />
years of employment. Sounds obvious? Yet individuals retiring<br />
in 2009 who put their savings in a 2010 target-date fund<br />
would typically have seen the value of their savings shrink by<br />
20–30 percent. For someone purchasing an annuity at retirement<br />
under these circumstances, it means a permanent loss<br />
of revenues in the same proportion.<br />
Underst<strong>and</strong>ing Investment Horizon<br />
And Downside Risk<br />
Asset allocation decisions have <strong>to</strong> be made in the context<br />
of the risk-return characteristics of various asset classes <strong>and</strong><br />
the <strong>to</strong>lerable downside risk. The latter is linked <strong>to</strong> the length<br />
of the investment horizon. The key investment problem is<br />
Figure 4<br />
Expected Range<br />
Extreme Value Theory Yields Better<br />
Reflection Of Downside Risk<br />
Risk Underestimated<br />
2<br />
–3<br />
<<br />
0.5 0.5-<br />
0.6 0.6-<br />
0.7 0.7-<br />
0.8 0.8-<br />
0.9 0.9-<br />
1.0 1.0-<br />
1.1 1.1-<br />
1.2 1.2-<br />
1.3 1.3-<br />
1.4 1.4-<br />
1.5 1.5-<br />
1.6 1.6-<br />
1.7 1.7-<br />
1.8 1.8-<br />
1.9 1.9-<br />
2.0 > 2.0<br />
Percentage of Times Value at Risk Was Exceeded<br />
■ Traditional Value at Risk ■ Value at Risk Using Value Theory<br />
Source: Barra Extreme Risk (BXR) model<br />
22<br />
17<br />
12<br />
7<br />
Number of Portfolios (<strong>to</strong>tal =74)<br />
www.journalofindexes.com July/August 2009<br />
13


