Fully adaptable band-stop filter using varactor diodes - inaoe
Fully adaptable band-stop filter using varactor diodes - inaoe
Fully adaptable band-stop filter using varactor diodes - inaoe

You also want an ePaper? Increase the reach of your titles
YUMPU automatically turns print PDFs into web optimized ePapers that Google loves.
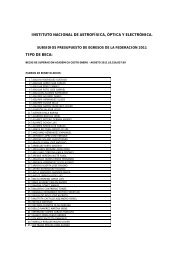
Figure 2<br />
Quasi-elliptic <strong>band</strong>-<strong>stop</strong> <strong>filter</strong> ladder network<br />
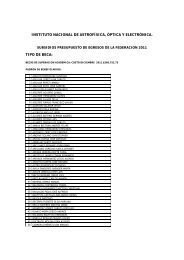
Figure 3<br />
<strong>diodes</strong><br />
Reconfigurable quasi-elliptic <strong>band</strong>-<strong>stop</strong> <strong>filter</strong> <strong>using</strong> <strong>varactor</strong><br />
cross coupling between nonadjacent resonators 1 and 4 (Fig. 2);<br />
J a and J b have opposite signs, and hence, the cross coupling line<br />
has an electrical length of 270 . From Table 1, the impedance<br />
of the line between resonators 2 and 3 in Figure 2 is around 50<br />
X. Similarly the impedance of the crossing line between resonators<br />
1 and 4 in Figure 2 is found to be Z b ¼ 250 X. As a 250 X<br />
line is impractical for fabrication <strong>using</strong> conventional photolithography,<br />
two h/2 line sections connected by a series capacitor<br />
C k , as shown in Figure 2 were used instead. To find the value of<br />
capacitor C k , first the line length h is chosen to give a value of<br />
admittance Y b from (1) that corresponds to a 65 X impedance<br />
line suitable for realization <strong>using</strong> a conventional photolithographic<br />
process. Then, the value of C k can be calculated <strong>using</strong><br />
(2), where Z 0 is the characteristic impedance of the line and f 0<br />
is the <strong>filter</strong> center frequency. Using (2), C k was calculated to be<br />
0.3pF, where h in (1) was taken as 120 .<br />
3. FILTER IMPLEMENTATION<br />
J b<br />
Y b ¼ <br />
tan h (1)<br />
2<br />
J b<br />
C k ¼ 2<br />
(2)<br />
J<br />
2pf 0 Z 0 1 b<br />
Y b<br />
This section describes <strong>filter</strong> layout implementation, including<br />
bias circuitry, details of the surface mount components used,<br />
and substrate characteristics. Figure 3 shows the proposed <strong>filter</strong><br />
topology layout that consists of a main transmission line with<br />
four transmission line resonators loaded with <strong>varactor</strong> <strong>diodes</strong> C j<br />
on one end; these transmission line resonators correspond to the<br />
LC resonator model in Figure 2. Filter center frequency control<br />
can be attained by modifying the capacitance value of C j . These<br />
resonators are coupled to the main transmission line through<br />
<strong>varactor</strong> diode C i destined to control the fractional <strong>band</strong>width of<br />
the <strong>filter</strong>. Selectivity tuning was achieved by <strong>varactor</strong> diode C k<br />
in the middle of the crossing line that produces the cross coupling<br />
between nonadjacent resonators (Figs. 2 and 3). Changing<br />
the capacitance of C k varies the electrical length of the line and<br />
TABLE 1<br />
Quasi-Elliptic Low-pass Prototype Element Values<br />
X a g 1 g 2 J a J b<br />
1.85 0.95 1.41 1.10 0.19<br />
hence, the position of the transmission zeros located around the<br />
<strong>stop</strong>-<strong>band</strong> <strong>filter</strong>.<br />
The <strong>filter</strong> was defined photolithographically on a Rogers<br />
Duroid substrate (e r ¼ 2.2 and tand ¼ 0.0009). The RF choke<br />
consists of a 177 nF inductor from Tyco Electronics with a selfresonance<br />
at 1.7 GHz. The choke inductor has been modeled as<br />
a 177 nF inductor in parallel with a 50 fF capacitor. Although<br />
the initial <strong>filter</strong> center frequency is around 1.4 GHz, the inductor<br />
isolation is better than 35 dB within the <strong>filter</strong> operation frequency<br />
range. Due to the high isolation of the choke inductor,<br />
the microwave signal is not influenced by the DC ports used to<br />
provide bias to the active devices.<br />
To prevent a short circuit between the main transmission line<br />
and the crossing line, a DC block has been inserted on the<br />
crossing line, as shown in Figure 3. The DC block used was a 1<br />
nF capacitor.<br />
Three DC sources in Figure 3 were used to tune the three <strong>filter</strong><br />
design parameters. V k controls <strong>filter</strong> selectivity, V i controls<br />
<strong>filter</strong> <strong>band</strong>width, and V j controls <strong>filter</strong> center frequency. These<br />
DC sources supply the reverse voltage needed to bias the <strong>varactor</strong><br />
<strong>diodes</strong>. The grey zone in Figure 3 has positive polarization,<br />
and the black one has negative polarization. The <strong>varactor</strong>s were<br />
biased <strong>using</strong> a voltage ranging from 0 to 20 V according to the<br />
manufacturer’s data sheet.<br />
MACOM <strong>varactor</strong> <strong>diodes</strong> MA46470-276 were used for C k<br />
and C i , and MA4ST402-287 were used for C j . The MA46470-<br />
276 <strong>diodes</strong> have a capacitance range from 0.3 to 1.8 pF, and the<br />
MA4ST402-287 <strong>diodes</strong> have a capacitance range from 3.86 to<br />
86.29 pF. A photograph of the fabricated <strong>filter</strong> is shown in<br />
Figure 4.<br />
4. RESULTS<br />
This section contains simulated and measured results obtained<br />
from the proposed <strong>filter</strong>. The section is divided into three parts;<br />
Section 4.1 shows the results for center frequency tuning. Section<br />
4.2 describes the results for <strong>band</strong>width tuning. Finally, Section<br />
4.3 shows the results obtained when selectivity is tuned.<br />
Simulated results were obtained <strong>using</strong> commercial software [38]<br />
to do electromagnetic simulations taking into account the surface<br />
mount component’s lumped element models. All measurements<br />
were done after a short-open-load-thru calibration, setting<br />
the measurement reference plane at the SMA coaxial connectors<br />
used to interface the <strong>filter</strong> with the measurement equipment.<br />
Scattering parameters were measured <strong>using</strong> an Agilent 8510C<br />
network analyzer, DC bias was supplied by two Promax FAC-<br />
662B power supplies.<br />
DOI 10.1002/mop MICROWAVE AND OPTICAL TECHNOLOGY LETTERS / Vol. 52, No. 3, March 2010 555