Mass spectrometry
Mass spectrometry
Mass spectrometry

Create successful ePaper yourself
Turn your PDF publications into a flip-book with our unique Google optimized e-Paper software.
Bionanotools and Protein Structure 2005<br />
<strong>Mass</strong> <strong>spectrometry</strong><br />
of peptides and proteins<br />
by<br />
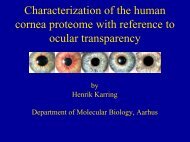
Henrik Karring<br />
1
Outline<br />
The genome and the proteome<br />
Genomics and proteomics<br />
An overview of the technologies of proteomics<br />
2D gel electrophoresis<br />
Protein visualization<br />
Image Analysis<br />
2
<strong>Mass</strong> <strong>spectrometry</strong><br />
Ionization (MALDI and Electrospray)<br />
<strong>Mass</strong> analyzers<br />
Detector<br />
Protein identification by mass <strong>spectrometry</strong><br />
Peptide mass fingerprinting (MALDI)<br />
Tandem mass <strong>spectrometry</strong> (MS/MS)<br />
CAF-MS/MS<br />
Characterization of the human cornea proteome<br />
with reference to ocular transparency<br />
3
What is a Genome ?<br />
The complete DNA sequence of an organism<br />
STATIC. The genome is the same in all cells – all the time.<br />
4
What is a Proteome ?<br />
A proteome is the entire protein complement<br />
expressed by a given biological system in given<br />
conditions.<br />
Wilkins et al., BioTechnology 14,61-65 (1996)<br />
DYNAMIC. The proteome is not the same in all cells and tissues.<br />
5
What is Proteomics?<br />
Proteomics is the systematic analysis of protein<br />
expression patterns and functions in biological systems.<br />
It involves identifying all proteins and determine how the<br />
proteins interact.<br />
6
Why proteomics ?<br />
1. Proteins are the “business end” of the genes, the final<br />
product that carry out all the DNA instructions.<br />
2. Proteins carry out and regulate body processes.<br />
E.g. hormones, antibodies, enzymes, structural proteins.<br />
3. The correlation between mRNA abundance and protein<br />
amount is not that good.<br />
You can have a protein in a cell/tissue without its mRNA<br />
present.<br />
You can have lots of mRNA without translation to protein.<br />
7
4. Alternative splicing of mRNA<br />
5. Post-translational modifications.<br />
Signal peptide cleavage, other proteolytic events,<br />
phosphorylation, disulfides, cross linking etc.)<br />
6. Protein location<br />
(intra- or extracellular, membrane or organel associated).<br />
7. Proteomics is used to study protein interactions<br />
8. Most drug targets are proteins<br />
Proteomics is the direct way to annotate the genome<br />
8
Summary<br />
Proteomics address fundamental problems like:<br />
(i) does the protein exist at all ?<br />
(ii) where is the protein ?<br />
(what tissue, cell type, inside or outside the cell)<br />
(iii) when is the protein present ?<br />
(during development, inflammation, all the time….)<br />
(iv)<br />
Structure / Function<br />
9
2D gel electrophoresis<br />
10
Two-dimensional gel electrophoresis<br />
Isoelectric focusing (pI)<br />
Molecular weight<br />
11
Sample preparation<br />
2D-PAGE<br />
Cells or tissue<br />
Extract<br />
proteins<br />
Good separation of proteins including<br />
post-translational modified isoforms.<br />
12
Step 1: the sample is applied to the immobilized pH<br />
gradient strip over night.<br />
13
Step 2: The isoelectric<br />
performed.<br />
focusing step is<br />
Step 3: the next day the<br />
strips are incubated in<br />
SDS-sample buffer and<br />
alkylated.<br />
14
Step 4: 2-Dimensional SDS-PAGE electrophoresis<br />
15
Protein visualization<br />
16
Coomassie Brilliant Blue R-250 staining<br />
MW: 826.0 g/mol<br />
Detection limit ~ 100 ng protein<br />
Max abs ~ 550 nm<br />
Formula: C 45 H 44 O 7 S 2 Na
1. Binds non-specifically to protonated amino<br />
groups by electrostatic interactions<br />
2. Useful for densitometry<br />
3. Simple protocol<br />
4. Compatible with mass <strong>spectrometry</strong>
Silver staining<br />
1. Reduction of Ag + to metallic Ag → staining<br />
Ag + ions complexed with sulfhydryl and carboxyl<br />
groups of proteins are selectively reduced.<br />
1. High sensitivity<br />
Detection limit ~ 2-5 ng protein<br />
4. Easy to use and not expensive.<br />
5. “Compatible with mass <strong>spectrometry</strong>”
pH 4<br />
7<br />
12.5%<br />
The protein stained with<br />
silver is not useful for<br />
mass <strong>spectrometry</strong><br />
20
Fluorescent dyes<br />
1. Cydye DIGE Fluors (Cy2, Cy3, and Cy5) – cyanine<br />
2. Cross-link to epsilon amine on lysine via amide linkage<br />
3. Cydyes are size and charge-matched<br />
- proteins with different labels will overlay<br />
4. Have narrow excitation and emission bands
Internal standard (pool of 1 and 2)<br />
Label with Cy2<br />
Protein sample 1 (normal)<br />
e.g. control label with Cy3<br />
Mix labelled<br />
samples<br />
Image gel on Typhoon<br />
Protein sample 2 (diseased)<br />
e.g. treated label with Cy5<br />
Excitation wavelength 1 Excitation wavelength 3<br />
Excitation wavelength 2
Ettan 2D difference gel electrophoresis<br />
(Ettan 2D-DIGE)
- no gel-to-gel variation<br />
- high sensitivity (~ 1 ng)<br />
- pH insensitive (no change in signal over wide pH range)<br />
-very accurate - good statistical analysis<br />
- can detect < 10% difference in expression<br />
- less analysis time<br />
- compatible with mass <strong>spectrometry</strong>
Image analysis<br />
25
PDQuest program for 2D-PAGE<br />
Normal Diseased Drug-treated<br />
Compare expression profiles<br />
Up- and down regulated<br />
26
Functions and principles<br />
1. Image fitting and Gaussian modeling.<br />
2. Spot detection<br />
3. Normalization and removing lines and speckles<br />
4. Matching of gels<br />
(e.g. normal, diseased, and treated tissues)<br />
5. Analysis of data (changes in expression)<br />
6. Annotation of spots<br />
(linking of data to spots – intensity and MS data etc.)<br />
27
3D viewer<br />
30
<strong>Mass</strong> <strong>spectrometry</strong><br />
31
Components of a <strong>Mass</strong> Spectrometer<br />
High Vacuum System<br />
Turbo pumps<br />
Rough pumps<br />
Inlet<br />
Ion<br />
source<br />
<strong>Mass</strong><br />
analyzer<br />
Detector<br />
Recorder<br />
HPLC<br />
Sample plate<br />
MALDI<br />
Electrospray<br />
TOF<br />
Quadropole<br />
Microchannel<br />
plate<br />
PC<br />
Macintosh<br />
<strong>Mass</strong> spectrometers measure the mass-to-charge (m/z)<br />
ratios of gas phase ions<br />
32
Ionization<br />
M + nH + (M+nH) n+<br />
MALDI: Matrix Assisted Laser Desorption Ionization<br />
Sample co-crystallized with a UV-absorbing matrix<br />
Pulsed ionization method<br />
Produces mainly single-charged ions (+1)<br />
ESI: ElectroSpray Ionization<br />
Sample in solution<br />
Continuous ionization method<br />
Produces multiple-charged ions (+1, +2, …..)<br />
33
What is a “matrix” for MALDI?<br />
A couple of representative matrices that have been<br />
demonstrated to be good "all-around" MALDI matrices.<br />
O<br />
O<br />
OH<br />
OH<br />
HO<br />
OH<br />
HO<br />
CN<br />
2,4-dihydroxy benzoic acid<br />
alpha-cyano-4-hydroxy<br />
cinnamic acid<br />
Adsorption: 337 nm<br />
34
MALDI<br />
Sample plate<br />
Nitrogen UV laser (337 nm, 3 nsec pulses)<br />
hν<br />
1. Sample is mixed with excess<br />
matrix and dried on a MALDI<br />
plate.<br />
MH +<br />
2. Laser flash ionizes matrix<br />
molecules.<br />
3. Sample molecules are ionized by<br />
proton transfer from matrix.<br />
+20 kV<br />
Variable<br />
Grid<br />
Ground<br />
Grid<br />
35
Target plates for MALDI<br />
36
Electrospray Ionization<br />
Nanoflow electrospray<br />
Flowrate: 200-300 nL/min<br />
37
<strong>Mass</strong> analyzers<br />
Time-of-flight (TOF)<br />
m/z can be calculated from the measured<br />
time-of-flight<br />
Quadrupole (mass filter)<br />
ions of a certain m/z are selected<br />
Ion trap<br />
ion are trapped and can be further analyzed<br />
(multiple MS/MS)
MALDI time-of-flight<br />
Target plate (+20kV)<br />
Reflector Detector<br />
Reflector<br />
Linear<br />
Detector<br />
Flight tube<br />
Laser<br />
1kV<br />
2kV 3kV<br />
10kV<br />
39
Reflector<br />
A reflector is an “ion mirror” that:<br />
1: increases the overall path<br />
length for an ion.<br />
2: provides higher performance<br />
(resolution and mass accuracy).<br />
40
Quadrupole (mass filter)<br />
41
Microchannel Plate Detector (MCP)<br />
Up close view<br />
The channels are 12.5 microns in diameter.<br />
(A human hair is 60 - 80 microns in diameter)<br />
42
Signal Amplification in a<br />
Microchannel plate<br />
43
Micromass Q-TOF Ultima Global<br />
mass spectrometer<br />
Peptide ions are selected in the<br />
quadrupole<br />
44
Protein identification by<br />
mass <strong>spectrometry</strong><br />
46
Peptide mass fingerprinting by<br />
MALDI-MS<br />
Trypsin<br />
digestion<br />
Abundance<br />
p5<br />
p3<br />
p1<br />
p4<br />
p2<br />
MALDI-MS<br />
Peptide<br />
extraction<br />
and matrix<br />
MALDI target<br />
m/z<br />
47
Combined spectrum of sample<br />
48
Isotope cluster of peptide<br />
Monoisotopic<br />
Peptide<br />
(all C 12 )<br />
49
What happens during the search?<br />
The protein databases contain<br />
all know protein sequences.<br />
Search:<br />
Which record in the<br />
database fits the<br />
determined masses<br />
best ?<br />
In-silico digestion:<br />
The theoretical mass<br />
of the tryptic peptides<br />
for each protein in<br />
the database.<br />
Peak list<br />
The mass of the “real” tryptic peptides<br />
determined by the mass spectrometer<br />
are compared to the each sequence<br />
record in the database.<br />
50
Choose database<br />
Choose organism<br />
Find peak list file<br />
Select modifications<br />
Peptide tolerance<br />
51
Protein score<br />
52
Tandem mass <strong>spectrometry</strong><br />
Peptide fragmentation<br />
53
Fragmentation<br />
The most commonly observed ions are the b- and y-<br />
ions<br />
54
Example of MS-MS Sequencing<br />
K EE P A N D I Q<br />
FA<br />
Parent ion<br />
D<br />
Spectrum can be complex to interpret<br />
55
LC-MS/MS<br />
MudPit: Multi-dimensional Protein identifiation technology<br />
1. Digestion of complex protein sample<br />
2. Online separation of peptides by<br />
SCX and reverse phase<br />
chromatography<br />
3. MS/MS sequencing of peptides<br />
4. Combining all MS/MS data<br />
5. Search databases<br />
56
Chemical-assisted fragmentation<br />
The problems of reading sequence from MS/MS spectra can be<br />
encountered by the use of CAF<br />
Lysine modification<br />
Prevents the reaction of<br />
lysine residues in<br />
second step<br />
57
Sulfonation<br />
Sulfonation of N-terminus.<br />
Introduces a negative charge<br />
58
Charges on sulfonated ion<br />
Tryptic peptide:<br />
Sulfonated peptide:<br />
-<br />
+<br />
Lys/Arg<br />
+<br />
Lys/Arg<br />
Peptide ion in positive mode:<br />
-<br />
+<br />
+<br />
Lys/Arg<br />
59
After quadrupole selection<br />
Parent ion<br />
60
After applying collision energy<br />
R<br />
R<br />
R<br />
R<br />
R<br />
Parent ion<br />
-<br />
CAF-ELINSWVESQTNGIIR + S<br />
N<br />
I<br />
L<br />
E<br />
CAF<br />
(R)<br />
I/L<br />
113<br />
I/L<br />
113<br />
G<br />
57<br />
N<br />
114<br />
E<br />
T Q S 129<br />
101 127 87<br />
V W S<br />
99 186 86<br />
N<br />
I/L<br />
114 113<br />
I/L<br />
E<br />
113 129<br />
134<br />
61
Something about sensitivity<br />
(a 50 kDa protein is used in the examples)<br />
500 pico mol -1 nano mol (25-50 micro g)<br />
SDS-PAGE (Coomassie): 20 pico mol (1 micro g)<br />
SDS-PAGE (Silver): 0.2 - 2 pico mol (10 - 100 nano g)<br />
Silver is 10 -100 x times more sensitive than Coomassie<br />
Edman degradation: 10-20 pico mol (0.5 - 1 micro g)<br />
Amino acid analysis: 10-20 pico mol (0.5 - 1 micro g)<br />
Sensitivity of MALDI or Electrospray is in<br />
the femto mol range or into even atto<br />
mole amount. 10 -6 micro<br />
10 -9 nano<br />
10 -12 pico<br />
10 -15 fento<br />
10 -18 atto<br />
62
The End<br />
63