Address by Chris Richardson Access Economics to staff at the ...
Address by Chris Richardson Access Economics to staff at the ...
Address by Chris Richardson Access Economics to staff at the ...

Create successful ePaper yourself
Turn your PDF publications into a flip-book with our unique Google optimized e-Paper software.
<strong>Address</strong> <strong>by</strong><br />
<strong>Chris</strong> <strong>Richardson</strong><br />
<strong>Access</strong> <strong>Economics</strong><br />
<strong>to</strong> <strong>staff</strong> <strong>at</strong> <strong>the</strong><br />
Department of Immigr<strong>at</strong>ion and Multicultural and Indigenous Affairs,<br />
12 December 2002.<br />
Migr<strong>at</strong>ion Myths and Realities<br />
Disclaimer:<br />
The views expressed in this present<strong>at</strong>ion are those of <strong>the</strong> author and do not necessarily represent those of<br />
<strong>the</strong> Department of Immigr<strong>at</strong>ion and Multicultural and Indigenous Affairs.
I have actually done a lot of work with DIMIA in <strong>the</strong> last couple of years, looking<br />
particularly <strong>at</strong> migr<strong>at</strong>ion and its impact on Federal and St<strong>at</strong>e budgets. But I have also in<br />
<strong>the</strong> last couple of years done a lot of work in rel<strong>at</strong>ion <strong>to</strong> <strong>the</strong> ageing of Australia. And<br />
you might remember th<strong>at</strong> <strong>the</strong> Treasury put out an intergener<strong>at</strong>ional report in May, which<br />
basically said th<strong>at</strong> <strong>the</strong> world would end in <strong>the</strong> next couple of decades.<br />
Because I used <strong>to</strong> work in Treasury, I am of course deeply critical of <strong>the</strong> report. It<br />
clearly wasn’t pessimistic enough. I have actually taken <strong>the</strong>se two sets of work and<br />
have been doing a bit of thinking about migr<strong>at</strong>ion. I certainly don’t claim <strong>to</strong> have<br />
cre<strong>at</strong>ed <strong>the</strong> general <strong>the</strong>ory of migr<strong>at</strong>ion as far as economists are concerned, but I have<br />
got two specific ideas th<strong>at</strong> I would love <strong>to</strong> run through with you <strong>to</strong>day.<br />
Hopefully, I want <strong>to</strong> make you think about migr<strong>at</strong>ion perhaps in ways th<strong>at</strong> you haven’t<br />
before. And hopefully th<strong>at</strong> will be useful <strong>to</strong> you.<br />
Basically two things. Number one, it’s not just an economist’s perspective, it’s a<br />
macro-economist’s perspective. We are actually <strong>the</strong> boring end of <strong>the</strong> economics field.<br />
I am going <strong>to</strong> try and give you a macro economic framework in which <strong>to</strong> think about<br />
migr<strong>at</strong>ion. And <strong>the</strong> o<strong>the</strong>r broad thought th<strong>at</strong> I have, is th<strong>at</strong> migr<strong>at</strong>ion and migr<strong>at</strong>ion<br />
policy in Australia <strong>to</strong>day fails <strong>the</strong> "barbeque test", in <strong>the</strong> sense, th<strong>at</strong> I am sure you have<br />
all experienced, whenever talking <strong>to</strong> a bunch of your friends.<br />
Popular understanding of <strong>to</strong>day’s migr<strong>at</strong>ion program is, if anything, several decades out<br />
of d<strong>at</strong>e. And <strong>the</strong> number of misconceptions and myths about migrants and migr<strong>at</strong>ion is<br />
very high.<br />
First <strong>the</strong> framework.<br />
Economic growth is made up of two components, and only two components. Basically<br />
an economy, whe<strong>the</strong>r it is Australia, <strong>the</strong> US, India, grows ei<strong>the</strong>r because more people<br />
work, or those workers are working more productively. They are getting more output<br />
for a given hours work, if you like. My job in many ways is forecasting economic<br />
growth, whe<strong>the</strong>r it is for next year or looking out fur<strong>the</strong>r. And <strong>the</strong>refore it breaks down<br />
<strong>to</strong> those two components. Figuring out how many people we will have working down<br />
<strong>the</strong> track and <strong>the</strong> productivity with which <strong>the</strong>y will work.<br />
Now, I will concentr<strong>at</strong>e more from a migr<strong>at</strong>ion viewpoint on <strong>the</strong> people side of th<strong>at</strong><br />
equ<strong>at</strong>ion <strong>to</strong>day. Because th<strong>at</strong>’s where migrants can potentially have most impact.
It is probably worth me just briefly mentioning something on <strong>the</strong> productivity side.<br />
Australia’s economy grew faster in <strong>the</strong> 1990's than it did in <strong>the</strong> 80’s or <strong>the</strong> 70’s, and it<br />
grew faster in <strong>the</strong> 90’s <strong>the</strong>n did <strong>the</strong> US economy, and it did so because of our excellent<br />
growth in productivity, which partly is because we are very good <strong>at</strong> take-up of new<br />
technology. More importantly, both side of politics and, particularly <strong>at</strong> <strong>the</strong> Federal level,<br />
but also <strong>at</strong> <strong>the</strong> St<strong>at</strong>e level, signed on for economic reform. We freed up financial<br />
markets and we <strong>to</strong>ok on things like n<strong>at</strong>ional competition policy, and we did some labour<br />
market deregul<strong>at</strong>ion, and those sorts of things.<br />
If you look forward in Australia or around <strong>the</strong> world, you would have <strong>to</strong> be a little bit<br />
worried about growth in <strong>the</strong> next decade or so, partly because Australia and <strong>the</strong> rest of<br />
<strong>the</strong> world is increasingly suffering from reform f<strong>at</strong>igue. One of <strong>the</strong> strengths of <strong>the</strong><br />
Pauline Hanson phenomenon in Australia th<strong>at</strong> <strong>the</strong> bush is not happy with how economic<br />
reform has gone and its impacts, or its perceived impacts.<br />
There is a chance th<strong>at</strong> economic growth will slow because our courage <strong>to</strong> take on<br />
reform will slow.<br />
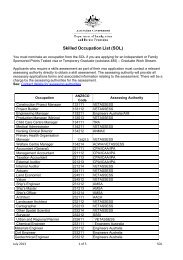
O ne <strong>the</strong> ‘people’front,cha lenges of<br />
an ageing popul<strong>at</strong>ion loom large<br />
400<br />
% of current popul<strong>at</strong>ion<br />
300<br />
200<br />
0-14 15-54<br />
55-64 65-84<br />
85+ <strong>to</strong>tal<br />
100<br />
Source: ABS<br />
0<br />
2002 2005 2008 2011 2014 2017 2020 2023 2026 2029 2032 2035 2038 2041<br />
However, more importantly, I would like <strong>to</strong> talk about <strong>the</strong> people part of <strong>the</strong> equ<strong>at</strong>ion.<br />
Everybody has seen this sort of a basic chart, indeed I could have shown you lots of<br />
charts with <strong>the</strong> same basic s<strong>to</strong>ry.
For every 100 people <strong>to</strong>day aged 85, in 40 years time <strong>the</strong>re will be 400 people aged 85<br />
and over. For people in <strong>the</strong> age group say 65 <strong>to</strong> 84, for every 100 people <strong>the</strong>re will be<br />
over 200 people. A 50% increase in <strong>the</strong> age group of 55 <strong>to</strong> 64 year-olds. Now th<strong>at</strong> is a<br />
very big change in <strong>the</strong> Australian economy in <strong>the</strong> period ahead. Arguably <strong>the</strong> biggest<br />
change in <strong>the</strong> structure of our economy th<strong>at</strong> we have had since World War 2.<br />
And we know th<strong>at</strong> it is coming. If I tried <strong>to</strong> forecast <strong>the</strong> exchange r<strong>at</strong>e in two weeks<br />
time, and I do, you shouldn’t trust me. But if I tried <strong>to</strong> forecast <strong>the</strong> Australian<br />
popul<strong>at</strong>ion and <strong>the</strong> make-up of it in terms of its age structure, in 20 and 30 and 40 years<br />
time, I can do th<strong>at</strong> with surprising accuracy <strong>to</strong>day.<br />
Basically, <strong>the</strong> key fact is th<strong>at</strong> ba<strong>by</strong> boomers like me will be retiring in <strong>the</strong> years ahead.<br />
Working age popul<strong>at</strong>ion goes up every year. Students finish study and <strong>the</strong>y come in<strong>to</strong><br />
<strong>the</strong> workforce; people retire out <strong>the</strong> o<strong>the</strong>r end of <strong>the</strong> work force. And in between<br />
usually mums are ei<strong>the</strong>r leaving <strong>the</strong> workforce or coming back in. Once you add in all<br />
those flows, on average in <strong>the</strong> last decade, and still <strong>at</strong> <strong>the</strong> moment in Australia, we are<br />
getting about an extra 170,000 people putting up <strong>the</strong>ir hand <strong>to</strong> be in <strong>the</strong> Australian<br />
workforce.<br />
Now those 170,000 people coming in each year provide about half of economic growth.<br />
Productivity has provided <strong>the</strong> o<strong>the</strong>r half. And yet <strong>the</strong> retirement of <strong>the</strong> ba<strong>by</strong> boomers<br />
will be quite noticeable in ten years time and very noticeable in 18 years time. When I<br />
say th<strong>at</strong> 170,000 people are putting up <strong>the</strong>ir hand <strong>to</strong> enter <strong>the</strong> workforce in net terms in<br />
Australia each year <strong>at</strong> <strong>the</strong> moment, in <strong>the</strong> decade of <strong>the</strong> 2020’s th<strong>at</strong> will be 12,000 a<br />
year. Going from 170,000 going down <strong>to</strong> 12,000 will roughly halve economic growth<br />
and <strong>the</strong>refore in many ways our ability <strong>to</strong> finance a number of things including policies.<br />
Now th<strong>at</strong> has a number of implic<strong>at</strong>ions. For example, even if you just look out <strong>the</strong> next<br />
decade, almost half of <strong>the</strong> increase of retail sales in Australia will be <strong>to</strong> people aged 55<br />
and over. Let's say you own a shopping mall, we certainly advise various people who<br />
do, you will in <strong>the</strong> next decade or so in rel<strong>at</strong>ive terms, notice less Rebel Sports, basically<br />
because <strong>the</strong> numbers of young people are stagnant or even fallen depending on which<br />
age group you are looking <strong>at</strong>. But <strong>the</strong>re will be more Dymocks or Angus and<br />
Robertson’s, because we are just not running th<strong>at</strong> fast anymore.<br />
These sorts of things will have big impacts on who we are and how we live. And <strong>the</strong>y<br />
will have very big impacts on <strong>the</strong> Federal budget. The Government had a look <strong>at</strong> this in
<strong>the</strong> intergener<strong>at</strong>ional report, and <strong>the</strong>y came up with two broad conclusions, though it<br />
didn’t quite put <strong>the</strong>m this way. The “not so scary impacts” are th<strong>at</strong> basically pension<br />
costs will rise, and health care costs will rise and <strong>the</strong>re will even be some savings on<br />
foreign educ<strong>at</strong>ion.<br />
However, <strong>the</strong> "scary impact" is th<strong>at</strong> as Australians get older and increasingly use health<br />
services this will collide with <strong>the</strong> fact th<strong>at</strong> <strong>the</strong> price of health services, which are mostly<br />
Government subsidised, rises about twice as fast as <strong>the</strong> average price out <strong>the</strong>re in <strong>the</strong><br />
Australian economy. Th<strong>at</strong> means th<strong>at</strong> it is going <strong>to</strong> get very, very expensive.<br />
The underlying conclusions of <strong>the</strong> intergener<strong>at</strong>ional report, and remember this was<br />
written <strong>by</strong> Treasury so it was always going <strong>to</strong> be scary and a little apocalyptic, basically<br />
were th<strong>at</strong>, sure <strong>to</strong>day's taxpayers can afford <strong>to</strong>day's health and welfare system, but<br />
<strong>to</strong>morrow’s taxpayers won’t be able <strong>to</strong> afford <strong>to</strong>day's health and welfare system per<br />
individual paid out in <strong>the</strong> future.<br />
We will basically have <strong>to</strong> cut back on <strong>the</strong> degree of services th<strong>at</strong> we as a public sec<strong>to</strong>r<br />
provide federally, and it is also true <strong>at</strong> <strong>the</strong> st<strong>at</strong>e level, or we’ll have <strong>to</strong> raise taxes, or we<br />
end up suffering from this.<br />
Now I realise this is a very, very, very sad reflection on my personality, but I find this<br />
chart exciting.<br />
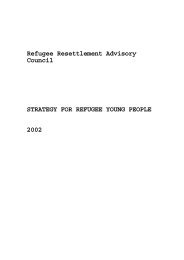
Resultis<strong>the</strong> IGR ‘scarys<strong>to</strong>ry’<br />
% of GDP<br />
1<br />
Commonwealth Budget Spending Less Revenue<br />
0<br />
-1<br />
-2<br />
-3<br />
-4<br />
Source: IGR<br />
-5<br />
2003 2022 2042
This basically says th<strong>at</strong> we have a few years of good times ahead, enjoy <strong>the</strong>m. But th<strong>at</strong><br />
eventually <strong>the</strong> combin<strong>at</strong>ion of ageing and increases in health care costs will send <strong>the</strong><br />
Federal budget very deeply in<strong>to</strong> deficit if we did nothing in coming decades. And <strong>the</strong>y<br />
actually threw around a scary figure of $80 billion dollars. Th<strong>at</strong> is a bit unfair. If you<br />
put it in <strong>to</strong>day's money it is a mere snip <strong>at</strong> $40 billion dollars. It’s 5% of GDP.<br />
Now I am sure a bunch of you lived through <strong>the</strong> experience of <strong>the</strong> 1996 Federal budget,<br />
when <strong>the</strong> Government cut back spending, mostly spending, <strong>by</strong> a little over one per cent<br />
of GDP, and th<strong>at</strong> was hell, th<strong>at</strong> was no fun for anybody concerned. Here we are talking<br />
about 5% of GDP. Or again, thinking of it in <strong>to</strong>day's money, basically each year for <strong>the</strong><br />
next forty years <strong>the</strong> Government has <strong>to</strong> save, ERC – razor gang - has <strong>to</strong> save a billion<br />
dollars a year <strong>to</strong> make up for <strong>the</strong>se trends th<strong>at</strong> are headed out way. Th<strong>at</strong> is obviously a<br />
bit of a worry.<br />
Let me give you, however, <strong>the</strong> framework with which <strong>to</strong> understand <strong>the</strong> implic<strong>at</strong>ions for<br />
migr<strong>at</strong>ion policy in Australia.<br />
Now I would love you <strong>to</strong> go away with this simple concept. Society has a contract with<br />
itself, with its members, th<strong>at</strong> it runs through its Government. As a society we subsidise<br />
youth, we subsidise all sorts of health care costs, even childcare costs when kids are<br />
young. We subsidise health care costs as mum goes in<strong>to</strong> hospital and ba<strong>by</strong> is born for<br />
example. So as a society <strong>the</strong>re is an investment phase, we invest in kids.<br />
At <strong>the</strong> end of our life span <strong>the</strong>re is a retirement phase. And again as a society we<br />
subsidise th<strong>at</strong> mostly through health care costs, and th<strong>at</strong> get very expensive in <strong>the</strong> last<br />
couple of years of life.<br />
Now in between, society does this deal with itself, because it relies on <strong>the</strong> thought th<strong>at</strong> it<br />
will have roughly forty years in which people will pay taxes, and th<strong>at</strong>’s <strong>the</strong> way we get<br />
<strong>the</strong> money <strong>to</strong> subsidise <strong>the</strong> o<strong>the</strong>r two ends of <strong>the</strong> life span. And th<strong>at</strong> rel<strong>at</strong>ively simple<br />
contract allows you <strong>to</strong> come up with a couple of thoughts.<br />
Let me just show you. For a while, things are going <strong>to</strong> get better before <strong>the</strong>y get worse.<br />
Well th<strong>at</strong> is actually pretty simple <strong>to</strong> explain because <strong>the</strong>re are two expensive ends of<br />
<strong>the</strong> life span – <strong>the</strong> early end and <strong>the</strong> l<strong>at</strong>e end. And <strong>the</strong> early end is actually shrinking in<br />
rel<strong>at</strong>ive terms, so we are going <strong>to</strong> save some money. Even though <strong>the</strong> l<strong>at</strong>e end is<br />
growing, it is <strong>the</strong> very end of <strong>the</strong> l<strong>at</strong>e end when <strong>the</strong> ba<strong>by</strong> boomers are in <strong>the</strong>ir last year<br />
or two of life. Th<strong>at</strong>’s when th<strong>at</strong> gets expensive. So you will have this little phase,
according <strong>to</strong> <strong>the</strong> intergener<strong>at</strong>ional report analysis, where actually things will get better<br />
before <strong>the</strong>y get worse, as we change this balance of investment phase, productive phase,<br />
and retirement phase in <strong>the</strong> average s<strong>to</strong>ck of Australian citizens.<br />
Now think of <strong>the</strong>se investment, production and retirement phases and <strong>the</strong>n think of a<br />
migrant, who arrives on Australia’s shores. Take, say, a young adult who is as skilled in<br />
work skills and language as <strong>the</strong> average resident Australian. Now you immedi<strong>at</strong>ely see<br />
how a macro-economist sees a migrant. Because <strong>the</strong>re are <strong>the</strong>se three phases, and two<br />
of <strong>the</strong>m are expensive. But when a young adult arrives, some o<strong>the</strong>r n<strong>at</strong>ion has paid for<br />
<strong>the</strong> health care costs and <strong>the</strong> educ<strong>at</strong>ion costs and so on, and we get a free kick from th<strong>at</strong><br />
little bit of global trade in migrants, and perhaps particularly in skilled migrants.<br />
Now, so far in Australia we haven’t actually suffered <strong>the</strong> ill effects of <strong>the</strong> fact th<strong>at</strong> our<br />
birth r<strong>at</strong>e dropped below replacement in <strong>the</strong> mid 70’s for two reasons.<br />
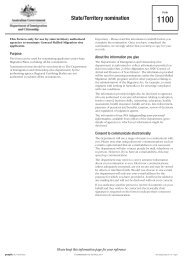
Butparticip<strong>at</strong>ion set<strong>to</strong> decline<br />
65%<br />
64%<br />
Projections<br />
63%<br />
62%<br />
61%<br />
N<strong>at</strong>ional labour force<br />
particip<strong>at</strong>ion r<strong>at</strong>e<br />
60%<br />
Source: <strong>Access</strong> <strong>Economics</strong><br />
59%<br />
1984-85 1990-91 1996-97 2002-03 2008-09 2014-15<br />
Number one, <strong>the</strong> birth r<strong>at</strong>e has been falling over <strong>the</strong> years, but it takes a very long time<br />
for a fall in <strong>the</strong> birth r<strong>at</strong>e in 1982 <strong>to</strong> have an impact on <strong>the</strong> number of people out <strong>the</strong>re in<br />
<strong>the</strong> Australian workforce, and it is only now starting <strong>to</strong> have an impact.<br />
The red line on <strong>the</strong> chart is <strong>the</strong> particip<strong>at</strong>ion r<strong>at</strong>e - <strong>the</strong> number of people working as a<br />
share of relevant popul<strong>at</strong>ion. And because women have been increasingly moving in<strong>to</strong>
<strong>the</strong> paid workforce, we are getting this rel<strong>at</strong>ive increase, in <strong>the</strong> proportion of people in<br />
<strong>the</strong> production phase. Th<strong>at</strong>’s why Australia’s economy has survived surprisingly well.<br />
But take a big picture look <strong>at</strong> this particip<strong>at</strong>ion r<strong>at</strong>e - <strong>the</strong> share of people who will be<br />
working as a proportion of <strong>the</strong> entire popul<strong>at</strong>ion. It was pushing up as women were<br />
joining <strong>the</strong> paid workforce, but it will be pushing down as ba<strong>by</strong> boomers like me retire.<br />
So, this is <strong>the</strong> big underlying change in <strong>the</strong> productive phase. In particular this<br />
expensive phase, this retirement phase, will be coming <strong>to</strong> gre<strong>at</strong>er prominence, and<br />
hurting <strong>the</strong> Australian economy.<br />
Now th<strong>at</strong> has a number of implic<strong>at</strong>ions for migr<strong>at</strong>ion. But before I go through some of<br />
<strong>the</strong>m, let me s<strong>to</strong>p for a moment and talk about some of <strong>the</strong> myths I guess th<strong>at</strong><br />
accompany migr<strong>at</strong>ion. Again it is <strong>the</strong> basic "barbeque test". We all know th<strong>at</strong> if you<br />
stand around <strong>the</strong> barbeque, it won’t be hard <strong>to</strong> find somebody who perhaps lives in<br />
Sydney and is very anti <strong>the</strong> idea of more migr<strong>at</strong>ion in<strong>to</strong> Australia because of<br />
overcrowding costs, if you like. It was always <strong>the</strong> Union argument th<strong>at</strong> migrants take<br />
jobs – th<strong>at</strong>’s ano<strong>the</strong>r myth I guess.<br />
Ano<strong>the</strong>r favourite myth, and certainly Federal Finance Ministers have in times past been<br />
quite fond of this, <strong>the</strong> view th<strong>at</strong> migrants are very expensive <strong>to</strong> budgets. I want <strong>to</strong><br />
examine <strong>the</strong>se myths here.<br />
Myth number one is th<strong>at</strong> migrants clog up bits of Australia and, typically Sydney. We<br />
are talking Bob Carr here and perhaps Mark L<strong>at</strong>ham, and <strong>the</strong> complaints th<strong>at</strong> Sydney is<br />
very overcrowded. You drive along Parram<strong>at</strong>ta Road or Military Road, and it gets<br />
slower every year. This is a micro-economist's objection, saying th<strong>at</strong> <strong>the</strong>re are all <strong>the</strong>se<br />
congestion costs and overcrowding costs here.<br />
Lets have a little look <strong>at</strong> th<strong>at</strong> as a thought. I would suggest th<strong>at</strong> Sydney is not so much<br />
overcrowded as in many ways it is badly planned. Partly th<strong>at</strong> was due <strong>to</strong> God, who most<br />
inconveniently placed a large Harbour in a variety of very inconvenient spots. But<br />
partly it has been <strong>the</strong> politicians of course. Sydney’s infrastructure has lagged badly<br />
over <strong>the</strong> years. So has Melbourne's, but Melbourne got its act <strong>to</strong>ge<strong>the</strong>r earlier and didn’t<br />
have quite <strong>the</strong> same w<strong>at</strong>er problems th<strong>at</strong> Sydney faces.<br />
The very fact th<strong>at</strong> better infrastructure does away with many of <strong>the</strong> perceived problems<br />
of overcrowding suggests <strong>to</strong> me th<strong>at</strong> migrants aren’t necessarily <strong>the</strong> major problem. So<br />
sure, migrants are <strong>by</strong> definition are a source of overcrowding, but not necessarily a
major source of overcrowding. A major source of overcrowding is bad <strong>to</strong>wn planning<br />
in Australia.<br />
O<strong>the</strong>r risks of course, and you don’t need <strong>to</strong> be Bob Carr when you look <strong>at</strong> this, you<br />
could be young Mr Garrett, or Bob Brown, and you could be worried about<br />
environmental costs. But again, those risks are very real, but <strong>the</strong>y are not necessarily<br />
migrant-rel<strong>at</strong>ed risks. And certainly we should be doing a lot more about w<strong>at</strong>er policies<br />
in Australia. Proper and sensible w<strong>at</strong>er pricing would do away with many of wh<strong>at</strong><br />
would o<strong>the</strong>rwise be seen as environmental problems in Australia.<br />
Now I know again this is sad but I find this chart interesting.<br />
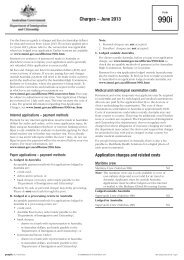
The majorcities have not<br />
been dom inantsince 1970<br />
2%<br />
1%<br />
% change on previous year Regions<br />
doing well<br />
0%<br />
-1%<br />
-2%<br />
Popul<strong>at</strong>ion growth in<br />
-3%<br />
regional Australia less<br />
Regions<br />
growth in <strong>the</strong> 8 capital cities<br />
doing poorly<br />
-4%<br />
1920 1930 1940 1950 1960 1970 1980 1990 2000<br />
When <strong>the</strong> red line is below <strong>the</strong> zero it basically means th<strong>at</strong> <strong>the</strong> popul<strong>at</strong>ion growth in <strong>the</strong><br />
eight capital cities around Australia is faster than <strong>the</strong> popul<strong>at</strong>ion growth in everything<br />
else outside of <strong>the</strong> eight capital cities. And I am sure th<strong>at</strong> we all have <strong>the</strong> impression<br />
th<strong>at</strong> <strong>the</strong> capital cities are continuing <strong>to</strong> soak up a bigger and bigger share of Australia’s<br />
popul<strong>at</strong>ion. In fact th<strong>at</strong> s<strong>to</strong>pped being true around 1970, and rural and regional<br />
Australia has been holding its share of <strong>the</strong> Australian popul<strong>at</strong>ion basically for 30 years.
Now I know th<strong>at</strong> is not <strong>the</strong> common perception. But wh<strong>at</strong>’s been happening is th<strong>at</strong><br />
some areas in rural and regional Australia have been massively losing out and o<strong>the</strong>rs<br />
have been in fact quite spectacular winners. Look <strong>at</strong> <strong>the</strong> Gold Coast. When I was a<br />
child, <strong>the</strong> Gold Coast was essentially not <strong>the</strong>re. Now it is enormous. Wh<strong>at</strong> we’ve had<br />
in many ways is a move in Australia from <strong>the</strong> bush <strong>to</strong> <strong>the</strong> beach. I grew up in Sydney.<br />
When I was a kid <strong>the</strong> expensive suburbs, were places like Killara and St Ives.<br />
Interesting <strong>to</strong> see th<strong>at</strong> in <strong>the</strong> 20 years or so since I left Sydney, <strong>the</strong> faster price growth<br />
has actually been completely along <strong>the</strong> coast line from Palm Beach, through Mosman -<br />
its real centre - all <strong>the</strong> way down <strong>to</strong> Cronulla.<br />
This big push from <strong>the</strong> bush <strong>to</strong> <strong>the</strong> beach, reads almost like a who’s who of areas along<br />
Australia’s coast line. Everywhere from Western Australia <strong>to</strong> New South Wales <strong>to</strong><br />
Queensland. These are regions th<strong>at</strong> are growing stunningly fast.<br />
You can compare <strong>the</strong>se <strong>to</strong> a number of regions th<strong>at</strong> have been losing out. The regions<br />
losing out are inland <strong>by</strong> and large.<br />
Itis<strong>the</strong> coastriding high…<br />
Mandurah<br />
Sunshine Coast<br />
Hervey Bay<br />
Gold Coast-Tweed<br />
Mount Baker<br />
Eurobodalla (NSW)<br />
Bussel<strong>to</strong>n<br />
Ballina<br />
Byron Bay<br />
Hastings (Port Macquarie)<br />
Coffs Harbour<br />
Gre<strong>at</strong> Lakes (Forster)<br />
Livings<strong>to</strong>ne<br />
Cairns<br />
Shoalhaven<br />
70 City Growth<br />
Average 39.4%<br />
Source: Bernard Salt,<br />
The Big Shift<br />
% Growth 1976-2000<br />
0 100 200 300 400 500<br />
Again, <strong>the</strong>re is th<strong>at</strong> same average line, but suddenly it is way over here, and you get <strong>the</strong><br />
likes of Whyalla, and Broken Hill, Goulburn and Mount Isa. These include a surprising<br />
number of South Australian and Tasmanian <strong>to</strong>wns.
So when you talk about overcrowding in Australia, it is not necessarily a capital city<br />
problem. It is certainly not necessarily a migr<strong>at</strong>ion problem. It comes back in many<br />
ways <strong>to</strong> my favourite subject of macroeconomics. People move <strong>to</strong> <strong>the</strong> beach from <strong>the</strong><br />
bush because <strong>the</strong> bush doesn’t have as many jobs as it used <strong>to</strong>. Over time, as we get<br />
higher and higher levels of income, we are spending more on services. And <strong>the</strong> jobs<br />
supplying those services are increasingly being centered in big cities and noticeably<br />
along <strong>the</strong> eastern seaboard of Australia. And so lots of <strong>the</strong> farm and rel<strong>at</strong>ed jobs th<strong>at</strong><br />
were service jobs have actually been centralised well away from rural and regional<br />
Australia.<br />
The o<strong>the</strong>r problem is, of course, th<strong>at</strong> we are much <strong>to</strong>o good <strong>at</strong> doing wh<strong>at</strong> we do in rural<br />
and regional Australia. It is all <strong>to</strong> do with productivity.<br />
Success inproductivity<br />
has bred failureinjobs<br />
260<br />
240<br />
220<br />
Index, 1985-86 = 100<br />
Labour productivity<br />
200<br />
180<br />
160<br />
Agriculture, forestry and fishing<br />
Mining<br />
All industries<br />
140<br />
120<br />
100<br />
Source: ABS, <strong>Access</strong> <strong>Economics</strong><br />
80<br />
1985-86 1988-89 1991-92 1994-95 1997-98 2000-01<br />
This black line down here is productivity in <strong>the</strong> Australian economy as a whole. The<br />
blue line is mining and <strong>the</strong> red one is farming. It means th<strong>at</strong> we are now doing things<br />
like mining and farming with rel<strong>at</strong>ively fewer people than we needed before. For a<br />
<strong>to</strong>nne of whe<strong>at</strong> or a <strong>to</strong>nne of iron ore or coal, we don’t need as many people. So jobs<br />
are being sucked out of rural and regional Australia.
So sure, it’s true th<strong>at</strong> Sydney will see a bunch of popul<strong>at</strong>ion growth in <strong>the</strong> next 30 years.<br />
Th<strong>at</strong>’s about one and a quarter million people. But th<strong>at</strong> is no faster, in fact it is just a<br />
little bit slower than <strong>the</strong> Australian popul<strong>at</strong>ion growth r<strong>at</strong>e across th<strong>at</strong> period. And in<br />
fact, in <strong>the</strong> last 10 or 20 years, <strong>the</strong> popul<strong>at</strong>ion growth in Sydney has been only a little<br />
ahead of Melbourne. It is way behind, though, <strong>the</strong> likes of Brisbane and Perth, and it is<br />
also behind <strong>the</strong> Australian average. Sydney is big, but <strong>the</strong> pace of change in Sydney is<br />
actually slower than everywhere else.<br />
Now we know of course th<strong>at</strong> a bunch of migrants go <strong>to</strong> Sydney in <strong>the</strong> first place, but<br />
when you look <strong>at</strong> <strong>the</strong> pace of migr<strong>at</strong>ion, and I know th<strong>at</strong> <strong>the</strong> migr<strong>at</strong>ion program has<br />
increased in <strong>the</strong> last couple of years, but when you look <strong>at</strong> this across decades, you can<br />
see th<strong>at</strong> Australia’s migr<strong>at</strong>ion program has been coming down as a share of our<br />
popul<strong>at</strong>ion since <strong>the</strong> 50’s. In <strong>the</strong> US <strong>the</strong> official program has been increasing, adding <strong>the</strong><br />
illegals. And proportionally <strong>the</strong> US is probably now taking in more migrants than we’re<br />
taking in here.<br />
We are still a melting pot, in <strong>the</strong> sense th<strong>at</strong> Israel and Canada and <strong>the</strong> US and Australia<br />
have been melting pots in <strong>the</strong> last 50 years. But <strong>the</strong> pace <strong>at</strong> which we are changing is<br />
slower. So although <strong>the</strong>re has been across th<strong>at</strong> same period an increasing globalis<strong>at</strong>ion<br />
of financial markets and product markets, in terms of <strong>the</strong> globalis<strong>at</strong>ion of people<br />
markets and migrants we’ve actually been stepping away.<br />
Sure a whole bunch of migrants go <strong>to</strong> Sydney in <strong>the</strong> first place. Sydney has 1/5 th of <strong>the</strong><br />
Australian popul<strong>at</strong>ion and <strong>the</strong>y get 2/5 th of <strong>the</strong> migrants. But economics as ever plays<br />
its role.<br />
Itistrue th<strong>at</strong>Sydney’s<br />
popul<strong>at</strong>ion w ilgrow<br />
6<br />
5.5<br />
millions<br />
Popul<strong>at</strong>ion living in <strong>the</strong> gre<strong>at</strong>er<br />
Sydney area<br />
5<br />
4.5<br />
4<br />
3.5<br />
Source: ABS<br />
3<br />
2001 2030
So you get net intern<strong>at</strong>ional migrants coming in<strong>to</strong> Sydney, but you get people leaving<br />
New South Wales, again basically Sydney, as a result. A lot of people are cashing in<br />
and going elsewhere. And although Sydney complains, how do you reconcile <strong>the</strong> fact<br />
th<strong>at</strong> Sydney gets double its share of migrants, with <strong>the</strong> fact th<strong>at</strong> its popul<strong>at</strong>ion growth is<br />
no gre<strong>at</strong>er than th<strong>at</strong> of Australia as a whole or even a little bit less.<br />
The answer is, <strong>the</strong> existing residents are leaving and <strong>the</strong>y are doing so very much<br />
because <strong>the</strong>y are cashing in. We all know th<strong>at</strong> <strong>the</strong> s<strong>to</strong>ry as you stand around <strong>the</strong> coffee<br />
machine, is wh<strong>at</strong> <strong>the</strong> house down <strong>the</strong> road, which was an un-renov<strong>at</strong>ed dump, just sold<br />
for. In Sydney those convers<strong>at</strong>ions go on for hours. And in <strong>the</strong> last little while, housing<br />
prices have taken off <strong>at</strong> a pace th<strong>at</strong> <strong>the</strong>y haven’t since <strong>the</strong> l<strong>at</strong>e 80’s in Australia.<br />
But it tends <strong>to</strong> be <strong>the</strong> bigger cities in which <strong>the</strong> average price of housing is higher.<br />
ButSydney’s popul<strong>at</strong>ion grow this<br />
no higherthan ino<strong>the</strong>rm ajorcities<br />
40<br />
35<br />
30<br />
25<br />
20<br />
15<br />
10<br />
5<br />
%<br />
Source: ABS<br />
Popul<strong>at</strong>ion growth<br />
last 10yrs<br />
last 20yrs<br />
0<br />
Sydney Melbourne Brisbane Perth<br />
Because this is how micro-economics is responding <strong>to</strong> <strong>the</strong> congestion costs of <strong>the</strong> fact<br />
th<strong>at</strong> even though Sydney is 1/5 th of Australia’s popul<strong>at</strong>ion, 2/5 th of <strong>the</strong> migrants go<br />
<strong>the</strong>re. It drives up <strong>the</strong> house prices and people cash in. They ei<strong>the</strong>r take a job<br />
somewhere else or often <strong>the</strong>y retire somewhere else. They’re <strong>the</strong> ones th<strong>at</strong> drove one of<br />
those earlier charts because <strong>the</strong>y’re moving up and down <strong>the</strong> coastline <strong>to</strong> Byron Bay or<br />
<strong>the</strong> South Coast.
The one city, of course, which stands out as not being more or less in line with<br />
popul<strong>at</strong>ion as you go down <strong>the</strong> chart is Canberra, because our income, our average<br />
income here is a quarter as high again as <strong>the</strong> Australian average.<br />
But I guess I’ve got <strong>to</strong> allow for one o<strong>the</strong>r rel<strong>at</strong>ed bit th<strong>at</strong> as a macroeconomist I would<br />
tend <strong>to</strong> sk<strong>at</strong>e over. This is <strong>to</strong> me, not so much a Pauline Hanson thing; it is almost a<br />
Mark L<strong>at</strong>ham thing. The make-up of <strong>the</strong> migr<strong>at</strong>ion program, in terms of its sources has<br />
changed very much over time. So, in effect I guess, Pauline was saying th<strong>at</strong> th<strong>at</strong> sort of<br />
change raised cultural costs, which in specific suburbs can be quite large. And if I don’t<br />
happen <strong>to</strong> live in one of those specific suburbs, <strong>the</strong>n my take on migr<strong>at</strong>ion in<strong>to</strong> Australia<br />
will be different <strong>to</strong> somebody who is facing rapid change in <strong>the</strong> ethnic makeup of <strong>the</strong><br />
popul<strong>at</strong>ion around <strong>the</strong>m.<br />
It’s because of th<strong>at</strong> I guess th<strong>at</strong> I can’t completely rule out as a myth <strong>the</strong> very first one<br />
th<strong>at</strong> I mentioned, this overcrowding idea. Because overcrowding does have some<br />
microeconomic problems associ<strong>at</strong>ed with it, and migrants do add <strong>to</strong> it. But do I think<br />
th<strong>at</strong> <strong>the</strong>y add <strong>to</strong> it substantially? No. Wh<strong>at</strong> I think adds <strong>to</strong> it substantially is basically a<br />
lack of good <strong>to</strong>wn planning in Australia, and perhaps particularly in Sydney. You can<br />
always see road projects through marginal elec<strong>to</strong>r<strong>at</strong>es get cancelled every time an<br />
election comes on.<br />
And certainly you look <strong>at</strong> o<strong>the</strong>r rel<strong>at</strong>ed areas of overcrowding - and say <strong>the</strong><br />
environmental carrying capacity of Australia - and a lot of th<strong>at</strong> comes down again <strong>to</strong> <strong>the</strong><br />
fact th<strong>at</strong> we are simply not pricing <strong>the</strong>se things <strong>the</strong> right way, things like w<strong>at</strong>er.<br />
Myth number 2 is of course th<strong>at</strong> migrants are uneduc<strong>at</strong>ed and th<strong>at</strong> <strong>the</strong>y take our jobs.<br />
This has been a very familiar argument across a very long period of time. Economists<br />
are not terribly big fans of th<strong>at</strong> sort of an argument. Whereas <strong>the</strong> real est<strong>at</strong>e mantra is<br />
“loc<strong>at</strong>ion, loc<strong>at</strong>ion, loc<strong>at</strong>ion”, in job markets, it is “skills, skills, skills”.<br />
If you look <strong>at</strong> unemployment r<strong>at</strong>es across different occup<strong>at</strong>ional groups, <strong>the</strong> higher your<br />
skill <strong>the</strong> lower your unemployment r<strong>at</strong>e is <strong>the</strong> rough correl<strong>at</strong>ion. In fact, if you stand<br />
back from Australia and look around <strong>the</strong> world, <strong>the</strong> same is true. Although <strong>the</strong>re are<br />
now actually more white than blue-collar workers in Australia, this is rel<strong>at</strong>ively recent.<br />
And we are actually getting, not this past year, but in general, we are getting four whitecollar<br />
jobs cre<strong>at</strong>ed for every blue-collar job.
The same thing is happening intern<strong>at</strong>ionally, not just for jobs, but for <strong>the</strong> wages th<strong>at</strong> go<br />
with <strong>the</strong> jobs. Do migrants take jobs? No <strong>the</strong>y don’t. They never have. Because each<br />
migrant is, sure, an extra supply of work, which means th<strong>at</strong> potentially <strong>the</strong>y could be<br />
taking somebody’s job. But <strong>the</strong>y are also an extra bit of demand.<br />
Every time say a migrant arrives in, let’s call it Canberra, implicitly you need<br />
Belconnen Mall <strong>to</strong> be th<strong>at</strong> tiny bit bigger than it used <strong>to</strong> be before. Each road <strong>to</strong> be a<br />
tiny bit bigger or maintained th<strong>at</strong> little bit more than it was before. There is a lot of<br />
demand th<strong>at</strong> comes. And sure, <strong>the</strong> supply might arrive a little bit faster than <strong>the</strong><br />
demand, but economics have never been particularly enthused with <strong>the</strong> view th<strong>at</strong><br />
migrants taking jobs. But we are enthused with th<strong>at</strong> idea of “skills, skills and skills”.<br />
And certainly something th<strong>at</strong> I am very happy with is <strong>the</strong> change th<strong>at</strong> we’ve seen in <strong>the</strong><br />
migr<strong>at</strong>ion program in Australia in <strong>the</strong> last couple of years <strong>to</strong> focus more on skills. If you<br />
look <strong>at</strong> it solely in terms of <strong>the</strong> skill set of migrants, <strong>the</strong> skills of migrants coming in<strong>to</strong><br />
Australia are clearly on <strong>the</strong> rise.<br />
Th<strong>at</strong>’s <strong>the</strong> flows, th<strong>at</strong>’s <strong>the</strong> new people coming in.<br />
So Australia’smigrantsaremore<br />
skiled than n<strong>at</strong>ive bornworkers<br />
4.0<br />
3.5<br />
3.0<br />
2.5<br />
2.0<br />
1.5<br />
1.0<br />
0.5<br />
R<strong>at</strong>io of overseas<br />
born <strong>to</strong> n<strong>at</strong>ives<br />
Source: ABS<br />
Australia (basic voc<strong>at</strong>ional and below)<br />
US (high school dropouts)<br />
0.0<br />
1971 (70 for US) 1981 (80 for US) 1991 (90 for US) 1996 (98 for US)<br />
If you look <strong>at</strong> <strong>the</strong> s<strong>to</strong>ck of migrants in<strong>to</strong> Australia you can see red here is Australia,<br />
purple is <strong>the</strong> US, when <strong>the</strong>y are above <strong>the</strong> line, th<strong>at</strong> means more unskilled than <strong>the</strong><br />
existing s<strong>to</strong>ck of residents. So 30 years ago our s<strong>to</strong>ck of migrants was more unskilled
than our s<strong>to</strong>ck of residents, and <strong>the</strong> same was true in <strong>the</strong> US. In <strong>the</strong> US, though, <strong>the</strong>se<br />
unskilled migrants are compounding away <strong>the</strong>re. In Australia we have now a s<strong>to</strong>ck of<br />
migrants who are more skilled than <strong>the</strong> s<strong>to</strong>ck of <strong>the</strong> Australian popul<strong>at</strong>ion.<br />
I actually think th<strong>at</strong> a big s<strong>to</strong>ry in <strong>the</strong> future will be globalis<strong>at</strong>ion extending from<br />
financial markets, <strong>to</strong> product markets, <strong>to</strong> people markets, as some of <strong>the</strong>se thoughts<br />
come home <strong>to</strong> roost.<br />
Now, lots of people think th<strong>at</strong> migrants are quite a drain on budgets. I have done a<br />
bunch of work for DIMIA on this issue in <strong>the</strong> last couple of years. Before I began <strong>the</strong><br />
work, I actually thought th<strong>at</strong> migrants were a drain on budgets. Because I hadn’t done<br />
th<strong>at</strong> basic calcul<strong>at</strong>ion th<strong>at</strong> I mentioned before, th<strong>at</strong> <strong>the</strong>re are three phases <strong>to</strong> a life span.<br />
And th<strong>at</strong> if ano<strong>the</strong>r n<strong>at</strong>ion has paid for educ<strong>at</strong>ion and healthcare costs and somebody is<br />
arriving as a migrant, <strong>the</strong>n we are doing well on an economic and rel<strong>at</strong>ed budget front as<br />
a result.<br />
But let me just take you through some of <strong>the</strong> arguments why. Because ano<strong>the</strong>r n<strong>at</strong>ion<br />
has paid for some of <strong>the</strong> costs on <strong>the</strong> way through, we do well. Because policies have<br />
changed over <strong>the</strong> years <strong>to</strong> limit <strong>the</strong> access of migrants <strong>to</strong> a variety of Government<br />
programs.<br />
Th<strong>at</strong> <strong>to</strong>o has had an impact. Wh<strong>at</strong> it means is th<strong>at</strong> for <strong>the</strong> Federal Government, in<br />
particular, each new migrant is a quite surprisingly high positive boost <strong>to</strong> <strong>the</strong> federal<br />
budget. Less positive for <strong>the</strong> St<strong>at</strong>es, but still positive <strong>the</strong>re as well.<br />
The true tragics amongst economists are not just <strong>the</strong> macroeconomists, <strong>the</strong>y are <strong>the</strong><br />
macroeconomist economitricians. Th<strong>at</strong>’s me. We actually built a model <strong>to</strong> look <strong>at</strong> <strong>the</strong><br />
impact on n<strong>at</strong>ional income, on GDP, from a variety of different things.<br />
For example, we can compare three scenarios. One in which migr<strong>at</strong>ion increases <strong>by</strong><br />
20,000 a year but <strong>the</strong> migrants m<strong>at</strong>ch <strong>the</strong> existing age profile. The second is if <strong>the</strong><br />
additional 20,000 migrants are younger, and <strong>the</strong> third is not increasing migr<strong>at</strong>ion but<br />
raising <strong>the</strong> birth r<strong>at</strong>e <strong>to</strong> 1.8.
-1%<br />
Get‘em while<strong>the</strong>y’re young<br />
(butnot<strong>to</strong>o young)<br />
Lift in n<strong>at</strong>ional income if migr<strong>at</strong>ion up <strong>by</strong> 20,000 per year<br />
8%<br />
7%<br />
6%<br />
5%<br />
4%<br />
3%<br />
2%<br />
1%<br />
0%<br />
Migrants all aged 20-39<br />
Migrants m<strong>at</strong>ch existing age profile<br />
Birth r<strong>at</strong>es <strong>at</strong> 1.8<br />
Source: <strong>Access</strong> <strong>Economics</strong><br />
2000-01 2006-07 2012-13 2018-19 2024-25 2030-31 2036-37<br />
The birth r<strong>at</strong>e scenario actually increased <strong>the</strong> popul<strong>at</strong>ion <strong>by</strong> an extra 30,000.<br />
You can see th<strong>at</strong> if we have a higher birth r<strong>at</strong>e in Australia, it is a long time before you<br />
have a particular impact on <strong>the</strong> income levels on <strong>the</strong> Australian economy.<br />
The blue line <strong>the</strong>re is if migrants coming in<strong>to</strong> Australia exactly m<strong>at</strong>ch <strong>the</strong> age profile of<br />
<strong>the</strong> existing Australian resident popul<strong>at</strong>ion.<br />
This red one is if all <strong>the</strong> migrants are aged 20 <strong>to</strong> 39, or basically <strong>the</strong>y’ve been paid for<br />
<strong>by</strong> ano<strong>the</strong>r country.<br />
Eventually those lines will more or less join up again, because in terms of economic<br />
impacts as each new 20,000 lot of people come in it, it will more or less go though <strong>the</strong><br />
wash of <strong>the</strong> system.<br />
But it is interesting <strong>to</strong> see just how much of a net benefit you get from getting <strong>the</strong> age of<br />
your migrants right in terms of how a macroeconomist economitrician would see it.<br />
Now if you do do th<strong>at</strong>, you have this sort of an impact on <strong>the</strong> Federal surplus.
And you don’thave <strong>to</strong>wait<br />
for<strong>the</strong>m <strong>to</strong>grow up<br />
Lift in Federal surplus if migr<strong>at</strong>ion up <strong>by</strong> 20,000 per year<br />
0.7%<br />
0.6%<br />
0.5%<br />
0.4%<br />
0.3%<br />
0.2%<br />
0.1%<br />
Migrants all aged 20-39<br />
Migrants m<strong>at</strong>ch existing age profile<br />
Birth r<strong>at</strong>es <strong>at</strong> 1.8<br />
% of GDP<br />
Source: <strong>Access</strong> <strong>Economics</strong><br />
0.0%<br />
2000-01 2006-07 2012-13 2018-19 2024-25 2030-31 2036-37<br />
Which is basically about 1/10 th of all <strong>the</strong> numbers before, because you get about 1/10 th<br />
of all <strong>the</strong> net revenue showing up as <strong>the</strong> Federal budget.<br />
Here it is interesting though, because you get an earlier start with this one with <strong>the</strong><br />
migrants.<br />
You not only make money on <strong>the</strong> budget, but you <strong>the</strong>n use th<strong>at</strong> <strong>to</strong> pay off a bit of debt,<br />
which you are o<strong>the</strong>rwise paying interest on.<br />
If you do th<strong>at</strong>, <strong>the</strong> gap between <strong>the</strong>se two age profiles actually gets a lot bigger, because<br />
if you are getting rel<strong>at</strong>ively young adult migrants, <strong>the</strong>n you can do something quickly in<br />
terms of th<strong>at</strong> extra budget revenue <strong>to</strong> pay off a bit of debt.<br />
And whereas in terms of n<strong>at</strong>ional income those red and blue lines were a lot closer and<br />
will eventually join, in terms of budget impact, you are going <strong>to</strong> do a lot better, because<br />
of those interest r<strong>at</strong>e impacts.<br />
If I do <strong>the</strong> same calcul<strong>at</strong>ion <strong>at</strong> <strong>the</strong> St<strong>at</strong>e level.
Better for St<strong>at</strong>eBudgets<br />
0.2%<br />
St<strong>at</strong>e surplus if migr<strong>at</strong>ion/births up <strong>by</strong> 20,000 per year<br />
0.1%<br />
% of GSP<br />
Migrants all aged 20-39<br />
Birth r<strong>at</strong>es <strong>at</strong> 1.8<br />
Migrants m<strong>at</strong>ch existing age profile<br />
0.0%<br />
-0.1%<br />
2000-01 2006-07 2012-13 2018-19 2024-25 2030-31 2036-37<br />
Now this is a model we built for Vic<strong>to</strong>ria.<br />
If you are a St<strong>at</strong>e Government, kids actually cost you a bunch of money, as soon as <strong>the</strong>y<br />
go <strong>to</strong> school.<br />
Because it is costing you th<strong>at</strong> money and you have got <strong>to</strong> pay th<strong>at</strong> interest bill on <strong>the</strong><br />
way through, th<strong>at</strong> sort of holds th<strong>at</strong> down for a long time.<br />
The impact of <strong>the</strong> two age profiles are much more similar for a St<strong>at</strong>e Government,<br />
simply because St<strong>at</strong>e taxes aren’t terribly large compared <strong>to</strong> Federal taxes.<br />
Business migrants have high ave incom es,w hich m eans moretax<br />
There is of course one o<strong>the</strong>r c<strong>at</strong>egory. Mr or Ms Visa Class 457.
Business migrants have high average<br />
incom es,w hich m eans moretax<br />
80<br />
70<br />
60<br />
50<br />
40<br />
30<br />
20<br />
10<br />
0<br />
$000s<br />
Full time annual earnings of business skills migrants<br />
Source: <strong>Access</strong> <strong>Economics</strong><br />
Managers and<br />
administra<strong>to</strong>rs<br />
Professionals<br />
Associ<strong>at</strong>e<br />
professionals<br />
Intermedi<strong>at</strong>e<br />
production<br />
Tradespersons<br />
Advanced<br />
clerical<br />
Intermed.<br />
clerical<br />
Labourers<br />
Elementary<br />
clerical<br />
Now, go back <strong>to</strong> <strong>the</strong> one thing th<strong>at</strong> I do want you <strong>to</strong> take away <strong>to</strong>day, this thought th<strong>at</strong><br />
<strong>the</strong>re is an investment phase, a productive phase and a retirement phase.<br />
And if you are Mr or Ms Visa Class 457, <strong>the</strong>n we haven’t paid for your investment<br />
phase, we are enjoying <strong>the</strong> benefit of your productive phase, double triple whammy<br />
because <strong>the</strong>y have got higher than average incomes and <strong>the</strong>y don’t qualify for things<br />
like Medicare and so on.<br />
But remember, if <strong>at</strong> <strong>the</strong> end of four years or wh<strong>at</strong>ever <strong>the</strong>y disappear again, <strong>the</strong>n some<br />
o<strong>the</strong>r n<strong>at</strong>ion is paying for <strong>the</strong>ir retirement phase. A temporary business migrant with<br />
high income and held back from qualifying for a variety of Government services, in <strong>the</strong><br />
peak of <strong>the</strong>ir productive phase is <strong>the</strong> closest thing <strong>to</strong> a free kick th<strong>at</strong> any n<strong>at</strong>ion is ever<br />
going <strong>to</strong> get for its economy.<br />
Now th<strong>at</strong> of course suggests <strong>to</strong> me th<strong>at</strong> n<strong>at</strong>ions will start <strong>to</strong> realise this and you will be<br />
able <strong>to</strong> open your Sydney Morning Herald and notice Canada advertising for Australian<br />
doc<strong>to</strong>rs and nurses. Or Germany advertising for perhaps IT specialists. Or maybe you<br />
are opening your newspaper and seeing th<strong>at</strong> already, because some n<strong>at</strong>ions have realised<br />
th<strong>at</strong> <strong>the</strong>re are benefits <strong>to</strong> trading in people.<br />
Now, I have spoken about three rel<strong>at</strong>ively anti-migr<strong>at</strong>ion myths. Number four is<br />
essentially a pro-migr<strong>at</strong>ion myth. I’ve talked about <strong>the</strong> potential big challenges, and <strong>the</strong><br />
big structural changes for Australia as <strong>the</strong> ba<strong>by</strong> boomers age. You do get a bunch of
people say, well, all right we have an ageing Australian popul<strong>at</strong>ion, we will have all<br />
<strong>the</strong>se retired people, and we won’t have <strong>the</strong> workers. Why don’t we just import <strong>the</strong><br />
workers? Let’s have much higher migr<strong>at</strong>ion. I am not necessarily sure th<strong>at</strong> th<strong>at</strong> is right<br />
thing <strong>to</strong> do. In a sense we are already doing it, though not <strong>to</strong> s<strong>to</strong>p <strong>the</strong> ageing of<br />
Australia.<br />
Fact:Migrantsare younger,<br />
which helps abit<br />
80%<br />
70%<br />
60%<br />
50%<br />
40%<br />
30%<br />
20%<br />
10%<br />
Age group as share of <strong>to</strong>tal<br />
Source: DIMIA, ABS<br />
2000-01 migrant intake<br />
current Australian<br />
popul<strong>at</strong>ion<br />
0%<br />
0-4 5-14 15-44 45-64 65+<br />
This is <strong>the</strong> age structure of <strong>the</strong> migrant intake and you can see th<strong>at</strong> th<strong>at</strong> is rel<strong>at</strong>ively<br />
young 15 <strong>to</strong> 44 year olds th<strong>at</strong> we are getting and not getting people who are rel<strong>at</strong>ively<br />
more m<strong>at</strong>ure, but I suggest th<strong>at</strong>’s probably more from <strong>the</strong> macroeconomic viewpoint of<br />
getting people early in <strong>the</strong>ir productive phase.<br />
I don’t think it’s because we are trying <strong>to</strong> be<strong>at</strong> <strong>the</strong> ageing problem through migr<strong>at</strong>ion.<br />
You can’t.<br />
There are <strong>to</strong>o few migrants compared <strong>to</strong> <strong>the</strong> political constraints, and migrants when<br />
<strong>the</strong>y come have birth r<strong>at</strong>es not th<strong>at</strong> different <strong>to</strong> those of existing Australian residents.<br />
So <strong>the</strong> m<strong>at</strong>hs, in fact, becomes pretty ridiculous.
Butm igr<strong>at</strong>ion is no easy answ er<br />
<strong>to</strong>Australia’s ageing problem s<br />
40<br />
35<br />
30<br />
Popul<strong>at</strong>ion<br />
(millions)<br />
Source: <strong>Access</strong><br />
<strong>Economics</strong><br />
25<br />
20<br />
15<br />
10<br />
5<br />
Popul<strong>at</strong>ion of extra migrants <strong>to</strong> keep<br />
aged r<strong>at</strong>io constant<br />
Expected popul<strong>at</strong>ion with current<br />
migr<strong>at</strong>ion<br />
0<br />
2003 2007 2011 2015 2019 2023 2027<br />
If you wanted <strong>to</strong> hold <strong>the</strong> share of Australia’s popul<strong>at</strong>ion aged 65 and above constant <strong>by</strong><br />
bringing new workers in, in a quarter of a century our popul<strong>at</strong>ion would already be up <strong>to</strong><br />
38 million. You would have <strong>to</strong> run very, very fast with migr<strong>at</strong>ion <strong>to</strong> hold back <strong>the</strong><br />
ageing tide.<br />
A couple of quick conclusions for you before I get dragged out.<br />
Number one, th<strong>at</strong> <strong>the</strong>re is this investment phase, productive phase and retirement phase.<br />
And number two th<strong>at</strong> <strong>the</strong> proportion of people, and <strong>the</strong> number of people in Australia’s<br />
productive phase will fall away as <strong>the</strong> ba<strong>by</strong> boomers age and retire.<br />
Now th<strong>at</strong> poses considerable opportunities for migr<strong>at</strong>ion policy makers in Australia <strong>to</strong><br />
think about. I certainly think th<strong>at</strong> migr<strong>at</strong>ion can address some of <strong>the</strong> difficulties.<br />
I particularly think refugees are a separ<strong>at</strong>e question and I have left <strong>the</strong>m aside and I will<br />
let <strong>the</strong> politicians argue th<strong>at</strong>. But just in terms of <strong>the</strong> rest of <strong>the</strong> migr<strong>at</strong>ion program,<br />
<strong>the</strong>re is a lot of sense in concentr<strong>at</strong>ing on skill. There is an enormous amount of sense<br />
in actually concentr<strong>at</strong>ing on 457 visa class people, people who are here for just a little<br />
while and we basically get <strong>the</strong>ir upside.<br />
The world is increasingly realising th<strong>at</strong>. Canada and Germany and <strong>the</strong> UK and so on<br />
are realising th<strong>at</strong> this globalis<strong>at</strong>ion of <strong>the</strong> trade in people will become increasingly<br />
important.
And it is important th<strong>at</strong> we realise it here in Australia. Not merely because of migrants<br />
- people on <strong>the</strong> way in - but <strong>the</strong>re is <strong>the</strong> issue of people on <strong>the</strong> way out, which has been<br />
on a long term up-trend as well.<br />
As com petition for<br />
migrantscuts bothways<br />
90000<br />
Australian resident long-term departures<br />
80000<br />
70000<br />
60000<br />
50000<br />
40000<br />
30000<br />
20000<br />
Source: DIMIA<br />
10000<br />
0<br />
1960 1963 1966 1969 1972 1975 1978 1981 1984 1987 1990 1993 1996 1999<br />
This is a two way street, and if we get <strong>the</strong> Australian macro-economy right, and if we<br />
get our overall policies right, <strong>the</strong>n it’s not merely a case of we won’t mess up <strong>the</strong><br />
inflows but we won't mess up <strong>the</strong> outflows. We will keep <strong>the</strong> Aussies before <strong>the</strong>y<br />
disappear.<br />
So, my basic thought here is globalis<strong>at</strong>ion. Skilled labour will increasingly become a<br />
tradeable commodity.<br />
Some n<strong>at</strong>ions are realising th<strong>at</strong>. Australia, in terms of its policies, seems <strong>to</strong> be <strong>at</strong> <strong>the</strong><br />
forefront.<br />
But maybe if you have some of those concepts, <strong>the</strong> investment phase, <strong>the</strong> productive<br />
phase, and <strong>the</strong> retirement phase, and wh<strong>at</strong> will happen <strong>to</strong> Australia’s economic growth<br />
as a result of <strong>the</strong> retirement of <strong>the</strong> ba<strong>by</strong> boomers hopefully <strong>the</strong>y will help your role as<br />
policy makers in this Department.