Entropy Inference and the James-Stein Estimator, with Application to ...
Entropy Inference and the James-Stein Estimator, with Application to ... Entropy Inference and the James-Stein Estimator, with Application to ...
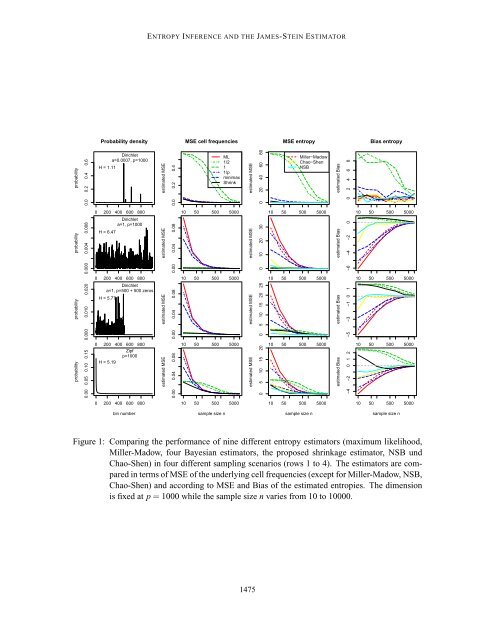
HAUSSER AND STRIMMER The true cell probabilities θ 1 ,...,θ 1000 were assigned in four different fashions, corresponding to rows 1-4 in Figure 1: 1. Sparse and heterogeneous, following a Dirichlet distribution with parameter a = 0.0007, 2. Random and homogeneous, following a Dirichlet distribution with parameter a = 1, 3. As in scenario 2, but with half of the cells containing structural zeros, and 4. Following a Zipf-type power law. For each sampling scenario and sample size, we conducted 1000 simulation runs. In each run, we generated a new set of true cell frequencies and subsequently sampled observed counts y k from the corresponding multinomial distribution. The resulting counts y k were then supplied to the various entropy and cell frequencies estimators and the squared error ∑ 1000 i=k (θ k − ˆθ k ) 2 was computed. From the 1000 repetitions we estimated the mean squared error (MSE) of the cell frequencies by averaging over the individual squared errors (except for the NSB, Miller-Madow, and Chao-Shen estimators). Similarly, we computed estimates of MSE and bias of the inferred entropies. 4.2 Summary of Results from Simulations Figure 1 displays the results of the simulation study, which can be summarized as follows: • Unsurprisingly, all estimators perform well when the sample size is large. • The maximum likelihood and Miller-Madow estimators perform worst, except for scenario 1. Note that these estimators are inappropriate even for moderately large sample sizes. Furthermore, the bias correction of the Miller-Madow estimator is not particularly effective. • The minimax and 1/p Bayesian estimators tend to perform slightly better than maximum likelihood, but not by much. • The Bayesian estimators with pseudocounts 1/2 and 1 perform very well even for small sample sizes in the scenarios 2 and 3. However, they are less efficient in scenario 4, and completely fail in scenario 1. • Hence, the Bayesian estimators can perform better or worse than the ML estimator, depending on the choice of the prior and on the sampling scenario. • The NSB, the Chao-Shen and the shrinkage estimator all are statistically very efficient with small MSEs in all four scenarios, regardless of sample size. • The NSB and Chao-Shen estimators are nearly unbiased in scenario 3. The three top-performing estimators are the NSB, the Chao-Shen and the prosed shrinkage estimator. When it comes to estimating the entropy, these estimators can be considered identical for practical purposes. However, the shrinkage estimator is the only one that simultaneously estimates cell frequencies suitable for use with the Shannon entropy formula (Equation 1), and it does so with high accuracy even for small samples. In comparison, the NSB estimator is by far the slowest method: in our simulations, the shrinkage estimator was faster by a factor of 1000. 1474
ENTROPY INFERENCE AND THE JAMES-STEIN ESTIMATOR Probability density MSE cell frequencies MSE entropy Bias entropy probability 0.0 0.2 0.4 0.6 H = 1.11 Dirichlet a=0.0007, p=1000 estimated MSE 0.0 0.2 0.4 ML 1/2 1 1/p minimax Shrink estimated MSE 0 20 40 60 80 Miller−Madow Chao−Shen NSB estimated Bias 0 2 4 6 8 0 200 400 600 800 10 50 500 5000 10 50 500 5000 10 50 500 5000 probability 0.000 0.004 0.008 H = 6.47 Dirichlet a=1, p=1000 estimated MSE 0.00 0.04 0.08 estimated MSE 0 10 20 30 estimated Bias −6 −4 −2 0 0 200 400 600 800 10 50 500 5000 10 50 500 5000 10 50 500 5000 probability 0.000 0.010 0.020 Dirichlet a=1, p=500 + 500 zeros H = 5.77 estimated MSE 0.00 0.04 0.08 estimated MSE 0 5 10 15 20 25 estimated Bias −5 −3 −1 0 1 probability 0.00 0.05 0.10 0.15 0 200 400 600 800 Zipf p=1000 H = 5.19 estimated MSE 0.00 0.04 0.08 10 50 500 5000 estimated MSE 0 5 10 15 20 10 50 500 5000 estimated Bias −4 −2 0 1 2 10 50 500 5000 0 200 400 600 800 10 50 500 5000 10 50 500 5000 10 50 500 5000 bin number sample size n sample size n sample size n Figure 1: Comparing the performance of nine different entropy estimators (maximum likelihood, Miller-Madow, four Bayesian estimators, the proposed shrinkage estimator, NSB und Chao-Shen) in four different sampling scenarios (rows 1 to 4). The estimators are compared in terms of MSE of the underlying cell frequencies (except for Miller-Madow, NSB, Chao-Shen) and according to MSE and Bias of the estimated entropies. The dimension is fixed at p = 1000 while the sample size n varies from 10 to 10000. 1475
- Page 1 and 2: Journal of Machine Learning Researc
- Page 3 and 4: ENTROPY INFERENCE AND THE JAMES-STE
- Page 5: ENTROPY INFERENCE AND THE JAMES-STE
- Page 9 and 10: ENTROPY INFERENCE AND THE JAMES-STE
- Page 11 and 12: ENTROPY INFERENCE AND THE JAMES-STE
- Page 13 and 14: ENTROPY INFERENCE AND THE JAMES-STE
- Page 15 and 16: ENTROPY INFERENCE AND THE JAMES-STE
ENTROPY INFERENCE AND THE JAMES-STEIN ESTIMATOR<br />
Probability density<br />
MSE cell frequencies<br />
MSE entropy<br />
Bias entropy<br />
probability<br />
0.0 0.2 0.4 0.6<br />
H = 1.11<br />
Dirichlet<br />
a=0.0007, p=1000<br />
estimated MSE<br />
0.0 0.2 0.4<br />
ML<br />
1/2<br />
1<br />
1/p<br />
minimax<br />
Shrink<br />
estimated MSE<br />
0 20 40 60 80<br />
Miller−Madow<br />
Chao−Shen<br />
NSB<br />
estimated Bias<br />
0 2 4 6 8<br />
0 200 400 600 800<br />
10 50 500 5000<br />
10 50 500 5000<br />
10 50 500 5000<br />
probability<br />
0.000 0.004 0.008<br />
H = 6.47<br />
Dirichlet<br />
a=1, p=1000<br />
estimated MSE<br />
0.00 0.04 0.08<br />
estimated MSE<br />
0 10 20 30<br />
estimated Bias<br />
−6 −4 −2 0<br />
0 200 400 600 800<br />
10 50 500 5000<br />
10 50 500 5000<br />
10 50 500 5000<br />
probability<br />
0.000 0.010 0.020<br />
Dirichlet<br />
a=1, p=500 + 500 zeros<br />
H = 5.77<br />
estimated MSE<br />
0.00 0.04 0.08<br />
estimated MSE<br />
0 5 10 15 20 25<br />
estimated Bias<br />
−5 −3 −1 0 1<br />
probability<br />
0.00 0.05 0.10 0.15<br />
0 200 400 600 800<br />
Zipf<br />
p=1000<br />
H = 5.19<br />
estimated MSE<br />
0.00 0.04 0.08<br />
10 50 500 5000<br />
estimated MSE<br />
0 5 10 15 20<br />
10 50 500 5000<br />
estimated Bias<br />
−4 −2 0 1 2<br />
10 50 500 5000<br />
0 200 400 600 800<br />
10 50 500 5000<br />
10 50 500 5000<br />
10 50 500 5000<br />
bin number<br />
sample size n<br />
sample size n<br />
sample size n<br />
Figure 1: Comparing <strong>the</strong> performance of nine different entropy estima<strong>to</strong>rs (maximum likelihood,<br />
Miller-Madow, four Bayesian estima<strong>to</strong>rs, <strong>the</strong> proposed shrinkage estima<strong>to</strong>r, NSB und<br />
Chao-Shen) in four different sampling scenarios (rows 1 <strong>to</strong> 4). The estima<strong>to</strong>rs are compared<br />
in terms of MSE of <strong>the</strong> underlying cell frequencies (except for Miller-Madow, NSB,<br />
Chao-Shen) <strong>and</strong> according <strong>to</strong> MSE <strong>and</strong> Bias of <strong>the</strong> estimated entropies. The dimension<br />
is fixed at p = 1000 while <strong>the</strong> sample size n varies from 10 <strong>to</strong> 10000.<br />
1475


