Zimbabwe Stock Exchange Overview- May 2012 - Imara
Zimbabwe Stock Exchange Overview- May 2012 - Imara
Zimbabwe Stock Exchange Overview- May 2012 - Imara

Create successful ePaper yourself
Turn your PDF publications into a flip-book with our unique Google optimized e-Paper software.
EXECUTIVE SUMMARY<br />
Recent results released by leading hoteliers point towards<br />
improving occupancies, RevPARs and ADRS locally. We<br />
expect this positive earnings outlook to continue, given the<br />
positive outlook for the tourism sector. Our range of<br />
scenarios for RevPAR growth is xx, given the limited supply<br />
growth until 2013.<br />
With occupancies recovering towards peak levels we could<br />
see room supply coming at a premium. Prospects for<br />
discount business with corporate transient customers.<br />
Tight supply environment an important tailwind for African<br />
Sun<br />
An increase in local salaries should boost local consumer<br />
spent while investment interest in the country should boost<br />
foreign business visitors<br />
An improvement in the global economy will also support the<br />
tourism industry.<br />
Better earnings visibility for Cresta Hospitality and Meikles,<br />
because of their simpler more defensive business model.<br />
Business travel and tourism is less fickle than leisure travel<br />
so the group’s profits are likely to show defensive qualities.<br />
We also like African Sun because it has already expanded<br />
regionally, and is more diversified.<br />
Operating cost inflation, and subdued consumer and<br />
corporate profits.The lack of incremental costs on new<br />
management contracts should buoy results for African Sun<br />
Not cash generative because of capex projects.<br />
Prospects for hotels have strong longer term drivers,<br />
Economic growth and varied and unique tourist offering.<br />
<strong>Zimbabwe</strong> <strong>Stock</strong> <strong>Exchange</strong> <strong>Overview</strong>- <strong>May</strong> <strong>2012</strong><br />
Fortune favours the brave....<br />
Analysts<br />
Addmore Chakurira Batanai Matsika Nontando Zunga<br />
+263 772 265 454 +263 772 889 556 +263 772 772 755<br />
addmore.chakurira@imara.co batanai.matsika@imara.co nontando.zunga@imara.co
CONTENTS SECTOR PAGE<br />
EXECUTIVE SUMMARY 4<br />
ZIMBABWE IN FIGURES: MACROECONOMIC INDICATORS 5<br />
ZIMBABWE – MACRO-ECONOMIC OVERVIEW 6<br />
THE ZIMBABWE STOCK EXCHANGE OVERVIEW 10<br />
Companies In Detail<br />
AICO AFRICA LI MITED Agriculture 15<br />
BARCLAYS BANK ZIMBABWE LIMITED Financial 18<br />
BAT ZIMBABWE LIMITED Tobacco 21<br />
CBZ HOLDINGS LIMITED Financial 24<br />
DAIRIBORD HOLDINGS LIMITED Food 27<br />
DELTA CORPORATION LIMITED Beverages 30<br />
ECONET WIRELESS LIMITED Telecoms 33<br />
HIPPO VALLEY ESTATES Agriculture 36<br />
INNSCOR AFRICA LIMITED Conglomerate 39<br />
MASAWARA Investment Holding 42<br />
MASHONALAND HOLDINGS LIMITED Property 44<br />
MEIKLES Conglomerate 47<br />
OK ZIMBABWE LIMITED Retail 50<br />
NEW DAWN MINING Mining 53<br />
PADENGA HOLDINGS LIMITED Agriculture 56<br />
PEARL PROPERTIES LIMITED Property 59<br />
SEED CO Agriculture 62<br />
TA HOLDINGS LIMITED Conglomerate 65<br />
ZIMPLATS LIMITED Mining 68
Appendix to Abbreviations:<br />
ADR: Average daily rate<br />
AfDB: African Development Bank<br />
ARPU: Average Revenue Per User<br />
CB:<br />
Central Bank<br />
CIMCG: China International Mining Group Corporation<br />
FAO: Food and Agricultural Organisation<br />
FDI:<br />
Foreign direct investment<br />
FMCG: Fast Moving Consumer Goods<br />
Forex: Foreign <strong>Exchange</strong><br />
GDP: Gross Domestic Product<br />
GNU: Government of National Unity<br />
HIPC: Heavily Indebted Poor Countries<br />
IES:<br />
<strong>Imara</strong> Edwards Securities (Pvt.) Ltd <strong>Zimbabwe</strong><br />
IAS:<br />
<strong>Imara</strong> Africa Securities Limited<br />
IFSC: International Financial Services Centre<br />
MDRI: Multi-lateral Debt Relief Initiative<br />
NIEEF: National Indigenisation and Economic Empowerment<br />
NII:<br />
Net Interest Income<br />
NIM:<br />
Net Interest Margin<br />
NPL:<br />
Non Performing Loan<br />
NPV: Net Present Value<br />
NSAS: National Sugar Adaptation Strategy<br />
OMIR: Old Mutual Implied Rate<br />
Pp:<br />
per person<br />
RBZ:<br />
Reserve Bank of <strong>Zimbabwe</strong><br />
REVPAR: Revenue per available room<br />
SADC: Southern African Development Community<br />
S.O.P: Sum of parts<br />
SSA:<br />
Sub-Saharan Africa<br />
US$:<br />
United States Dollar<br />
W.H.O: World Health Organisation<br />
ZIMRA: <strong>Zimbabwe</strong> Revenue Authority<br />
ZSE:<br />
<strong>Zimbabwe</strong> <strong>Stock</strong> <strong>Exchange</strong><br />
Z$:<br />
<strong>Zimbabwe</strong> Dollar<br />
3
EXECUTIVE SUMMARY<br />
Recovery on course although beleaguered somewhat by unfavourable atmosphere..<br />
Four years on in a dollarised economic environment and the economy is still on a growth path, beleaguered<br />
somewhat by an unfavourable financial and political atmosphere. The global economy is expected to grow by<br />
2.5% in <strong>2012</strong> and 3.1% in 2013 according to the World Bank. High income growth countries are expected to post<br />
a 1.4% growth in <strong>2012</strong> and 2.0% in 2013. Developing countries are forecast to grow by 5.4%. These estimates<br />
have been revised downwards from initial estimates made in June 2011 and the Bank insists that even achieving<br />
these outturns is very uncertain. The downturn in Europe and weaker growth in developing countries raises the<br />
risk of the two developments reinforcing each other. Despite the global economic crisis, Sub Sahara Africa is set<br />
to growth by more than 5%, while the <strong>Zimbabwe</strong>an economy is expected to grow by 9.4%.<br />
Agriculture/mining sectors, the biggest talking point<br />
Major propellers of local economic growth have been the mining and agricultural sectors. The Ministry of<br />
Finance estimates that the mining sector (projected to grow by 15.9% in <strong>2012</strong>) will remain the major driving<br />
force behind overall economic growth. The sector is expected to benefit from firming international commodity<br />
prices, strategies to lower electricity supply interruptions and additional private capital injections. The<br />
agricultural sector is expected to grow by 11.6% in <strong>2012</strong> on the back of increased funding initiatives. The<br />
country’s annual inflation is also expected to end the year at 5%. Several issues, however, threaten the stability<br />
of the inflation rate including high utility charges, higher import duties on some basic goods and exchange rate<br />
risk against the Rand as most of the basic goods are still being imported.<br />
Pell-mell performance on the local bourse due to indigestible policies<br />
For 2011 both the industrial and mining indices were down with the industrial index losing 3.58% whilst the<br />
mining index lost 49.75%. Although the performance was in line with regional exchanges and some international<br />
indices, the mining index was further weakened by the local policy issues. Year to date, the indices have<br />
weakened further with the industrial index down 10.62% whilst the mining index is down 9.51%, this is in<br />
contrast to the positive performance on the regional and international bourses, where the regional exchanges<br />
are up on average by 7% whilst the main international indices have gained an average of 5%. The poor<br />
performance on the local front could be attributed to inconsistency on policy pronouncements mainly relating<br />
to indigenisation and elections. For <strong>2012</strong>, we expect some improvement driven by improving company<br />
performance. The market capitalisation to GDP ratio declined in 2011 to 36% from 45% in 2010, this however<br />
still compares favorably with the SSA average of above 50%.<br />
The other side of the coin<br />
Post the hyperinflationary era, most companies are now afloat, after an almost precarious position. A number of<br />
corporate earnings statements have been positive in support of an improving economy. The indigenisation issue<br />
however remains contentious, with the end document not having been clarified. Investor sentiment has been<br />
rattled with minimal foreign direct participation. Consoling, however, is the fact that in October 2011<br />
government released a Gazette revising the indigenisation regulations to state that foreign owned firms could<br />
now indigenise their 51% equity over 4 years; with 26% to be localised in the first year, 10% in the second year,<br />
10% in the third year and 5% in the fourth year. Despite talks of elections, we see them as unlikely to occur in<br />
<strong>2012</strong>, as the liquidity strain continues to bite. The constitution making process is yet to be finalised, then the<br />
referendum has to follow before we can have elections. We forecast that at the earliest, we could have the<br />
elections late 2013, however, the noose is still ominously around the neck as politicians continue to issue<br />
divergence statements.<br />
Jump onto the bandwagon..<br />
Despite top line growth ahead of inflation, heavy interest costs continue to negate positive performance in<br />
many listed companies. A classic case is that of PG Industries, whose gearing stands at a high of 136%. Several<br />
other companies remain hugely undercapitalised hampering earnings growth and curtailing share price<br />
performance. Rio Zim recently concluded a rights offer which should see its huge debt being paid, thus lowering<br />
finance costs and possibly returning the group to viability. Several other companies are also carrying out<br />
corporate activities, and although the prospects of deleveraging are attractive, other factors such as the<br />
unclear indigenisation policy and likelihood of elections continue to draw back significant progress. The<br />
economic recovery should however continue and is likely to accelerate if further reforms are enacted by the<br />
authorities. It is our view that <strong>Zimbabwe</strong> offers great potential as a recovery play and we urge investors to take<br />
positions in rapidly growing, dominant, well managed and strong cash generating companies such as BATZ,<br />
Dairibord, Delta, Econet, Innscor, OK <strong>Zimbabwe</strong>, Padenga and SeedCo.<br />
4
<strong>Zimbabwe</strong> in Figures: Macroeconomic indicators<br />
THE 2009-2014 MACRO-ECONOMIC FRAMEWORK<br />
2009 Act 2010 Est 2011 Proj <strong>2012</strong> Proj 2013 Proj 2014 Proj<br />
Real sector and inflation (US$ m and %)<br />
Nominal GDP level in US$ m 5,623.0 6,716.0 8,998.0 9,959.0 11,297.0 12,711.0<br />
Real Gdp growth (%) 5.4 8.1 9.3 7.8 6.6 6.4<br />
Annual Inflation (average %) -7.7 3.0 4.5 5.0 5.5 5.7<br />
Central Government (US$m)<br />
Total revenue and Budget Grants 974.4 2,339.1 2,744.9 3,400.0 3,841.0 4,321.0<br />
Revenue(Tax and Non Tax) 933.1 2,339.1 2,744.9 3,400.0 3,841.0 4,321.0<br />
Budget Grants 41.3 0.0 0.0 0.0 0.0 0.0<br />
Off Budget Grants 93.0 500.0 500.0 500.0 0.0 0.0<br />
Total expenditure Central Government 920.9 2,106.9 2,744.9 3,400.0 3,841.0 4,321.0<br />
Current expenditure 804.0 1,603.0 2,140.2 2,495.5 2,734.7 2,975.2<br />
OW: Employment costs 550.3 1,098.5 1,800.0 2,040.0 2,112.5 2,160.9<br />
Other recurrent expenditures 182.0 504.8 340.2 340.2 455.5 622.2<br />
Capital expenditure 45.2 415.3 550.0 850.0 1,056.3 1,296.5<br />
External Sector(US$m)<br />
Exports(fob) 1,613.3 3,380.1 4,143.7 4,604.1 5,164.4 5,684.6<br />
Imports(fob) 3,213.1 5,161.8 5,599.6 5,731.5 6,015.5 6,355.0<br />
Current Account Balance (1,140.3) (1,852.5) (1,565.0) (1,247.6) (1,034.3) (894.6)<br />
Capital Account (656.5) 617.5 775.4 809.5 849.8 847.7<br />
Overall Balance of Payments (1,867.0) (412.1) (789.7) (438.2) (184.5) (46.9)<br />
Memorandum Items As a % of GDP<br />
Revenues 16.60% 34.80% 30.50% 34% 34% 34%<br />
Expenditure and Net Lending 16.40% 31.40% 30.50% 34.10% 34% 34%<br />
Current expenditure 14.30% 23.90% 23.80% 25.10% 24.20% 23.40%<br />
OW: Employment costs 9.80% 16.40% 20% 20.50% 18.70% 17%<br />
Other recurrent expenditure 3.20% 7.50% 3.80% 3.40% 4% 4.90%<br />
Capital expenditure 0.80% 6.20% 6.10% 8.50% 9.40% 10.20%<br />
External Sector<br />
Exports fob 28.70% 50.30% 46.10% 46.20% 45.70% 44.70%<br />
Imports fob 57.10% 76.90% 62.20% 57.60% 53.20% 50%<br />
As % of Total Expenditures<br />
Current expenditure 87.30% 76.10% 78% 73.40% 71.20% 68.90%<br />
OW: Employment costs 59.80% 52.10% 65.60% 60% 55% 50%<br />
Other current expenditures 19.80% 24% 12.40% 10% 11.90% 14.40%<br />
Capital expenditure 4.90% 19.70% 20% 25% 27.50% 30%<br />
Source: Ministry of Finance, Reserve Bank of <strong>Zimbabwe</strong><br />
GDP Growth Rates<br />
0.30<br />
0.25<br />
0.20<br />
0.15<br />
0.10<br />
0.05<br />
0.00<br />
2011 <strong>2012</strong>F<br />
Source: Ministry of Finance<br />
GDP Growth rate<br />
%<br />
12<br />
8<br />
4<br />
0<br />
-4 2008 2009 2010e 2011 <strong>2012</strong>f<br />
-8<br />
-12<br />
-16<br />
Source: IMF, Ministry of Finance<br />
2011 Revenue Contribution<br />
Corporate<br />
10%<br />
Other direct<br />
taxes<br />
7%<br />
Personal<br />
Income<br />
20%<br />
Non tax<br />
revenue<br />
8%<br />
Source: Ministry of Finance<br />
Other<br />
1%<br />
Customs Duty<br />
12%<br />
VAT<br />
31%<br />
Excise Duty<br />
11%<br />
5
ZIMBABWE – MACRO-ECONOMIC OVERVIEW<br />
Economy expected to remain on a growth path<br />
The gross domestic product has been on the rise, growing<br />
by 5.4% in 2009, 8.1% in 2010, 9.3% in 2011 and is<br />
projected to move up by 9.4% in <strong>2012</strong>. Major propellers of<br />
economic growth have been the mining and agricultural<br />
sectors. The Ministry of Finance estimates that the mining<br />
sector (projected to grow by 15.9%) will remain the major<br />
driving force behind overall economic growth. The sector<br />
is expected to benefit from firming international<br />
commodity prices, strategies to lower electricity supply<br />
interruptions and additional private capital injections.<br />
The agricultural sector is expected to grow by 11.6% in<br />
<strong>2012</strong> on the back of increased funding initiatives.<br />
...although the IMF expects the growth rate to<br />
moderate<br />
As we pointed out in our <strong>2012</strong> Outlook report, in its 2011<br />
Article IV Consultation (<strong>May</strong> 2011), the IMF cited two<br />
scenarios for the economy. Under an unchanged policies<br />
scenario, the group forecast that the GDP growth rate<br />
would decline to about 3.0% as investment remains<br />
subdued as a result of:<br />
• Significant structural impediments,<br />
• The acceleration of indigenisation in mining<br />
• Uncertainties about the ownership requirements in<br />
the sector<br />
Higher commodity prices and increased diamond exports<br />
if achieved were however forecast to underpin higher<br />
growth, higher budget revenues, and a faster reduction of<br />
the current account deficit.<br />
According to the IMF, additional downside risks for the<br />
outlook include:<br />
• Political disturbances<br />
• Export price declines<br />
• Higher-than-anticipated increases in import food<br />
and fuel prices<br />
• Unfavourable weather<br />
• Reversals of capital inflows<br />
• Banking system instability.<br />
Under the alternative, recommended policies scenario,<br />
the IMF assumed that the government would eliminate<br />
expenditure overruns while leaving more fiscal space for<br />
critical infrastructure and social spending in 2011 and<br />
start rebuilding fiscal buffers in the medium term,<br />
forcefully address financial sector vulnerabilities, and<br />
strengthen the business climate.<br />
According to its forecast, in 2011, the economy was to<br />
have grown by 7.2% mainly because of higher capital<br />
inflows providing for more working capital and higher<br />
investment into the mining sector, as well as from higher<br />
public investment in critical infrastructure. In the<br />
medium term, the country could thus potentially boost<br />
growth performance by about 3.0% relative to the<br />
unchanged policies scenario, and increase international<br />
reserves to about 1 month of imports by 2016.<br />
Revenue Collections<br />
Q1 <strong>2012</strong> - (<strong>Zimbabwe</strong> Revenue Authority) Zimra total<br />
gross collections stood at US$ 773.7m (against a target<br />
US$ 715.4m). Net collections for the quarter amounted<br />
to US$ 723.9m, 1.2% above budget. Value added tax was<br />
the highest contributor at US$ 292.7m (38% of total),<br />
individual tax 19% and excise duty US$ 88.9m.<br />
According to the Minister of finance, diamonds and nontax<br />
revenues for February <strong>2012</strong> amounted to US$ 5.0m<br />
and US$ 7.4m against targets of US$ 41.5m and US$<br />
10.5m, respectively. For January and February, actual<br />
diamond collections totalled US$ 19.5m, against a target<br />
of US$ 77.5m, (non-tax revenue US$ 18.5m against a<br />
target of US$ 21.0m). In terms of the budget<br />
performance, there is already a gap with total<br />
expenditure of US$ 286.9m exceeding revenues of US$<br />
227.7m.<br />
The Revenue to GDP ratio is expected to grow from 30%<br />
to 34%, from ongoing tax reforms focusing on ZIMRA<br />
restructuring, compliance initiatives and increased<br />
automation of tax collection systems. In total for FY<br />
<strong>2012</strong>, government revenues are estimated at US$ 4.0bn,<br />
with US$ 0.6bn expected from diamond revenues. Total<br />
expenditure is expected to amount to US$ 3.4bn, with<br />
US$ 2.0bn committed to employment costs (60% of total<br />
expenditure) whilst the US$ 600.0m from diamond<br />
receipts is targeted for capital projects. The MoF<br />
targets to reduce the employment costs/total<br />
expenditure ratio to 50% by 2014, whilst capital<br />
expenditure is expected to improve to about 25% in<br />
<strong>2012</strong>, against a desired target of 30% by 2014.<br />
Inflation expected to remain stable<br />
Inflation, stood at 4.3% for the first two months of <strong>2012</strong><br />
down from 4.9% for December 2011, while for March<br />
<strong>2012</strong> the y-o-y rate was 3.98%. On a month-on-month<br />
basis, inflation decreased from 0.49% in February <strong>2012</strong><br />
to 0.43% in March <strong>2012</strong>.<br />
The country’s annual inflation is however expected to<br />
end the year at 5%. Several issues threaten the stability<br />
of the inflation rate including high utility charges,<br />
higher import duties on some basic goods and exchange<br />
rate risk against the Rand as most of the basic goods are<br />
still being imported.<br />
6
<strong>Zimbabwe</strong> Inflation Rates<br />
8<br />
6<br />
4<br />
2<br />
0<br />
-2<br />
-4<br />
-6<br />
Jan<br />
Feb<br />
Mar<br />
Apr<br />
<strong>May</strong><br />
Jun<br />
Jul<br />
Aug<br />
Sep<br />
Oct<br />
Nov<br />
Dec<br />
Jan<br />
Feb<br />
Mar<br />
Apr<br />
<strong>May</strong><br />
Jun<br />
Jul<br />
Aug<br />
Sep<br />
Oct<br />
Nov<br />
Dec<br />
Jan<br />
Feb<br />
Mar<br />
Source: CSO<br />
2010 2011 <strong>2012</strong><br />
Inflation rate (%) monthly<br />
Inflation rate (%) Annual<br />
The country still has a colossal trade deficit<br />
For 2011, total export earnings amounted to US$ 4.1bn,<br />
registering growth of 30.2%, whilst 11.1% growth is<br />
forecast for <strong>2012</strong> which should bring export earnings to<br />
US$ 4.6bn following firm international commodity prices<br />
and increased throughput from agriculture, mining and<br />
manufacturing. Imports for 2011 amounted to US$ 5.6bn,<br />
and are expected to grow to US$ 5.7bn for <strong>2012</strong> leading<br />
to a further expansion in the trade deficit and a widening<br />
current account (CA) deficit as other contributors such as<br />
services and investment income have not yet fully<br />
recovered. Imported goods largely comprise fuel, food,<br />
machinery and motor vehicles as the local manufacturing<br />
sector is still characterised by undercapitalisation. The<br />
current account deficit of US$ 1.5bn stands at 17% of the<br />
country’s GDP.<br />
Liquidity situation set to improve from PTA and<br />
international banks support<br />
PTA Bank has a keen interest in resuscitating the country<br />
and has been working with banks and corporates in the<br />
provision of affordable funding to alleviate the liquidity<br />
challenges. The bank is looking at lending out US$ 0.5bn<br />
in <strong>2012</strong> in the SSA region. The bank recently lent US$<br />
4.0m to Dairibord, at an 11% all in cost for a period of 12<br />
months. In an environment faced with high liquidity<br />
strain, local banks have been charging a huge premium on<br />
supply of funding with high interest rates averaging 20%<br />
per annum. Cooperation from international banks,<br />
charging affordable rates, will thus assist to alleviate the<br />
liquidity crisis in the cash stripped economy.<br />
Money market rates softer backed by improving money<br />
supply<br />
Proceeds from the tobacco selling season and repatriated<br />
nostro account balances have somewhat led to a softening<br />
in money market rates. From the banks, US$ 200.0m was<br />
expected from the nostro accounts. As a result, money<br />
market interest rates declined from 14% - 16% at the<br />
beginning of the year to between 10% - 12%, whilst<br />
lending rates now range between 15% - 18% from previous<br />
highs of 18% - 22%. The measures are short term however,<br />
thus the long term liquidity position still remains<br />
unresolved meaning the lending rates are unlikely to<br />
decline significantly in the near term.<br />
Political Outlook<br />
<strong>Zimbabwe</strong> recently celebrated 32 years of independence,<br />
with four years in a dollarised economic environment;<br />
most companies are now afloat, after an almost<br />
precarious position. A number of corporate earnings<br />
statements have been positive in support of an improving<br />
economy. The indigenisation issue remains contentious,<br />
with the end document not having been clarified.<br />
Investor sentiment has been rattled with minimal foreign<br />
direct participation. Consoling, however, is the fact that<br />
in October 2011 government released a Gazette revising<br />
the indigenisation regulations to state that foreign owned<br />
firms could now indigenise their 51% equity over 4 years;<br />
with 26% to be localised in the first year, 10% in the<br />
second year, 10% in the third year and 5% in the fourth<br />
year.<br />
Despite talks of elections, we see them as unlikely to<br />
occur in <strong>2012</strong>, as the liquidity strain continues to bite.<br />
The constitution making process is yet to be finalised,<br />
then the referendum has to follow before we can have<br />
elections. We forecast that at the earliest, we could have<br />
the elections late 2013, however, the noose is still<br />
ominously around the neck as politicians continue to issue<br />
divergence statements.<br />
SECTOR OVERVIEWS<br />
Annual mineral production for precious commodities has<br />
been on the rise as shown below.<br />
Annual Mineral Production<br />
2011 Budget<br />
2011 Revised<br />
2010 Actual Forecast Forecast <strong>2012</strong> Proj<br />
Gold/kg 9,620 13,000 13,000 15,000<br />
Nickel/t 6,133 7,680 7,700 8,800<br />
Coal/t 2,668,183 3,000,000 3,000,000 3,500,000<br />
Chrome/t 516,776 700,000 700,000 750,000<br />
Platinum/kg 8,639 12,000 10,500 12,000<br />
Paladium/kg 6,916 9,600 8,400 9,600<br />
Black Granite/t 169,318 168,000 168,000 170,811<br />
Source: IES; Ministry of Mines, Chamber of Mines<br />
For Q1 <strong>2012</strong>, gold deliveries grew by 5.8%, to register a<br />
total of 3,126kgs, the average growth rate for small-scale<br />
and primary producers stood at -3.2% and 8.3%<br />
respectively. Y-o-y growth was 21.64% for cumulative<br />
gold deliveries, 19.2% and 22.3% for small-scale producers<br />
and primary producers respectively. The growth rates<br />
have been attributed to firming gold prices, as gold prices<br />
have increased from just above US$ 1,300/oz in January<br />
2011 to the current US$ 1,650/oz. The Minister of Finance<br />
however pointed out that, despite the increase in the<br />
international metal prices, the amount of royalties<br />
collected from precious metals has remained low. For<br />
2011 it totalled US$ 44.1m against sales of US$ 1.7bn.<br />
7
IMF forecasts that commodity prices will remain largely<br />
unchanged in <strong>2012</strong>,<br />
According to the IMF, global commodity prices lost some<br />
of their luster in 2011, and although they remained high<br />
in real terms the prices declined for most of the year,<br />
with the exception of crude oil which was increasingly<br />
driven by geopolitical supply risk towards the end of the<br />
year. The commodity prices rebounded in Q1 <strong>2012</strong>,<br />
although they are still below their end of 2010 levels. A<br />
number of factors are at risk of affecting the broad<br />
upside potential, including recent downgrades of<br />
commodity assets from overweight to underweight and<br />
doubts about the continued sustainability of the decade<br />
long commodity markets boom. Uncertainty about the<br />
near-term global economic prospects is still on the charts<br />
while slowdown in the Chinese real estate market has<br />
also renewed concerns.<br />
Thus given the constrained global economic environment<br />
expected for <strong>2012</strong>-2013, commodity prices are projected<br />
to remain largely unchanged, although cyclical<br />
commodity prices may pick up if global growth is<br />
stronger than currently expected. The pickup is however<br />
expected to be moderate as the growth in <strong>2012</strong> is<br />
unlikely to be stronger while the expected reduction in<br />
potential growth in China and other emerging economies<br />
would dampen cyclical upward pressure.<br />
Source: IES; goldprice.org<br />
Progress being made on indigenisation in the mining<br />
sector<br />
According to media reports, since the indigenisation bill<br />
was gazetted in March 2011, the Youth Development,<br />
Indigenisation and Economic Empowerment ministry has<br />
received more than 200 indigenisation implementation<br />
plans from mining businesses. Australian listed Zimplats<br />
also agreed to cede 51% of its shareholding, with 10%<br />
intended for the local community, 10% for employees and<br />
31% for the NIEEF (National Indigenisation and Economic<br />
Empowerment Fund). Full details relating to the<br />
settlement are yet to be finalised. Although this affirms<br />
a high compliance rate, concern on the implications of<br />
the bill are still telling through depressed share prices of<br />
affected listed companies both on the local bourse and<br />
foreign exchanges for the dually listed companies.<br />
However we see the mining sector as poised for a<br />
massive revival...<br />
RioZim was recently recapitalised, after Gem Raintree<br />
investment underwrote a US$5.0m rights issue and a<br />
private placement of US$45.0m, despite the threat of<br />
indeginisation. Gem Raintree investments represents the<br />
interests of Gem Group a US$3.4bn alternative investment<br />
firm whose focus is on emerging markets and Raintree<br />
Mining a <strong>Zimbabwe</strong>an owned junior miner.<br />
Bindura is also set to recapitalise, as Mwana Africa<br />
Plc(52.9% shareholder) has sought to raise funding for the<br />
entity. An update from Mwana Africa shows that a total of<br />
140.6m new ordinary shares of 1 pence each in the<br />
Company have been conditionally placed by Liberum<br />
Capital Limited with investors at a price of 5.5 pence per<br />
Placing Share. Further, China International Mining Group<br />
Corporation ("CIMGC") had conditionally subscribed for<br />
242.4m new ordinary shares at the placing price. The<br />
group expected that this would assist them secure further<br />
project funding for BNC and the Group's other projects<br />
through CIMGC's banking and industry connections. Using<br />
the placing price, the gross proceeds of the Placing and<br />
the Subscription would be approximately US$33.5 million.<br />
A report compiled by SRK Consulting of UK concluded that<br />
Bindura Nickel requires US$26.0m to restart operations.<br />
Agricultural sector to be boosted by increased funding<br />
According to the MoF <strong>2012</strong> budget, the agricultural sector<br />
was expected to grow by 11.6% in <strong>2012</strong> on the back of<br />
increased funding initiatives. Maize production was<br />
expected to reach 1.8m tonnes, up from 1.4m for 2011,<br />
whilst tobacco production was forecast to reach 150.0m<br />
kgs, up from 133.0m kgs in FY 2011. Sugar production,<br />
which totalled 259,000 tonnes, was projected to go up to<br />
400,000 tonnes for FY <strong>2012</strong>. These targets are likely to be<br />
missed due to the dry spell that was experienced in some<br />
parts of the country.<br />
The Minister of Agriculture estimates that the maize<br />
harvest could fall by 26% to 1.0m tonnes after nearly half<br />
of the crop was written off because of the prolonged dry<br />
spell. The country however has 400,000 tonnes of maize in<br />
reserves, which implies that an additional 400,000 tonnes<br />
would have to be imported to make up for the deficit.<br />
Further imports of wheat will be needed given an<br />
expected wheat output of only 75,000 tonnes this year,<br />
against annual requirement of 400,000 tonnes.According<br />
to the Food and Agricultural Organisation (FAO), other<br />
agricultural crops, such as millet,groundnuts, soy beans,<br />
sunflower, sugar beans and sorghum are estimated to be<br />
below the levels of 2011, on account of reduced plantings<br />
and lower yields. Consequently, cereal production in <strong>2012</strong><br />
is put at 1.17 million tonnes, or one third less than last<br />
year’s output even after including a forecast increase in<br />
the winter wheat crop to be planted in <strong>May</strong> following the<br />
government’s decision to provide low-interest loans, to<br />
help facilitate greater investment in wheat production.<br />
8
Source: CSO<br />
<strong>Zimbabwe</strong> Cereal Production<br />
2007-2011<br />
Average<br />
<strong>2012</strong><br />
2011 Forecast<br />
change<br />
<strong>2012</strong>/11<br />
000 tonnes percent<br />
Maize 1135 1452 968 -33<br />
Sorghum 107 95 65 -32<br />
Wheat 59 41 60 46<br />
Others 100 97 80 -18<br />
Total 1401 1685 1173 -30<br />
Source: FAO/GIEWS Country Cereal Balance Sheets<br />
The organisation however notes that higher yields from<br />
tobacco and a larger planted area for cotton contributed to a<br />
marginal increase in production of about 2%.<br />
Seasonal Tobacco Sales*<br />
Total Auction Total Contract Total <strong>2012</strong> Total 2011 % Change<br />
Mass sold (kg) 34,578,964 45,008,544 79,587,508 68,603,246 16<br />
Value (US$) 127,427,605 173,245,821 300,673,426 189,808,834 58<br />
Average Price US$/kg 3.69 3.85 3.78 2.77 36.55<br />
*As at 4 <strong>May</strong> <strong>2012</strong>-Source: Tobacco Industry Marketing Board<br />
expected to reach a high of 95% in <strong>2012</strong>. In some<br />
subsectors such as clothing, textiles and printing, it<br />
has however remained low, averaging around 25%,<br />
while the textile and ginning industry capacity<br />
utilisation is expected to decline further to 19.0% from<br />
about 23.0% in 2010 mainly to due to<br />
undercapitalisation leading to a failure to carry out<br />
necessary capex projects.<br />
100%<br />
80%<br />
60%<br />
40%<br />
20%<br />
0%<br />
Manufacturing sector capacity utilisation<br />
2009A 2010Est 2011Proj<br />
Source: IES; RBZ; Ministry of Finance<br />
A total of 34.6m kg of tobacco have been sold through the<br />
auction system whilst 45.0m have been sold through the<br />
contract system. In total, the mass sold is 16% above that of<br />
last year. The average price has also increased and averages<br />
US$ 3.78/kg up from the previous season’s US$ 2.77/kg, a<br />
36.6% increase.<br />
Construction sector set to boom<br />
The local construction sector is set to grow by an average of<br />
8% per year between <strong>2012</strong> and 2016. The residential real<br />
estate sector and office sector have been experiencing the<br />
highest growth in demand on the back of an improving<br />
economy and consumer wealth.<br />
According to the ministry of finance, 80% of the country’s<br />
88,100km road network is in need of rehabilitation and<br />
44,671km of the road network has outlived its lifespan. There<br />
are also several road dualisation projects meant to expand the<br />
country’s road network. The African Development Bank<br />
estimates that the rehabilitation of the network will cost<br />
about US$ 2.7bn, while clearing the backlog of periodic<br />
maintenance will cost about US$ 560.0m (both at 2009<br />
constant prices). US$ 1.5bn is also needed by local authorities<br />
for the resuscitation and rehabilitation of the country’s water<br />
systems.<br />
Manufacturing Sector<br />
The manufacturing sector is expected to benefit from the spill<br />
over effect from growth in the mining and agricultural sectors<br />
and grow by 6% for <strong>2012</strong>, with growth driven mainly by food<br />
(6%), wood and furniture (8%), metals and metal products<br />
(11%), and non-metal products (25%). The manufacturing<br />
sector capacity utilisation has picked up in some subsets<br />
including the consumer goods sector. For example, for<br />
foodstuffs it increased from 38% in 2010 and is expected to<br />
reach 57% in <strong>2012</strong>, whilst for drinks, tobacco & beverages it is<br />
Banking sector developments<br />
A US$ 100.0m Fund funded by international financial<br />
institutions and a regional financier was created early<br />
in the year for the rejuvenation of the Central Bank;<br />
this should assist the CB to resume its role as a<br />
lender of last resort, which could also improve<br />
interbank trading.<br />
As at 30 Dec 2011, the banking deposit base was<br />
estimated to be US$ 3.8bn. Lending to the productive<br />
sectors grew to US$ 2.6bn in 2011, constituting 78.4%<br />
of total deposits. Primary beneficiaries were the<br />
agriculture sector (18.0%), manufacturing, (20.0%),<br />
distribution (19.0%) and mining (6.0%).<br />
Banking Sector Deposits, Loans and Advances<br />
4,000<br />
3,500<br />
3,000<br />
2,500<br />
2,000<br />
1,500<br />
1,000<br />
500<br />
-<br />
(500)<br />
Jun<br />
09<br />
Sep<br />
09<br />
Dec<br />
09<br />
Deposits<br />
Log. (Deposits)<br />
Mar<br />
10<br />
Jun<br />
10<br />
Dec<br />
10<br />
Apr<br />
11<br />
Source: IES; RBZ; Ministry of Finance<br />
Jun<br />
11<br />
Aug<br />
11<br />
2<br />
Sep<br />
11<br />
9<br />
Sep<br />
11<br />
16<br />
Sep<br />
11<br />
23<br />
Sep<br />
11<br />
Total loans and advances<br />
Log. (Total loans and advances)<br />
30<br />
Sep<br />
11<br />
Banks’ asset quality is a major concern<br />
Banking institutions in <strong>Zimbabwe</strong> have seen strong<br />
deposit and credit growth ahead of GDP growth over<br />
the last three years albeit off a very low base.<br />
Nonetheless, overall undercapitalisation of most banks<br />
9
emains a challenge especially when non-performing loans<br />
are taken into account. In our view, most of the lending<br />
decisions have been based on the size of the collateral<br />
being offered and relationships rather than cashflow.<br />
Good information is also scarce in the absence of a<br />
national credit bureau. Furthermore the value of the<br />
collateral, which is real estate in most cases, tend to be<br />
overstated. This has allowed the official NPLs numbers to<br />
be low. However the IMF estimated that NPLs were about<br />
3.1% of outstanding loans. Banks are sitting on a<br />
significant unknown quality of NPLs and these continue to<br />
grow.<br />
Interest rate outlook<br />
The loan to deposit ratio remains high at 79.1%. The high<br />
lending rates have led to high slippages coupled with<br />
weak fundamentals of some local companies (high<br />
leverage and low profitability and low risk management)<br />
giving concern that credit quality can deteriorate.<br />
According to the Reserve Bank, lending rates have been<br />
ranging around 30% per annum against a low of between<br />
2.5% and 5.0% paid on savings deposits. We do not expect<br />
any changes in the short term due to the liquidity strain.<br />
Telecomms sector bearing witness to the improving<br />
economic situation<br />
From the latest Econet results (FY <strong>2012</strong>), we note that the<br />
group continues to record significant growth in subscriber<br />
numbers from 1.2m when <strong>Zimbabwe</strong> dollarised to the<br />
current 6.4m (2011: 5.5m), on the back of stable<br />
disposable incomes. ARPUs have been defended at over<br />
US$ 9.00, (FY 2011: US$ 10.33) bearing testimony that the<br />
economy is recovering. New customer acquisition rates<br />
have also been good, with 1.2m new customers acquired<br />
in March <strong>2012</strong> up from 1.0m acquired in February. The<br />
company also contributes significantly to the fiscus, with<br />
US$ 73.4m paid as income tax for FY <strong>2012</strong> while US$<br />
414.0m has been paid in cumulative tax, levies and<br />
licence fees since dollarisation.<br />
Tourism sector<br />
The tourism sector is expected to grow by 13.7% in <strong>2012</strong><br />
with average room occupancy rates rising from 56% to<br />
60%. However we expect RevPARs to remain largely<br />
unchanged as the ADR’s may have to be compromised in<br />
order to be competitive given the limited demand in a<br />
cash stripped economy, and high competition from<br />
regional destinations.<br />
Room and Bed Occupancy<br />
Indicator 2009 2010 2011 Est <strong>2012</strong> Proj<br />
Average bed occupancy rate (%) 35 36 37 37<br />
Average room occupancy rate<br />
(%) 46 52 56 60<br />
Overall sector growth (Tourism,<br />
Hotels and Restaurants (%) 6.5 0.5 10.3 13.7<br />
Source: <strong>Zimbabwe</strong> Tourism Authority & MoF<br />
THE ZIMBABWE STOCK EXCHANGE OVERVIEW<br />
History<br />
The first stock exchange in <strong>Zimbabwe</strong> was opened in<br />
Bulawayo in 1896, to raise money for gold mining<br />
activities in the country and was closed after the South<br />
African Anglo-Boer war of 1899-1902. Another exchange<br />
was also opened in Umtali (Mutare) in 1896 and it was<br />
closed in 1924 after it was realised that the local mining<br />
deposits in the area were not extensive. Between 1900<br />
and 1930 an exchange also operated in the town of Gwelo<br />
(now Gweru). In 1946 a new exchange was opened in<br />
Bulawayo and a second one was opened in Salisbury<br />
(Harare) in 1951. The <strong>Zimbabwe</strong> <strong>Stock</strong> <strong>Exchange</strong> Act of<br />
1974 consolidated the two <strong>Exchange</strong>s under a legal and<br />
operational framework, based in Harare. The Act<br />
governed the rights and obligations of members of the<br />
stock exchange and the general investing public.<br />
At eighth place, ranked by market capitalisation,<br />
<strong>Zimbabwe</strong> is not one of the largest markets in sub-<br />
Saharan Africa. However, with 81 listed companies, the<br />
ZSE has more depth and diversity than some of the<br />
region’s markets. The stocks on the exchange include<br />
financial, insurance, retail, construction, transport,<br />
pharmaceuticals, property, telecommunications,<br />
manufacturing and agricultural-related stocks.<br />
There are currently two indices on the <strong>Stock</strong> <strong>Exchange</strong>;<br />
the Mining Index with four companies and the Industrial<br />
Index comprising of 77 companies. The indices are<br />
calculated using a 2009 base date and are weighted by<br />
market capitalisation. The Industrial Index is dominated<br />
by price movements in a few big cap stocks such as Delta<br />
which represents 20% of the index, Econet (19%), Innscor<br />
(8%), SeedCo (6%) and Hippo (5%).<br />
Trading on the ZSE<br />
Presently trading is by call over, using an open-cry floor<br />
system on a matched bargain basis. This trading system is<br />
paper based and settlement is on a T+7 basis against<br />
physical delivery of scrip (seven day settlement for both<br />
shares and payment).<br />
Custodial options:<br />
• Barclays Nominees<br />
• Stanbic Nominees<br />
• Standard Chartered Bank <strong>Zimbabwe</strong> Limited<br />
• Three Anchor Investments T/A Old Mutual<br />
custodial Services<br />
• ZB Bank Limited<br />
Share dealing is done through stockbrokers once a day,<br />
from Monday to Friday. The call over session commences<br />
at 10.00 hours. The financial instruments traded on the<br />
ZSE are common stock, preference shares, corporate<br />
debentures, warrants, government stocks and fixedinterest<br />
securities. However, the bulk of trades and<br />
listings on the exchange are for common stock.<br />
10
Dealing costs<br />
The set legislated transaction costs amount to 4.21% for a<br />
buy and sell.<br />
ZSE Transcation costs<br />
Buying % Selling %<br />
Brokerage fees 1.00 1.00<br />
Stamp duty (buying) 0.25<br />
Capital Gains Tax (selling) 1.00<br />
Securities Commission Levy 0.18 0.18<br />
Investor Protection Levy 0.05 0.05<br />
VAT at 15% on Brokerage 0.15 0.15<br />
Total costs 1.73 2.48<br />
Total costs for both buying and selling 4.21%<br />
Basic Charge US$2 US$2<br />
Source: ZSE<br />
Foreign Participation and Regulation<br />
Foreign participation in stock market trading was<br />
introduced in mid-1993, following the partial lifting of<br />
exchange control regulations. Foreign investors may hold<br />
up to 10% of any listed company without recourse to<br />
<strong>Exchange</strong> Control. Collectively foreign ownership in a<br />
listed company may not exceed 40% of the issued capital<br />
of that company. These rulings exclude holdings which<br />
were acquired before June 1993.<br />
Any violation of the above limits would not see<br />
registration. It would be reported by the transfer<br />
secretary to both the ZSE and RBZ resulting in a directive<br />
from the RBZ to the investor to sell any excess holding.<br />
Fungibility is permitted for some dually listed companies,<br />
such as Old Mutual and PPC.<br />
Patience is a virtue when trading emerging markets<br />
In the last 12 months the ZSE turned over US$ 0.4bn in<br />
value or 10% of total market capitalisation. Given the size<br />
of the market, patience is generally required to build a<br />
position, equally so when fund managers want to sell.<br />
The market is characterised by high levels of local<br />
institutional investors who are relatively inactive,<br />
compounding the liquidity problem.<br />
Key ZSE Statistics<br />
1995 1996 1997 2008* 2009 2010 2011<br />
Market Cap US$b 2.1 3.9 5.7 4.2 3.9 4.2 4.0<br />
Average daily turnover US$ '000 549 942 1,264 1,225 1,859 1,555 1,905.9<br />
Annual turnover US$m 150 245 329 311 437 392 477.4<br />
Number of listed companies 64 64 65 81 81 81 81.0<br />
Market cap as % of GDP 21 58 66 86 75 67 44.9<br />
*based on OMIR<br />
Source: IES, ZSE<br />
For 2011, total value traded amounted to US$ 477.4m<br />
on 4.7bn shares; up from 2010’s US$ 392.0m on 6.2m<br />
shares (implying higher value shares were mainly traded<br />
in 2011). Net foreign activity amounted to US$ 77.2m<br />
(16% of market activity) on 1.4bn shares with net buying<br />
at US$ 190.7m whilst net selling totalled US$ 152.1m.<br />
The market cap was at US$ 3.8bn up from US$ 3.7bn.<br />
Year to date, value traded amounts to US$ 159.0m on<br />
1.4bn shares. The net foreign activity at US$ 38.0m<br />
constitutes 24% of total value traded, on 513.8m shares.<br />
Monthly value traded US$m<br />
Feb 09 - Apr 12<br />
Feb-09 Jul-09 Dec-09 <strong>May</strong>-10 Oct-10 Mar-11 Aug-11 Jan-12<br />
Source: IES, ZSE<br />
Monthly net foreign dealing US$m<br />
Aug 10 - Apr12<br />
(1)<br />
Aug-10 Dec-10 Apr-11 Aug-11 Dec-11<br />
Source: IES, ZSE<br />
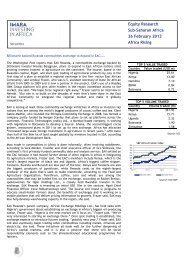
For 2011 both the industrial and mining indices were<br />
down with the industrial index losing 3.58% whilst the<br />
mining index lost 49.75%. Although the performance was<br />
in line with regional exchanges and some international<br />
indices due to the tight liquidity caused by the Euro<br />
zone crisis, the mining index was further weakened by<br />
the local policy issues. Year to date, the indices have<br />
weakened further with the industrial index down 10.62%<br />
whilst the mining index is down 9.51%, this is in contrast<br />
to the positive performance on the regional and<br />
international bourses, where the regional exchanges are<br />
up on average by 7% whilst the main international<br />
indices have gained an average of 5%.<br />
60<br />
40<br />
20<br />
-<br />
9<br />
Millions of US$<br />
29<br />
19<br />
Millions of US$<br />
11
The poor performance on the local front could be attributed<br />
to inconsistency on policy pronouncements mainly relating to<br />
indigenisation and elections. For <strong>2012</strong>, we expect some<br />
improvement driven by improving company performance.<br />
The market capitalisation to GDP ratio declined in 2011 to<br />
36% from 45% in 2010.<br />
ZSE Industrial and Mining Indices<br />
350<br />
300<br />
250<br />
200<br />
150<br />
100<br />
50<br />
0<br />
2/19/2009 2/19/2010 2/19/2011 2/19/<strong>2012</strong><br />
Source: IES<br />
Industrial<br />
Mining<br />
Local institutions remain overweight in equities<br />
Presently, local institutions are overweight in equities, a<br />
result of the hyperinflation era. We believe this will change<br />
with the re-introduction of prescribed asset ratios. Local<br />
fund managers have to redesign their portfolios, building up<br />
their cash positions and diversifying away from an over<br />
exposure to equities and fixed assets. We expect this to<br />
improve liquidity as local fund managers sell off their<br />
holdings.<br />
Recapitalisation remains key<br />
Despite top line growth ahead of inflation, heavy interest<br />
costs continue to negate positive performance in many listed<br />
companies. A classic case is that of PG Industries whose<br />
gearing stands at a high of 136%. Several other companies<br />
remain hugely undercapitalised hampering earnings growth<br />
and curtailing share price performance. Rio Zim recently<br />
concluded a rights offer which should see its huge debt being<br />
paid, thus lowering finance costs and possibly returning the<br />
group to viability.<br />
Several other companies are also carrying out corporate<br />
activities, and although the prospects of deleveraging are<br />
attractive, other factors such as the unclear indigenisation<br />
policy and likelihood of elections continue to draw back<br />
significant progress. The economic recovery should continue<br />
and is likely to accelerate if further reforms are enacted by<br />
the authorities. It is our view that <strong>Zimbabwe</strong> offers great<br />
potential as a recovery play and we urge investors to take<br />
positions in rapidly growing, dominant, well managed and<br />
strong cash generating companies such as BATZ, Dairibord,<br />
Delta, Econet, Innscor, OK <strong>Zimbabwe</strong>, Padenga and<br />
SeedCo.<br />
ZSE 2011 Volume Traded<br />
400.0<br />
350.0<br />
300.0<br />
250.0<br />
200.0<br />
150.0<br />
100.0<br />
50.0<br />
0.0<br />
Source:IES<br />
ZSE 2011 Value Traded US$<br />
14.00<br />
12.00<br />
10.00<br />
8.00<br />
6.00<br />
4.00<br />
2.00<br />
0.00<br />
Source:IES<br />
ZSE US$ Market Cap<br />
5.00<br />
4.75<br />
4.50<br />
4.25<br />
4.00<br />
3.75<br />
3.50<br />
3.25<br />
3.00<br />
Source:IES<br />
12
ZSE Listed Companies<br />
Companies Analyst Year Shares Price Mkt cap Eps (USc) P/E (x) PBV (x) EV/EBITDA (x) OPM* (%) Recommendation<br />
end in issue (USc) (US$m) hist +1 +2 hist +1 +2 hist +1 +2 hist +1 +2 hist +1 +2 ST LT<br />
Agricultural na 3,368.3 470.9 20.5 8.5 6.5 0.6<br />
Ariston NSZ Sept 1,378.4 1.1 15.2 (0.5) 0.1 0.4 na 9.5 3.5 0.6 0.6 0.5 (5.3) 7.2 2.4 (13.0) 4.9 10.6 Sell Sell<br />
Border Timbers NSZ June 42.9 10.0 4.3 11.7 8.9 9.0 0.9 1.2 1.2 0.0 0.0 0.0 (3.7) 20.1 5.3 (14.5) 2.4 7.4 Hold Hold<br />
AICO NSZ Mar 531.7 12.0 63.8 1.7 1.8 2.0 11.6 11.0 9.9 1.3 1.2 1.1 5.4 4.9 4.1 15.8 12.2 13.5 Buy Buy<br />
Hippo Valley Estates NSZ Mar 193.0 100.0 193.0 4.6 9.7 15.2 18.7 8.8 5.6 0.9 0.8 0.7 16.6 8.8 5.7 12.0 14.0 18.0 Buy Buy<br />
Interfresh NSZ Dec 487.6 0.2 0.7 (0.3) (0.5) (0.8) na na na 0.1 0.1 0.1 (3.8) (3.1) (2.6) (19.0) (24.9) (22.4) Sell Sell<br />
Padenga Holdings NSZ June 541.6 5.5 29.8 0.7 1.3 1.5 8.2 4.2 3.7 1.0 0.9 0.7 5.2 2.8 2.4 26.2 47.1 48.6 Buy Buy<br />
Seed Company NSZ Mar 193.0 85.0 164.1 9.0 9.5 11.8 12.4 11.7 9.5 3.1 2.6 2.2 9.7 7.8 6.3 22.3 21.5 22.3 Buy Buy<br />
Building and Allied na 3,114.3 146.2 0.1 0.0 0.0<br />
Lafarge NSZ Dec 80.0 55.0 44.0 3.4 4.5 5.1 20.9 15.6 13.8 2.8 2.3 2.0 13.9 9.5 8.9 9.7 13.0 12.0 Buy Buy<br />
M & R NSZ Jun 214.3 6.0 12.9 0.5 1.4 1.6 24.7 9.5 8.2 1.6 1.4 1.2 10.3 5.1 4.5 4.2 5.7 6.2 Buy Buy<br />
PGI NSZ Mar 478.3 2.0 9.6 (1.4) (0.6) (0.0) na na na 0.7 0.7 0.9 (2.1) (2.6) (27.6) (29.1) (17.5) (1.1) Sell Sell<br />
Turnall NSZ Dec 493.0 7.0 34.5 0.7 0.9 1.0 13.0 10.4 8.7 1.7 1.6 1.4 7.4 6.2 5.3 14.3 13.8 13.9 Buy Buy<br />
PPC NSZ Sept 15.2 260.0 39.6 7.1 7.8 9.0 29.6 26.8 23.3 24.3 24.3 25.1 13.5 13.5 13.5 34.0 37.6 39.8 Hold Buy<br />
Radar NSZ Jun 55.4 7.0 3.9 (0.5) 0.5 0.8 na 66.4 39.6 0.3 0.3 0.3 6.2 8.0 14.9 12.4 8.0 3.6 Hold Hold<br />
Willdale NSZ Sept 1,778.0 0.1 1.8 (0.1) (0.0) (0.0) na na na 0.3 0.4 0.4 (3.7) (6.8) 17.8 (101.5) (41.2) (7.0) Sell Sell<br />
Beverages, Hotels and Leisure na 4,305.9 1,167.3 14.2 9.8 7.4<br />
Afdis ATC Jun 95.2 10.0 9.5 (1.0) 1.9 2.9 na 6.7 4.5 3.2 2.2 1.5 (37.9) 5.8 3.2 (3.8) 9.5 12.7 Buy Buy<br />
Delta ATC Mar 1,192.1 70.0 834.5 6.2 7.9 10.0 11.3 8.9 7.0 3.2 2.4 2.0 7.2 5.7 4.5 17.7 18.4 19.2 Buy Buy<br />
Innscor ATC Jun 541.6 53.0 287.0 4.8 7.1 9.6 11.0 7.4 5.5 2.5 2.8 2.2 9.8 6.5 4.0 5.6 7.5 10.3 Buy Buy<br />
RTG ATC Dec 1,645.5 1.8 29.6 (0.1) (0.1) (0.1) na na na 1.7 1.8 2.0 (37.0) (144.3) (290.4) (7.1) (1.5) (0.7) Sell Sell<br />
Afrisun ATC Sept 831.5 0.8 6.7 (0.6) (0.3) (0.3) na na na 0.4 0.3 0.3 (2.6) 29.3 43.0 (16.8) (3.7) (3.7) Sell Hold<br />
Engineering na 2,270.6 33.5 -5.2 -4.6 -4.0<br />
CAFCA NSZ Dec 8.2 50.0 4.1 15.7 17.9 24.0 4.4 3.9 2.9 0.8 0.7 0.5 2.9 2.3 1.5 10.8 10.9 12.7 Hold Buy<br />
Gulliver NSZ Sept 554.9 0.0 0.2 (0.5) (0.8) (1.1) na na na 0.0 0.0 0.0 (0.9) (1.0) (0.8) (90.4) (88.3) (85.7) Sell Sell<br />
Powerspeed NSZ Sept 379.2 1.4 5.3 0.1 0.1 0.1 0.2 0.1 0.1 0.0 0.0 0.0 3.0 3.0 2.9 3.0 3.0 3.0 Spec Buy Spec Buy<br />
Steelnet NSZ Dec 538.0 0.0 0.0 - - - 0.0 0.0 0.0 0.0 0.0 0.0 0.0 0.0 0.0 0.0 0.0 0.0 Susp Susp<br />
ZECO NSZ Jan 463.3 0.2 0.9 (0.4) (0.5) (0.5) na na na 0.0 0.0 0.0 (0.2) (0.2) (0.1) (130.1) (138.4) (110.6) Avoid Sell<br />
Zimplow NSZ Dec 327.1 7.0 22.9 0.8 1.0 1.1 9.0 7.8 6.9 1.7 1.5 1.3 5.9 5.4 4.7 22.3 19.9 20.3 Buy Buy<br />
Financial na 6,975 240.8 3.5 2.4 1.6<br />
ABC ATC Dec 64.4 54.0 34.8 18.9 30.9 36.9 2.9 1.7 1.5 0.4 0.4 0.3 84.7 82.8 81.5 Accumulate Hold<br />
Barbican ATC Dec 119.0 0.0 0.0 - - - 0.0 0.0 0.0 0.0 0.0 0.0 na na na Susp Susp<br />
Barclays Bank ATC Dec 2,152.6 3.7 79.6 0.1 0.2 0.4 56.7 16.0 8.7 2.4 2.1 1.7 93.5 81.8 73.3 Hold Accumulate<br />
CBZ ATC Dec 684.1 7.0 47.9 4.4 5.4 7.1 1.6 1.3 1.0 0.4 0.3 0.3 56.5 49.8 44.9 Spec Buy Spec Buy<br />
Interfin ATC Dec 20.6 1.7 0.4 0.0 (0.2) (0.2) na na na 3.7 6.3 33.4 Sell Avoid<br />
ZBF Holdings ATC Dec 175.2 11.5 20.1 3.3 4.7 9.2 3.5 2.4 1.2 0.5 0.4 0.3 91.3 78.0 67.3 Spec Hold<br />
FBC Holdings ATC Dec 591.9 6.0 35.5 1.6 2.3 2.9 3.7 2.6 2.1 0.6 0.5 0.5 65.9 60.8 60.3 Spec Hold<br />
NMB Bank ATC Dec 2,807.1 0.7 19.6 0.2 0.3 0.4 4.3 2.8 1.9 0.8 0.6 0.5 67.0 66.3 65.8 Spec Buy Buy<br />
Trust Holdings ATC Dec 359.7 0.8 2.9 (0.3) (1.3) (1.2) na na na 0.0 0.0 0.0 Sell Sell<br />
Insurance 1,394.5 122.6 -0.2 -0.3 -0.6<br />
Fidelity NSZ Dec 108.9 16.0 17.4 1.8 3.2 4.6 8.8 5.0 3.5 0.7 0.7 0.9 Hold Hold<br />
AFRE NSZ Dec 217.1 6.0 13.0 (2.3) (0.3) 0.4 na na 16.8 0.2 0.2 0.2 Sell Sell<br />
Nicoz Diamond NSZ Dec 559.5 3.0 16.8 0.3 0.3 0.5 10.3 8.6 5.9 1.4 1.2 1.0 Hold Hold<br />
Old Mutual NSZ Dec 67.6 144.0 97.3 (9.4) (8.0) (4.0) na na na 0.5 0.6 0.6 Buy Buy<br />
Zimre NSZ Dec 767.4 1.1 8.4 0.3 0.4 0.5 0.0 0.0 0.0 0.0 0.0 0.0 Spec Accumulate<br />
OPM* - for finanial companies its cost to income ratio<br />
13
ZSE Listed companies cont’d<br />
Companies Analyst Year Shares Price Mkt cap Eps (USc) P/E (x) PBV (x) EV/EBITDA (x) OPM (%)<br />
Recommendation<br />
end in issue (USc) (US$m) hist +1 +2 hist +1 +2 hist +1 +2 hist +1 +2 hist +1 +2 ST LT<br />
Food na 1,269.6 168.4 -28.4 47.3 13.3<br />
Cairns NSZ Aug 167.7 0.3 0.5 (4.9) (3.6) (3.8) na na na 0.7 0.2 0.1 (3.9) (3.9) (2.0) (19.9) (29.6) (30.1) Sell Sell<br />
Colcom NSZ Jun 159.0 28.0 44.5 3.1 3.0 3.7 10.6 10.9 8.9 2.3 2.1 1.8 7.6 7.4 6.1 12.2 10.8 11.9 Buy Buy<br />
Dairibord NSZ Dec 356.0 16.5 58.7 2.0 2.7 3.6 9.4 7.0 5.1 1.6 1.4 1.3 5.2 4.2 3.1 11.3 11.7 13.3 Buy Buy<br />
National Foods NSZ Jun 68.4 90.0 61.6 7.3 7.3 11.1 16.1 16.1 10.6 1.9 1.4 1.1 8.9 6.5 5.1 3.5 4.2 4.8 Buy Buy<br />
Starafrica NSZ Mar 518.5 0.6 3.1 (2.9) (2.4) (1.8) na na na 0.5 1.1 0.6 (5.0) (2.7) (2.6) (16.0) (23.0) (19.3) Sell Sell<br />
Industrial Holding na 2,868.8 116.0 28.2 17.8 7.1<br />
Apex ATC Oct 503.7 0.1 0.3 (0.2) 0.0 0.0 na 6.7 5.5 0.0 0.0 0.0 (1.1) 0.7 0.6 (14.6) 1.4 1.2 Sell Sell<br />
Astra ATC Aug 139.6 3.3 4.5 0.3 0.9 1.2 5.1 1.7 1.3 0.1 0.1 0.1 1.5 1.1 1.0 5.2 6.3 6.7 Spec Spec<br />
CFI ATC Sep 105.5 5.5 5.8 (0.7) (2.7) (0.4) na na na 0.1 0.1 0.1 (8.5) (9.4) (40.8) (2.9) (2.3) (0.4) Hold Hold<br />
General Beltings ATC Dec 530.2 0.2 1.0 (0.4) (0.3) (0.2) na na na 0.0 0.0 0.0 0.0 (2.7) (2.9) (33.0) (16.0) (9.0) Sell Sell<br />
Meikles ATC Mar 240.8 14.0 33.7 2.4 (0.5) 0.6 6.6 na 29.2 0.3 0.3 0.3 (134.2) 6.7 5.1 (1.8) 1.8 2.1 Spec Spec<br />
Phoenix ATC Oct 87.5 1.0 0.9 0.1 0.1 0.1 33.6 33.3 25.9 0.4 0.4 0.4 5.2 3.8 3.1 1.0 1.4 1.4 Reduce Hold<br />
T A ATC Dec 164.8 12.0 19.8 (3.8) (2.9) (2.1) na na na 0.4 0.4 0.4 15.8 8.8 5.5 0.6 0.6 0.6 Spec Buy Sell<br />
TN Holdings ATC Dec 750.8 3.9 29.3 (0.1) 0.1 0.2 na 30.1 26.3 7.1 5.7 4.7 0.0 0.0 0.0 0.0 0.0 0.0 Sell Sell<br />
T S L ATC Oct 345.9 6.0 20.8 0.3 0.5 0.6 28.7 17.7 15.6 1.5 1.4 1.4 19.9 14.7 13.1 6.1 6.9 7.1 Spec Spec<br />
Mining na 443.4 79.9 -4.8 -4.2 -3.0<br />
Bindura Nickel ATC Dec 126.0 3.5 4.4 (13.1) (15.1) (16.3) na na na (1.8) (0.9) (0.2) (0.3) (0.2) (0.2) (372.6) (626.0) (610.4) Sell Hold<br />
Falgold ATC Sept 111.2 10.0 11.1 1.1 13.7 82.2 6.9 5.2 3.7 0.0 0.0 0.0 0.0 0.0 0.0 4.9 10.6 12.4 Hold Hold<br />
Hwange ATC Dec 166.2 26.0 43.2 3.7 5.0 7.0 na na 14.3 0.0 0.0 0.0 0.0 0.0 0.0 (6.9) (63.0) 6.9 Buy Buy<br />
RioZim ATC Dec 40.0 53.0 21.2 (5.6) (31.4) 3.7 na na na 0.0 0.0 0.0 0.0 0.0 0.0 0.0 0.0 0.0 Hold Hold<br />
Paper and Packaging na 1,363.0 31.1 -13.8 12.2 7.3<br />
Amalgamated Regional Trading ATC Sep 467.3 0.3 1.4 (0.6) (0.0) 0.2 na na 1.8 0.1 0.1 0.1 5.4 4.2 2.3 0.5 2.0 3.7 Sell Sell<br />
Hunyani Holdings ATC Oct 319.7 7.5 24.0 0.0 0.6 0.8 172.3 10.7 7.9 1.0 0.8 0.7 (54.9) 14.5 8.2 (4.6) 0.1 1.6 Hold Buy<br />
<strong>Zimbabwe</strong> Newspapers ATC Dec 576.0 1.0 5.8 0.1 0.1 0.2 7.7 4.9 3.8 0.4 0.4 0.3 6.0 (3.4) (1.9) (0.8) 1.0 1.3 Spec Spec<br />
Pharmaceuticals and Chemicals na 2,814.9 2.9 -2.1 -2.3 54.2<br />
Chemco ATC Oct 15 0.5 0.1 (5.7) (7.3) 1.3 na na 3.9 0.2 0.2 0.2 0.6 (0.2) (1.0) (5.1) (13.6) 3.3 Sell Sell<br />
Medtech ATC Dec 2,800 0.1 2.8 (0.1) (0.0) (0.0) na na na 16.3 51.7 (49.5) 123.9 80.7 61.0 (1.5) (1.0) (0.9) Sell Sell<br />
Retail stores na 5,417.8 148.0 26.3 10.0 5.2<br />
Celsys NS June 1,599.6 0.1 1.3 (0.1) (0.1) (0.1) na na na (0.4) (0.2) (0.1) (2.3) (4.0) (5.1) (64.2) (26.3) (17.9) Sell Sell<br />
Edgars Stores NS Jan 282.7 7.3 20.5 0.8 1.3 1.9 11.7 6.9 4.7 6.1 3.2 1.9 9.7 5.4 4.0 11.9 15.1 15.7 Add Buy<br />
OK <strong>Zimbabwe</strong> NS Mar 1,020.9 10.0 102.1 0.4 0.8 1.3 25.7 12.3 7.6 2.6 2.2 1.7 11.7 6.5 3.6 2.1 3.4 4.8 Buy Buy<br />
Pelhams NS Mar 995.6 0.6 5.5 0.0 0.0 0.3 69.5 30.0 2.5 3.0 2.6 1.2 13.9 11.5 2.5 8.5 9.4 35.0 Sell Sell<br />
Redstar NS Mar 1,145.3 0.0 0.0 - - - 0.0 0.0 0.0 0.0 0.0 0.0 0.0 0.0 0.0 0.0 0.0 0.0 Susp Susp<br />
Truworths NS Jun 373.6 5.0 18.7 0.5 1.0 1.3 19.7 9.8 7.1 9.7 5.7 3.7 14.9 11.2 7.7 10.1 12.2 13.4 Hold Buy<br />
Tobacco na 17.4 37.4 7.7 4.3 4.1<br />
BAT <strong>Zimbabwe</strong> ATC Dec 17.4 215.0 37.4 28.1 41.8 43.4 6.4 4.3 4.1 3.7 3.5 3.3 4.9 3.6 3.5 16.0 16.0 13.3 Buy Buy<br />
Technology na 171.6 694.8 4.2 3.5 3.1<br />
Econet ATC June 171.6 405.0 694.8 97.8 115.8 132.9 4.1 3.5 3.0 1.8 1.3 1.0 2.8 2.6 2.1 40.0 40.2 40.1 Buy Buy<br />
Transport na 463.5 23.5 -535.9 8.3 5.7<br />
Pioneer ATC Dec 55.0 2.5 1.4 (2.8) 0.8 1.0 na 8.7 6.9 0.9 0.8 0.7 (21.5) (19.6) (18.1) (1.6) (1.6) (1.6) Sell Sell<br />
NTS ATC Dec 253.8 2.0 5.1 0.1 0.3 0.5 23.6 11.8 6.9 2.2 1.9 1.5 (54.3) 12.3 6.3 (2.7) 6.6 10.7 Hold Buy<br />
TPH ATC Aug 154.7 11.0 17.0 0.8 1.2 1.6 11.2 7.6 5.5 1.0 0.9 0.8 0.0 0.0 0.0 3.9 4.7 5.4 Hold Buy<br />
Property na 7,271.1 105.8 2 3 4<br />
Dawn Properties NS Mar 2,457.2 0.7 16.0 0.5 0.0 0.0 1.3 23.0 13.9 0.2 0.2 0.2 713.1 15.4 10.1 0.4 15.9 19.9 Hold Hold<br />
Mashonaland Holdings NS Sep 1,859.1 2.0 37.2 1.3 0.3 0.3 1.5 7.5 6.0 0.4 0.4 0.4 0.6 0.9 1.3 61.0 63.9 66.9 Buy Buy<br />
Pearl Properties NS Dec 1,238.2 2.8 34.7 1.3 1.5 0.5 2.1 1.8 5.4 0.4 0.3 0.3 6.2 6.5 7.2 56.5 53.0 50.2 Buy Buy<br />
Zimre Properties Investments NS Dec 1,716.7 1.1 18.0 0.3 0.4 0.5 2.9 2.8 2.2 0.4 0.3 0.3 (0.2) 0.2 0.4 39.1 48.8 57.0 Buy Buy<br />
14
EQUITY RESEARCH<br />
ZIMBABWE<br />
AGRICULTURE/FMCG<br />
Beneath complexity lies hidden value<br />
The AICO share price has remained weak as the deadlock of<br />
arrangements for a possible capital injection slackened<br />
interest in the counter. Consequently, concerns over the<br />
group’s high borrowings and net finance costs have<br />
resurfaced. The company is likely to benefit from the firm<br />
commodity prices, although the cancerous finance costs<br />
will continue to garner a large portion of the gain. The<br />
group however still has its invaluable business portfolio and<br />
through the cash-cow SeedCo, upcoming Cottco and debt<br />
restructuring we expect an improved performance as the<br />
debt issue is addressed.<br />
• Increasing sales volumes<br />
Group sales volumes for H1 <strong>2012</strong> increased 19% y-o-y as<br />
seed business sales volumes grew 63%, cotton business<br />
sales volumes increased 15% and FMCG volumes<br />
declined 19%. The FMCG business was negatively<br />
impacted by working capital constraints and capacity<br />
utilisation remained low averaging between 25% and<br />
30%.<br />
• Steady market share despite decline in national<br />
output<br />
The national cotton crop declined by 10% to 242,000<br />
tonnes and AICO’s intake declined by 7% to 103,224<br />
tonnes although market share improved to 43% from<br />
41%.<br />
• Attractive valuation<br />
Using a S.O.P valuation approach, we derived a value<br />
of US 36c, implying 140% upside potential to the<br />
current price of US 15c. AICO remains undervalued on<br />
a sum of parts (S.O.P). BUY.<br />
BLOOMBERG: AICO:ZH<br />
BUY<br />
Current price (USc) 15.0<br />
Target price (USc) 36.0<br />
Upside/Downside (%) 140.0<br />
Liquidity<br />
Market Cap (US$m) 79.7<br />
Shares (m) 531.7<br />
Free float (%) 37.7<br />
Ave. daily vol ('000) 309.2<br />
Share price performance<br />
6 Months (%) (31.8)<br />
Relative change (%)* (19.7)<br />
12 Months (%) (16.7)<br />
Relative change (%)* (2.0)<br />
*Relative to ZSE Industrial Index<br />
Financials (US$m) - FY 31 Mar 2011 <strong>2012</strong>F 2013F<br />
Turnover 210.6 278.0 296.1<br />
EBITDA 41.1 41.9 42.7<br />
Net finance income (17.2) (15.3) (14.2)<br />
Attributable earnings 8.9 9.4 10.4<br />
EPS (USc) 1.7 1.8 2.0<br />
DPS (USc) 0.0 0.0 0.0<br />
NAV/share (USc) 15.2 16.3 17.1<br />
Valuation Ratios<br />
PBV (x) 1.0 0.9 0.9<br />
PER (x) 8.9 8.5 7.7<br />
EV/EBITDA (x) 3.1 3.0 3.0<br />
EBITDA margin (%) 12.3 19.4 15.3<br />
Dividend Yield (%) na na na<br />
Earnings Yield (%) 11.2 11.8 13.1<br />
Gearing (%) 39.4 85.4 71.2<br />
RoaA (%) (2.0) 0.5 1.8<br />
RoaE (%) (5.2) 1.2 3.8<br />
AICO Africa: Price vs Volume<br />
35<br />
30<br />
25<br />
20<br />
15<br />
10<br />
5<br />
0<br />
Feb-09 Oct-09 Jun-10 Feb-11 Oct-11<br />
45.0<br />
40.0<br />
35.0<br />
30.0<br />
25.0<br />
20.0<br />
15.0<br />
10.0<br />
5.0<br />
-<br />
STRENGTHS<br />
WEAKNESSES<br />
Diversified business<br />
Input scheme recoveries<br />
Dominant market share<br />
Strategic Partneships<br />
Strong management team<br />
OPPORTUNITIES<br />
THREATS<br />
Continued regional expansion Competition from new entrants<br />
New products for FMCG business i.e. the Chinese<br />
Improving disposable incomes Volatile international lint prices<br />
SI 142 ensures favorable recoveries Drought<br />
Middle Price USc LHS<br />
Total Volume (m) RHS<br />
Source: IES<br />
15
Nature of business<br />
AICO Africa Limited is an integrated agro-industrial conglomerate. The<br />
group wholly owns Cottco, which with nine ginneries, constitutes the<br />
ginning operations of the group. AICO also holds a 51% stake in SeedCo<br />
Limited, which in turn holds a 100% interest in Quton Seed Company, a<br />
cotton planting seed production house. The group also has a 49% stake<br />
in Olivine Holdings and a 75% interest in Scottco.<br />
<strong>Overview</strong> of H1 <strong>2012</strong> results<br />
AICO posted improved financials driven by a strong performance from<br />
the Cotton business which benefited from the firm lint prices. The<br />
Cotton business contributed 65% to group revenue from 45%, seed<br />
business 25% from 36% and FMCG 8% from 13%. The medium term<br />
target for revenue contribution is 33% from each division.<br />
AICO Shareholding - 30/12/11<br />
Shareholder<br />
# of Shares (m) % of Total<br />
1 NSSA 101.9 19.1%<br />
2 Old Mutual Life Assurance Co. Zim Ltd 72.2 13.5%<br />
3 Burket Associates Limited NNR 40.3 7.5%<br />
4 Barclays <strong>Zimbabwe</strong> Nominees (Pvt) Ltd 35.9 6.7%<br />
5 Caperal Limited NNR 27.1 5.1%<br />
6 Barclays <strong>Zimbabwe</strong> Nominees (Pvt) Ltd 26.5 5.0%<br />
7 NSSA (W.C.I.F) 16.1 3.0%<br />
8 Stanbic Nominees (Pvt) Ltd 12.8 2.4%<br />
9 Old Mutual <strong>Zimbabwe</strong> Limited 10.2 1.9%<br />
10 Fed Nominees (Pvt) Ltd 10.2 1.9%<br />
EBITDA margins recovering<br />
EBITDA margins recovered to 13.8% as the cotton business recorded<br />
EBITDA of US$ 16.5m, seed business US$ 2.4m, FMCG US$ 0.2m and<br />
spinning, a loss of US$ 0.9m. Group operating profit of US$ 8.5m was<br />
negatively impacted by impairments of US$ 5.2m of which US $3.0m<br />
relates to investment in subsidiaries (mainly Scottco) and US$ 1.4m<br />
cotton business inventories.<br />
Finance charges increased with approximately US$ 10.0m in the<br />
cotton business as the producer price doubled. The cotton business<br />
however contributed US$ 4.6m to group PAT from a loss of US$ 5.6m,<br />
the seed business a loss of US$ 1.4m, FMCG a loss of US$ 3.4m versus<br />
US$ 1.3m and spinning a US$ 1.6m loss from a loss of US$ 0.6m.<br />
Cash flows were strained due to increased working capital<br />
Short-term borrowings increased to US$ 162.0m from US$ 119.0m and<br />
the average cost was approximately 10.8%. The borrowings are<br />
expected to wind down to approximately US$ 50.0m by FY <strong>2012</strong> with<br />
about US$ 30.0m in the cotton business.<br />
Outlook<br />
Management anticipates a marginal increase in group sales volumes for<br />
FY <strong>2012</strong> mainly impacted by the FMCG business. Nonetheless, the<br />
cotton and seed businesses are expected to post significant earnings<br />
growth. Recoveries in the cotton business for the out grower scheme<br />
have recovered to average above 90%. The FMCG business is expected<br />
to turn to profit in FY 2013. The disposal of Exhort is nearing<br />
completion while Scottco’s disposal has remained problematic and is<br />
likely to be closed.<br />
Valuation and Recommendation<br />
AICO remains undervalued by the market on a sum of parts (S.O.P)<br />
basis. AICO’s 51% stake in SeedCo is currently valued at US$ 88.6m.<br />
This value is in actual fact greater than AICO’s current market<br />
capitalisation of US$ 79.7m. The market has somewhat missed the cue<br />
as it also means that the value of the other businesses (Cottco, Olivine<br />
and Scottco) are not being factored in.<br />
Using a S.O.P valuation approach, we derived a value of US 36c,<br />
implying a 140% upside potential to the current price of US 15c. BUY.<br />
AICO H1 <strong>2012</strong> results<br />
Income Statement (US$ '000) H1 2011 H1 <strong>2012</strong> % change<br />
Turnover 53,082.0 115,021.0 116.7<br />
EBITDA (500.0) 15,900.0<br />
PBIT (4,173.0) 8,591.0<br />
Net finance income (8,170.0) (13,337.0) 63.2<br />
PBT (11,706.0) (4,086.0) (65.1)<br />
Attributable earnings (10,060.0) (4,105.0) (59.2)<br />
EPS (USc) (1.82) (0.74) (59.3)<br />
Balance Sheet (US$ '000) FY 2011<br />
Total Assets 251,735.0 350,263.0 39.1<br />
NAV 80,595.0 83,808.0 4.0<br />
Current Assets 146,620.0 238,186.0 62.5<br />
Current Liabilities 101,716.0 200,236.0 96.9<br />
Current ratio 1.4 1.2 (17.5)<br />
Cash flow (US$ '000) H1 2011<br />
Operating activities (63,337.0) (76,406.0) 20.6<br />
Investing activities (6,599.0) (9,006.0) 36.5<br />
Financing activities 44,515.0 57,718.0 29.7<br />
16
AICO- 5 YEAR CGR COMPARISON<br />
31 MAR (US$m) 2006 2007 2008 2009 2010 2011 <strong>2012</strong>F 2013F<br />
Balance sheet<br />
Shareholders' equity 16.3 5.4 82.6 85.7 82.5 80.6 86.7 91.0<br />
Minority interests 4.2 3.5 17.9 29.6 32.1 36.0 43.9 44.8<br />
Total shareholders' funds 21.3 10.3 136.9 154.9 114.6 135.3 144.2 149.4<br />
Interest Bearing Debt 33.5 7.2 15.4 40.7 57.3 115.6 102.7 95.6<br />
Trade creditors 8.0 1.0 5.6 9.3 40.1 0.0 0.0 0.0<br />
Current Liabilities 44.9 2.7 7.5 17.4 52.8 0.8 2.0 1.7<br />
Total Liabilities and equity 67.2 20.2 159.8 212.9 224.7 251.7 248.8 246.7<br />
Fixed Assets 4.7 6.8 126.1 132.8 116.8 104.2 105.2 110.5<br />
Investments 0.0 0.0 0.8 2.0 0.7 0.4 0.8 0.2<br />
<strong>Stock</strong> - Trade net 11.2 5.7 10.1 29.6 37.4 0.0 0.0 0.0<br />
Debtors 13.7 5.6 18.9 30.8 29.9 0.0 0.0 0.0<br />
Cash at bank 31.4 1.4 1.5 5.7 12.2 0.0 0.0 0.0<br />
Current Assets 62.5 13.4 32.9 78.2 107.1 147.2 142.8 136.0<br />
Total Assets 67.2 20.2 159.8 212.9 224.7 251.7 248.8 246.7<br />
Income Statement<br />
Turnover 67.5 47.4 145.0 120.7 162.9 210.6 278.0 296.1<br />
Gross profit 2.8 31.0 94.6 83.4 57.7 86.4 80.6 91.8<br />
EBITDA 33.5 34.8 40.0 41.3 40.8 41.1 41.9 42.7<br />
Net finance income 0.0 8.0 (6.7) (9.0) (10.8) (17.2) (15.3) (14.2)<br />
Profit before Tax 22.5 27.4 61.6 16.8 4.9 20.0 18.7 25.7<br />
Taxation 0.0 7.5 13.2 2.9 0.3 1.5 1.4 6.4<br />
Profit after Tax 22.5 19.9 46.0 15.3 4.5 18.6 17.4 19.3<br />
Minorities 0.0 1.8 10.7 7.6 6.7 8.5 8.0 8.9<br />
Attributable Income 31.1 19.8 35.3 7.8 -4.3 8.9 9.4 10.4<br />
Weighted shares 531.7 531.7 531.7 531.7<br />
EPS (USc) 5.8 3.7 6.6 1.5 (0.8) 1.7 1.8 2.0<br />
Cash EPS (USc) 5.8 3.7 6.6 1.5 (0.8) 1.7 1.8 2.0<br />
DPS (USc) 1.2 0.0 5.1 0.0 0.0 0.0 0.0 0.0<br />
NAV per share (USc) 3.1 1.0 15.5 16.1 15.5 15.2 16.3 17.1<br />
Growth Ratios<br />
Sales growth (%) (58.81) (29.73) 205.68 (16.75) 34.97 29.32 32.00 6.50<br />
Pre-interest profit growth (%) (32.94) (13.64) 251.83 (60.59) (52.45) 160.07 2.31 17.43<br />
Earnings growth (%) (5,697.84) (36.18) 78.24 (78.00) (154.93) (309.51) 4.98 10.96<br />
Margins<br />
Gross margin (%) 4.1 65.4 65.2 69.1 35.5 41.0 29.0 31.0<br />
EBITDA margin (%) 33.3 43.6 51.5 28.8 12.3 19.4 15.3 16.6<br />
Pre-interest margin (%) 33.3 40.9 47.1 22.3 7.8 15.8 12.2 13.5<br />
Interest cover (times) n/a n/a 10.2 3.0 1.2 1.9 2.2 2.8<br />
Pre-tax profit margin (%) 33.3 57.7 42.5 14.0 3.0 9.5 6.7 8.7<br />
*Note: Financial figures for 2006 to 2008 were derived using the Old Mutual Implied Rate (OMIR), which<br />
may not reflect a true account due to variability of exchange rates during that period.<br />
17
EQUITY RESEARCH<br />
ZIMBABWE<br />
BANKING<br />
Slowly but surely<br />
Barclays Bank turned the corner to post a profit in FY 2011.<br />
This was on the back of improved efficiencies following the<br />
two restructuring exercises as well as growth in both funded<br />
and non-funded income. We believe that Barclays is an<br />
attractive play on the <strong>Zimbabwe</strong>an economy.<br />
• Operating in the black<br />
The bank reported attributable earnings of US$ 1.4m as<br />
funded income’s contribution increased to 21% of total<br />
income.<br />
• Superior asset quality<br />
The quality of the advances book remained solid with<br />
impairments less than 1% of the book. The coverage<br />
ratio improved to 552% from 250%.<br />
• Cost to income ratio to recede<br />
Post the restructuring management believe that the<br />
bank’s cost structures have been optimised and focus<br />
will be on growing income. The bank’s long term target<br />
cost to income ratio is 50%. The bank’s opex is covered<br />
86.8% by the fee income, hence Barclays is well poised<br />
for significant earnings growth once the advances book<br />
starts to grow.<br />
• Valuations are demanding<br />
Current ratings are demanding versus the sector<br />
average PBV of 0.8x and PER of 7.7x. Nonetheless,<br />
valuations based on earnings are fraught with high risk<br />
due to the significant uncertainties prevailing in the<br />
local financial sector. Traditionally, Barclays trades at a<br />
premium as it offers a perceived safe haven and due to<br />
its conservative approach to business. We believe that<br />
Barclays is an attractive play on the recovery of the<br />
<strong>Zimbabwe</strong>an economy. HOLD.<br />
BLOOMBERG: BARC:ZH<br />
Hold<br />
Current price (USc) 3.7<br />
Target price (USc) 5.5<br />
Upside/Downside (%) 48.6<br />
Liquidity<br />
Market Cap (US$m) 79.6<br />
Shares (m) 2,152.6<br />
Free float (%) 20.7<br />
Ave. daily vol ('000) 244.1<br />
Share price performance<br />
6 Months (%) (26.0)<br />
Relative change (%)* (17.6)<br />
12 Months (%) (20.0)<br />
Relative change (%)* (17.6)<br />
*Relative to ZSE Industrial Index<br />
Financials (US$m) - 31 Dec 2011 <strong>2012</strong>F 2013F<br />
Net Interest income 6.7 11.0 15.8<br />
Profit before tax 2.1 6.6 12.2<br />
Attributable earnings 1.4 5.0 9.1<br />
EPS (USc) 0.1 0.2 0.4<br />
DPS (USc) - - -<br />
NAV/share (USc) 1.6 1.8 2.2<br />
Ratios<br />
RoaA % 0.6 1.8 2.8<br />
RoaE % 4.4 13.8 21.2<br />
PBV (x) 2.4 2.1 1.7<br />
PER (x) 56.7 16.0 8.7<br />
Cost/Income (%) 93.5 81.8 73.3<br />
Advances/Deposits (%) 27.4 27.7 30.5<br />
Earnings Yield (%) 1.8 6.2 11.5<br />
Net Interest margin (%) 3.3 4.5 5.6<br />
Cost of funds (%) 1.0 1.5 2.1<br />
Barclays - volume vs price<br />
9<br />
5<br />
4<br />
6<br />
3<br />
3<br />
2<br />
1<br />
-<br />
0<br />
<strong>May</strong>-11 Sep-11 Jan-12 <strong>May</strong>-12<br />
STRENGTHS<br />
Strong management team<br />
Strong parent company<br />
Access to lines of credit<br />
Extensive network/clientele<br />
Extensive skills pool<br />
OPPORTUNITIES<br />
Technology transfer<br />
Recapitalisation of industry<br />
and commerce<br />
Huge credit appetite from pvt<br />
sector<br />
WEAKNESSES<br />
High cost base<br />
Breakdown in credit histories<br />
No scope to expand regionally<br />
Less flexible/agile<br />
THREATS<br />
New entrants into the market<br />
High credit risk<br />
Indegenisation<br />
Systemic risk<br />
Domestic disintermediation<br />
Volume (m) RHS<br />
Price (USc) LHS<br />
Source: IES<br />
18
Nature of business<br />
Barclays is a world-class bank and one of the leading commercial<br />
banks in <strong>Zimbabwe</strong>. The bank operates 43 ATMs from an installed<br />
capacity of 76 and, 36 branches which are located in the large<br />
commercial centres, with the other branches dotted around the<br />
country. Barclays commands approximately 8% and 3% market<br />
share, in terms of deposits and total lending respectively,<br />
employing a total of 619 employees.<br />
<strong>Overview</strong> of FY 2011 results<br />
Operating in the black<br />
Barclays Bank turned the corner to post attributable earnings of<br />
US$ 1.4m from a loss of US$ 1.3m. This was on the back of<br />
improved efficiencies following the two restructuring exercises as<br />
well as growth in both funded and non-funded income. The total<br />
cost of the restructuring amounted to approximately US$ 14.0m<br />
and total savings are estimated at approximately US$ 3.3m per<br />
year.<br />
Strong improvement in margins<br />
NII surged by a healthy 140.3%, albeit off a low base to US$ 6.7m<br />
supported by a 36% increase in advances and expansion in net<br />
interest margin to 3.5% from 1.7%, mainly triggered by the low<br />
funding costs. We estimate that Barclays’ loan spreads hovered<br />
around the 5%–15% region. The NII contribution to total income<br />
improved to 21.0% from 10.9% in FY 2010.<br />
Traction in multiple fee income streams<br />
Adjusted non-funded income accelerated 11.3% to US$ 25.8m on<br />
increased transactional volumes and comprised ledger fees of<br />
33.3% (vs 26.8% in the prior period), cash withdrawal fees 30.0%<br />
(31.3%), other fee & commission income 23.5% (26.6%) and forex<br />
income 10.3% (13.0%). Transaction volumes increased to over<br />
4.0m, from 3.3m in FY 2010 on the back of a 19.2% increase in<br />
accounts to 155,000 as well as the launch of new products.<br />
Barclays shareholding - 31 December 2011<br />
Shareholder # of shares (m) %<br />
1 Afcarme <strong>Zimbabwe</strong> Holdings 1,457.3 67.7%<br />
2 Old Mutual Life Assurance A/ 173.3 8.0%<br />
3 Stanbic Nominees P/L- NNR A 113.5 5.3%<br />
4 Old Mutual <strong>Zimbabwe</strong> Ltd 76.0 3.5%<br />
5 Barclays <strong>Zimbabwe</strong> Nominees 63.6 3.0%<br />
6 Barclays <strong>Zimbabwe</strong> Nominees 52.9 2.5%<br />
7 Fed Nominees (Pvt) Ltd 27.1 1.3%<br />
8 Mining Industry Pension Fund 14.8 0.3%<br />
9 Communication and Allied Pe 8.4 0.4%<br />
10 Guramatunhu Family Trust 8.0 0.4%<br />
Loan book<br />
Transport & Distribution 9%<br />
Personal loans 7%<br />
Light & Heavy Industry 41%<br />
Trade & services<br />
16%<br />
Agriculture 27%<br />
Source: IES, Company<br />
Cost to income ratio declined<br />
The adjusted cost to income ratio improved to 92.9% from 105.7%.<br />
Although the bank remained very conservative, adjusted opex was<br />
covered 86.8% by non-funded income. Staff costs comprised 54%<br />
of total opex. Post the restructuring the bank’s opex has been<br />
optimised.<br />
Superior asset quality maintained<br />
The balance sheet increased 13.6% to US$ 260.0m on the back of a<br />
35.6% and 16.7% growth in advances and deposits, respectively.<br />
The quality of the advances book remained solid with impairments<br />
less than 1% of the book. The coverage ratio improved 552% from<br />
250%. The capital adequacy ratio was 19% against a regulatory<br />
minimum of 10%. Liquidity was also high with a liquidity ratio of<br />
69%. Return on shareholder funds was low at 4.0% reflecting the<br />
bank’s reluctance to take on risk assets.<br />
Outlook<br />
Cost to income ratio to continue to improve<br />
Post the restructuring, management believes that the bank’s cost<br />
structures have been optimised and focus will be on growing<br />
income. We estimate that the bank’s CIR will ease to<br />
approximately 75% in FY <strong>2012</strong> before receding further to about<br />
60% in FY 2013. The bank‘s long term target cost to income ratio<br />
is 50%. The bank’s opex is 86.8% covered by fee income, hence<br />
Barclays is well poised for significant earnings growth once the<br />
advances book starts to grow.<br />
19
Management is targeting a 14% growth in total income<br />
in FY <strong>2012</strong>. We believe that the income growth can be<br />
accelerated once the bank moves from the<br />
restructuring and rationalisation phase. The drive to<br />
E-channel is expected to result in improved<br />
efficiencies enabling the bank to ramp up income on<br />
the launch of profitable products.<br />
Valuation and Recommendation<br />
Barclays remains expensive from a valuation point of<br />
view despite the improved performance recorded in<br />
2011 as it is trades at significant premiums to the<br />
sector average PBV of 0.8x and PER of 7.7x.<br />
Nonetheless, investors should note that<br />
valuations based on earnings are fraught with<br />
high risk due to the significant uncertainties<br />
prevailing in the local financial sector. In our<br />
view, the valuations can quickly unwind if the<br />
operating environment changes substantially.<br />
Key attractions for Barclays include the superior<br />
asset quality, extensive low cost deposit base,<br />
which will generate substantial funded revenue<br />
streams in the years to come. We recommend a<br />
HOLD for long-term investors.<br />
BARCLAYS - 5 YEAR CGR COMPARISON<br />
31 DECEMBER (US$m) 2006 2007 2008 2009 2010 2011 <strong>2012</strong>F 2013F<br />
Balance Sheet<br />
Shareholders' equity 13.8 4.6 26.2 32.2 30.9 33.5 38.5 47.6<br />
Deposits and current accounts 52.4 20.9 116.8 122.3 183.2 213.7 253.2 287.4<br />
Current and other liabilities 7.1 2.4 22.6 14.9 14.8 12.8 12.4 12.1<br />
Total Liabilities 59.6 23.4 139.4 137.1 198.0 226.5 265.6 299.6<br />
Liabilities and shareholders' funds 73.3 27.9 165.6 169.3 228.9 260.0 304.1 347.2<br />
Fixed assets 7.7 5.0 18.4 21.2 21.9 21.1 22.8 25.1<br />
Total cash and short term funds 37.5 16.2 67.3 46.5 61.0 78.2 98.2 103.5<br />
Total advances and acceptances 9.7 6.4 2.8 20.3 43.1 58.5 70.2 87.8<br />
Total operating assets 65.5 22.9 132.0 131.8 190.9 222.3 264.4 305.0<br />
Total assets 73.3 27.9 165.6 169.3 228.9 260.0 304.1 347.2<br />
Income Statement<br />
Net interest income 44.5 22.1 0.4 1.2 2.8 6.7 11.0 15.8<br />
Non funded income 6.2 1.6 5.1 16.4 29.7 33.5 29.5 33.2<br />
Total operating income 50.7 23.8 5.5 17.5 32.5 40.2 40.5 49.0<br />
Total Expenses 19.0 10.1 0.9 16.9 34.3 38.1 33.9 36.8<br />
Operating profit 31.8 13.6 4.6 0.6 (1.9) 2.1 6.6 12.2<br />
Associate income<br />
Profit before Tax 31.8 13.6 19.6 0.6 (1.9) 2.1 6.6 12.2<br />
Taxation 11.7 5.0 6.9 (0.9) (0.6) 0.7 1.7 3.0<br />
Profit after Tax 20.2 8.6 12.7 1.5 (1.3) 1.4 5.0 9.1<br />
Adj.Attributable Income 20.2 8.6 3.0 1.5 (1.9) 1.4 5.0 9.1<br />
Weighted shares 2,152 2,152 2,152<br />
Adj. EPS (USc) 0.9 0.4 0.1 0.1 (0.1) 0.1 0.2 0.4<br />
DPS (USc) 0.2 0.0 - - - - - -<br />
NAV/share (USc) 0.6 0.2 1.2 1.5 1.4 1.6 1.8 2.2<br />
Growth Ratios<br />
NII growth (%) (34.1) (50.3) (98.0) 164.3 143.1 140.3 64.1 43.4<br />
Op exp growth (%) (34.0) (46.6) (90.7) 1,701.7 102.9 10.9 (10.9) 8.6<br />
PBT growth (%) (42.2) (57.2) 43.7 (96.9) (403.0) (214.3) 212.5 84.0<br />
Eps growth (%) (41.3) (57.3) 48.0 (88.5) (187.2) (210.1) 253.5 84.0<br />
Deposit growth (%) (52.0) (60.1) 458.5 4.7 49.9 16.7 18.5 13.5<br />
Advances growth (%) (56.9) (33.5) (56.8) 632.5 112.1 35.6 20.0 25.0<br />
Net Asset Growth (%) (25.5) (66.7) 471.9 22.8 (3.9) 8.4 14.8 23.7<br />
Profitability/Efficiency (%)<br />
Adj. Non-interest income:total income 12.3 6.8 92.1 93.4 91.4 83.3 72.8 67.7<br />
Net Interest Income/Assets 60.7 79.3 0.3 0.7 1.2 2.6 3.6 4.6<br />
Return on ave Assets 18.7 17.0 13.2 0.9 (0.6) 0.6 1.8 2.8<br />
Return on Equity 125.2 93.9 82.8 5.0 (4.0) 4.4 13.8 21.2<br />
Costs/Income 35.7 39.9 16.8 98.4 104.7 93.5 81.8 73.3<br />
Costs/Assets 16.8 18.7 1.0 10.3 17.1 15.4 11.8 11.0<br />
Asset Management Measures (%)<br />
Net Interest Margin 43.1 50.1 0.6 0.9 1.7 3.3 4.5 5.6<br />
Cost of funds 35.5 17.5 0.0 0.9 1.0 1.0 1.5 2.1<br />
Loan/Deposit ratio 18.4 30.7 2.4 16.6 23.6 27.4 27.7 30.5<br />
Shareholder Equity:Advances 142.4 71.3 943.0 158.1 71.6 57.3 54.8 54.2<br />
Equity/Assets 18.8 16.4 15.8 19.0 13.5 12.9 12.7 13.7<br />
*Note: Financial figures for 2006 to 2008 were derived using the Old Mutual Implied Rate (OMIR), which may not reflect a true<br />
account due to variability of exchange rates during that period.<br />
20
EQUITY RESEARCH<br />
ZIMBABWE<br />
TOBACCO/FMCG<br />
A strong puff of smoke<br />
BATZ is the dominant cigarettes distributor in<br />
<strong>Zimbabwe</strong> with a market share of 73% of the smoking<br />
population in a market estimated to consume<br />
approximately 2.5 billion sticks a year. The company’s<br />
flagship brand, Madison, continues to record strong<br />
growth. We believe that BATZ is well placed to benefit<br />
from the steady increase in consumption expenditure<br />
likely to emanate from a young population in a growing<br />
economy.<br />
• Dominant market share<br />
BATZ holds a dominant market share estimated at<br />
73% of the <strong>Zimbabwe</strong>an market. This is largely due<br />
to the prohibitive set-up costs of production,<br />
marketing and distribution functions. Smokers are<br />
notorious for their strong brand loyalties and new<br />
players would incur significant advertising costs.<br />
• Strong cash generation<br />
Cash generation was strong with net operating cash<br />
flow of US$ 5.1m, implying a cash interest cover of<br />
12.5x. Net gearing significantly improved to 43%<br />
from 90%.<br />
• Strong distribution network<br />
BATZ has a strong countrywide distribution network<br />
operating out of five depots in Harare, Bulawayo,<br />
Gweru, Mutare and Masvingo, with outlying areas<br />
being serviced by third parties.<br />
• Generous dividend policy<br />
The company’s dividend policy of paying out 100% of<br />
net earnings and a high dividend yield (c14% in FY<br />
12) provides attractive returns to investment.<br />
• Ratings are undemanding<br />
Ratings are undemanding at a historic PER of 6.4x<br />
and PBV of 3.7x. Return on shareholder funds (RoaE)<br />
and asset utilization (RoaA) are impressive at 71%<br />
and 15%, respectively. The company has a generous<br />
dividend policy. BUY.<br />
BAT - volume vs price<br />
250<br />
200<br />
150<br />
100<br />
50<br />
-<br />
<strong>May</strong>-11 Sep-11 Jan-12 <strong>May</strong>-12<br />
Volume RHS<br />
Price (USc) LHS<br />
125,000<br />
100,000<br />
75,000<br />
50,000<br />
25,000<br />
-<br />
Source: IES<br />
BLOOMBERG: BATZL:ZH<br />
BUY<br />
Current price (USc) 215.0<br />
Target price (USc) 250.0<br />
Upside/Downside (%) 16.3<br />
Liquidity<br />
Market Cap (US$m) 37.4<br />
Shares (m) 17.4<br />
Free float (%) 17.4<br />
Ave. daily vol ('000) 2.7<br />
Share price performance<br />
6 Months (%) 34.4<br />
Relative change (%)* 49.6<br />
12 Months (%) 19.4<br />
Relative change (%)* 49.2<br />
*Relative to ZSE Industrial Index<br />
Financials (US$m) - FY 31 Dec 2011 <strong>2012</strong>F 2013F<br />
Turnover 39.8 54.7 67.0<br />
EBITDA 6.4 8.8 8.9<br />
Net finance income (0.4) (0.5) (0.4)<br />
Attributable earnings 4.9 7.3 7.5<br />
EPS (USc) 28.1 41.8 43.4<br />
NAV/share (USc) 48.8 51.9 55.1<br />
DPS (USc) 26.0 38.7 40.2<br />
Valuation Ratios<br />
Volume (m) 1,650.0 1,450.0 1,595.0<br />
PER (X) 7.7 5.1 5.0<br />
PBV (X) 4.4 4.1 3.9<br />
EV/EBITDA (x) 6.4 4.7 4.6<br />
Earnings Yield (%) 13.1 19.4 20.2<br />
Dividend Yield (%) 12.1 18.0 18.7<br />
Gearing (%) 42.6 30.5 16.5<br />
RoaA (%) 15.3 19.5 18.0<br />
RoaE (%) 70.6 83.0 81.1<br />
STRENGTHS<br />
WEAKNESSES<br />
Market leader<br />
Low disposable incomes<br />
Strong brand<br />
Energy disruptions<br />
Strong cash generation Commodities driven<br />
Strong distribution network<br />
Strong management<br />
OPPORTUNITIES<br />
THREATS<br />
New products<br />
Commodity price shocks<br />
Economic recovery<br />
Not a dominant manufacture locally<br />
Well established competition<br />
21
Nature of business<br />
BAT processes tobacco products mainly for the domestic market with<br />
exports being cut rag tobacco to Mozambique. The company<br />
manufactures approximately 1.8bn cigarettes. BATZ’s main<br />
competitor, Savvanna is the largest manufacturer of cigarettes<br />
although the bulk of its production is exported. The company<br />
markets both Global Drive Brands (e.g. Dunhill & Newbury) and local<br />
brands like Madison, Everest, Kingsgate and Berkleley. Madison is the<br />
flagship brand contributing about 67% of volumes.<br />
<strong>Overview</strong> of FY 2011 results<br />
A stellar performance<br />
In FY 2011, BAT reported a stellar set of financials on the back of a<br />
strong growth in volumes (+41% y-o-y to 1.7 billion sticks) and<br />
improved margins. Sales volumes for the main stream brand, Madison<br />
grew strongly at 61%.<br />
BATZ Shareholding - Jan 2011<br />
Shareholding No. shares %<br />
1 B.A.T International Holdings (UK) Limited 9.9 57.0%<br />
2 Old Mutual Life Assurance Co Zim Ltd 3.1 17.6%<br />
3 FED Nominees (Private) Limited 1.1 6.6%<br />
4 Barclays <strong>Zimbabwe</strong> Nominees (Pvt) NNR 0.4 2.5%<br />
5 Barclays <strong>Zimbabwe</strong> Nominees (Pvt) Ltd NNR 0.3 1.5%<br />
6 Old Mutual <strong>Zimbabwe</strong> Limited 0.3 1.5%<br />
7 RM Insurance Company Limited 0.1 0.7%<br />
8 Barclays <strong>Zimbabwe</strong> Nominees (Pvt) NNR 0.1 0.4%<br />
9 Delta Beverages Pension Fund 0.1 0.4%<br />
10 Stanbic Nominees (Pvt) Ltd 0.1 0.4%<br />
Good margin business<br />
Improved production efficiencies, cost management and the change<br />
in the sales mix aided margins as GP margins surged to 46% from 31%<br />
and operating margins widened to 18.5% from 0.8%, resulting in<br />
operating profits increasing 40x. A generous final dividend of US$<br />
0.16 was declared, implying a cover of 1.1x and dividend yield of<br />
15.6%.<br />
Solid balance sheet<br />
Cash generation was strong with net operating cash flow of US$<br />
5.1m, implying a cash interest cover of 12.5x. Net gearing<br />
significantly improved to 43% from 90%. Trade debtors were<br />
significantly down to US$ 4.9m from US$ 12.8m. In addition, stock<br />
turnover reduced significantly from 90 days to only 20 days reflecting<br />
an efficient inventory management system.<br />
Outlook<br />
While margins in the cigarette manufacturing business are relatively<br />
high, the market is very price sensitive. Excise duties in <strong>Zimbabwe</strong><br />
are high for a developing country, and with the Government revenue<br />
inflows remaining under pressure, are unlikely to be reduced in the<br />
foreseeable future. For FY <strong>2012</strong> volumes are expected to decline by<br />
approximately 12% due to the price increases effected in December<br />
2011.<br />
The increase in awareness of the health risks associated with<br />
smoking has resulted in a decline in cigarette consumption in the<br />
developed world while statistics from W.H.O have shown that the<br />
opposite is true for most developing nations in Southern Africa. The<br />
tolerant attitude of <strong>Zimbabwe</strong>ans in general towards smoking, brand<br />
loyalty, considerable barriers to entry and the habit-forming nature<br />
of cigarette smoking are all factors that help insulate the industry.<br />
Input cost increases are a particular concern. Leaf tobacco makes up<br />
40% of the non-excise cost of production. Worldwide shortages have<br />
seen prices on the local auction floors rising strongly by xx%. The full<br />
effects of this have not yet been felt by BATZ, as this leaf will only<br />
come into production during FY 2013.<br />
Valuation and Recommendation<br />
Cigarette demand is closely linked to GDP levels, and BATZ’s long<br />
term growth is therefore dependent on economic growth. BATZ has<br />
strong brands and a solid distribution network. Margins are set to<br />
expand on improved production efficiencies and effective<br />
22
distribution.<br />
Ratings are undemanding at a historic PER of 6.4x and<br />
PBV of 3.7x. Return on shareholder funds (RoaE) and<br />
asset utilisation (RoaA) are impressive at 71% and 15%,<br />
respectively. The company has a generous dividend<br />
policy.<br />
BATZ is a well managed, strong cash generating<br />
company operating in one of the most profitable<br />
sectors in the economy. Its growth record and<br />
strong balance sheet warrant above average<br />
ratings. BUY.<br />
BATZ - 5 YEAR CGR COMPARISON<br />
28 FEBRUARY (US$m) 2006 2007 2008 2009 2010 2011 <strong>2012</strong>F 2013F<br />
Balance Sheet<br />
Shareholders' equity 2.1 0.1 53.0 6.2 5.4 8.5 9.0 9.6<br />
Minority interests 0.0 0.0 0.0 0.0 0.0 0.0 0.0 0.0<br />
Total shareholders' equity 2.1 0.1 66.1 8.3 7.6 10.6 10.9 11.3<br />
Interest Bearing Debt 0.0 0.0 0.0 3.9 5.9 5.9 5.3 4.5<br />
Trade creditors 2.3 0.7 0.1 8.2 10.1 14.1 19.4 24.0<br />
Current Liabilities 3.9 0.9 0.5 8.7 19.9 15.5 21.1 26.1<br />
Total Liabilities and equity 6.0 0.9 66.6 20.9 33.4 31.9 37.3 41.8<br />
Fixed Assets 0.2 0.0 0.0 9.3 8.8 9.6 9.6 9.6<br />
Investments 0.8 0.3 65.3 0.3 0.2 0.6 0.6 0.6<br />
<strong>Stock</strong> - Trade net 1.0 0.1 0.0 2.9 10.5 14.6 19.1 22.0<br />
Debtors 3.7 0.4 0.0 8.0 12.8 4.9 5.5 6.8<br />
Cash at bank 0.3 0.0 1.3 0.5 1.1 2.2 2.5 2.9<br />
Current Assets 5.0 0.6 1.3 11.3 24.4 21.7 27.1 31.7<br />
Total Assets 6.0 0.9 66.6 20.9 33.4 31.9 37.3 41.8<br />
Income Statement<br />
Turnover 14.7 4.3 0.0 15.1 22.9 39.8 54.7 67.0<br />
PBIT 7.3 0.1 0.0 -0.5 -0.2 6.4 8.8 8.9<br />
Other income 0.1 0.3 0.0 0.9 0.4 1.0 1.1 1.2<br />
Profit before Tax 9.5 0.6 0.0 0.2 -0.3 6.9 9.4 9.7<br />
Taxation 3.7 0.2 0.0 -0.1 0.2 2.1 2.1 2.2<br />
Profit after Tax 5.8 0.4 0.0 0.3 -0.5 4.9 7.3 7.5<br />
Minorities 0.0 0.0 0.0 0.0 0.0 0.0 0.0 0.0<br />
Attributable Income 5.8 0.4 0.0 0.3 -0.5 4.9 7.3 7.5<br />
Weighted shares - -<br />
EPS (USc) 33.6 2.5 0.0 1.7 -2.9 28.1 41.8 43.4<br />
Cash EPS (USc) 33.6 2.5 0.0 1.7 -2.9 28.1 41.8 43.4<br />
DPS (USc) 31.6 2.4 0.0 0.0 0.0 26.0 38.7 40.2<br />
NAV per share (USc) 12.1 0.4 305.1 35.4 30.8 48.8 51.9 55.1<br />
Growth Ratios<br />
Sales growth (%) (22.7) (71.1) (100.0) 50.9 74.1 37.5 22.5<br />
Pre-interest profit growth (%) 22.7 (98.3) (100.0) (48.5) (2,822.2) 37.5 1.7<br />
Earnings growth (%) (9.4) (92.5) (99.8) 40,592.8 (266.3) (1,078.6) 48.8 3.9<br />
Margins<br />
Gross margin (%) 95.8 94.2 100.0 53.7 30.6 46.2 46.2 43.5<br />
Pre-interest margin (%) 49.4 2.9 47.1 -3.0 -1.0 16.0 16.0 13.3<br />
Interest cover (times) n/a n/a n/a -1.8 -0.5 15.7 18.4 22.8<br />
Pre-tax profit margin (%) 64.7 15.0 2,769.5 1.6 -1.3 17.4 17.1 14.5<br />
*Note: Financial figures for 2006 to 2008 were derived using the Old Mutual Implied Rate (OMIR), which may not reflect a tr<br />
account due to variability of exchange rates during that period.<br />
23
EQUITY RESEARCH<br />
ZIMBABWE<br />
FINANCIAL<br />
Bruised, not broken - remains on even keel<br />
In FY 2011, <strong>Zimbabwe</strong>’s banking behemoth, CBZH, posted<br />
strong net profit growth of 61% to US$ 30.2m despite the<br />
bank having faced tight liquidity constraints in the last<br />
quarter. Strong performance of NII, and an improvement<br />
in fee and commission income coupled with cost<br />
containment were the major profit drivers. Despite a 25%<br />
plus RoaE, the bank trades at significant discounts (10%-<br />
30%) to its peers, mainly due to the poor perception of<br />
its asset quality. In our view, CBZH, as the largest bank in<br />
the country by all matrices should re-rate accordingly.<br />
• Dominant position<br />
The group has the largest depositor base in the<br />
country at over US$ 830.0m and an advances book of<br />
US$ 790.0m, controlling 22% of total system assets,<br />
28% of deposits and 31% of advances. The group<br />
operates 58 branches, 89 installed ATMs and 419 POS<br />
machines.<br />
• Group rationalisation to improve efficiencies<br />
The future prospects of the group are highly<br />
dependent on its ability to curb costs. The group is<br />
targeting a cost to income ratio of approximately<br />
50%.<br />
• Fee income – a core focus area<br />
CBZ Holdings is diversifying and improving its fee<br />
income streams. CBZH views insurance products as<br />
an area of significant future growth for the group<br />
and the ability to cross-sell non-banking products to<br />
its large customer base can aid future profitability.<br />
• Remains undervalued<br />
On a sum of the parts valuation we estimate a fair<br />
value for CBZ Holdings of US 26c per share, implying<br />
41% upside potential on the current price. In our<br />
view, the discount is likely to narrow in the near<br />
term. We believe that CBZH’s operations are in<br />
better shape than the market has given it credit for.<br />
BUY.<br />
BLOOMBERG: CBZ:ZH<br />
BUY<br />
Current price (USc) 7.0<br />
Target price (USc) 26.0<br />
Upside/Downside (%) 271.4<br />
Liquidity<br />
Market Cap (US$m) 47.9<br />
Shares (m) 684.1<br />
Free float (%) 30.4<br />
Ave. daily vol ('000) 245.1<br />
Share price performance<br />
6 Months (%) (46.2)<br />
Relative change (%)* (40.0)<br />
12 Months (%) (60.9)<br />
Relative change (%)* (51.1)<br />
*Relative to ZSE Industrial Index<br />
Financials (US$m) - FY 31 Dec 2011 <strong>2012</strong>F 2013F<br />
Net Interest income 75.1 90.2 107.6<br />
Non-interest income 48.0 55.7 63.3<br />
Profit before tax 38.2 58.0 76.1<br />
Attributable earnings 30.2 37.1 48.8<br />
EPS (USc) 4.4 5.4 7.1<br />
DPS (USc) 0.3 1.1 2.0<br />
NAV/share (USc) 17.4 21.7 26.8<br />
Ratios<br />
PBV (x) 0.4 0.3 0.3<br />
PER (x) 1.6 1.3 1.0<br />
RoaA % 3.5 3.1 3.4<br />
RoaE % 29.4 27.8 29.4<br />
Cost/income ratio % 57.0 49.8 44.9<br />
Advances/Deposits % 95.2 74.6 77.8<br />
Net Interest margin (%) 5.9 5.2 5.2<br />
Cost of funds (%) 4.6 4.0 5.1<br />
Earnings Yield (%) 63.1 77.5 101.8<br />
Dividend Yield (%) 3.6 15.5 29.1<br />
CBZ Holdings - volume vs price<br />
20<br />
6<br />
15<br />
4<br />
10<br />
2<br />
5<br />
-<br />
0<br />
<strong>May</strong>-11 Sep-11 Jan-12 <strong>May</strong>-12<br />
Volume (m) RHS Price (USc) LHS<br />
Source: IES<br />
STRENGTHS<br />
WEAKNESSES<br />
Large depositor base<br />
Exposure to government<br />
banker to the government<br />
High cost/income ratio hist.<br />
Diversified income stream<br />
Access to external credit lines<br />
Well capitalised with large branch ntwk<br />
OPPORTUNITIES<br />
THREATS<br />
Growth in local market on recap High cost platform<br />
Established presence in Invest. Bnking Prolonged stretch to recapitalisation<br />
Improving macro env. For <strong>Zimbabwe</strong> for the local economy<br />
Recovery of public sector<br />
Foreign lines of credit<br />
24
Nature of business<br />
CBZ Holdings is a diversified financial holding company with<br />
operations spanning commercial banking, asset management, shortterm<br />
insurance, life insurance and property. The banking and<br />
principal subsidiary, CBZ Bank, is the country’s largest bank with 22%<br />
of total system assets, 28% of deposits and 31% of advances. The<br />
group operates 58 branches, 89 installed ATMs (39 are active) and<br />
419 POS machines.<br />
<strong>Overview</strong> of FY 2011 results<br />
CBZ Holdings posted a strong set of numbers, showing attributable<br />
earnings of US$ 30.2m, up 61% y-o-y for eps of 4.83 US cents a share.<br />
The strong performance was driven by a strong NII performance from<br />
the bank and cost containment on improved efficiencies. CBZH<br />
reported an expansion in NIMs to 5.9% from 5.2% in the prior period<br />
on reduced cost of funds. Total income increased 51% to US$ 123.1m<br />
propelled by a 70% jump in funded income making a 61% contribution<br />
to total income from 54%. The growth in non-interest income was<br />
attributed to the increase in commission and fees up 17% to US$<br />
20,6m and forex earnings +252% to US$ 6.3m. The CIR improved to<br />
56% from 67% as opex grew 28%. The growth in opex was on the back<br />
of a 41% increase in staff costs to US$ 38.0m to make a 55%<br />
contribution to total opex versus 50% the prior period. A final<br />
dividend of 0.13 cents was declared implying a dividend yield of 3.3%<br />
and cover of 19x.<br />
CBZH Shareholding - Dec 2011<br />
Shareholder # of shares (m) %<br />
1 Government of <strong>Zimbabwe</strong> 110.0 16.1%<br />
2 Libyan Foreign Bank(NNR) 96.6 14.1%<br />
3 Africa Investments Sub 2 Ltd 92.6 13.5%<br />
4 National Social Security Authority 73.0 10.7%<br />
5 CBZ Holdings Ltd 55.7 8.1%<br />
6 Stanbic Nominees (Pvt) Ltd NNR 16.1 2.4%<br />
7 Stanbic Nominees NNR 15.1 2.2%<br />
8 Datvest Nominees (Pvt) Ltd 15.1 2.2%<br />
9 Stanbic Nominees (Pvt) Ltd NNR 13.8 2.0%<br />
10 Bethel Nominees No. 2 13.7 2.0%<br />
CBZH Advances split<br />
Communications 2%<br />
Services 10%<br />
Private 11%<br />
Transport 3%<br />
Construction 3%<br />
Agriculture 26%<br />
Manageable asset quality<br />
The group’s balance sheet strengthened increasing 54% to US$ 1.1bn<br />
as advances and deposits grew 78% and 35%, respectively. FuM grew<br />
17% to US$ 88.2m. The liquidity ratio averaged 26% for the period.<br />
NPLs grew 27.5 times in absolute terms to US$ 48.0m, representing<br />
6% of advances up from 0.4%. Provisions to total advances worsened<br />
to 2.3% from 1.2%. The group’s provisioning coverage ratio eased to<br />
128% from 294% y-o-y. Management says it is comfortable with a loan<br />
to deposit ratio of between 70% and 75%, in the current<br />
environment. Only 3% of the loan book is to government and related<br />
institutions. Return on shareholders funds improved to 25% from 22%,<br />
while assets utilisation (RoaA) was flat at 3.6%. The bank’s capital<br />
adequacy ratio was 11% with tier-1 capital at 7%.<br />
Outlook<br />
Loan growth to be curtailed<br />
The bank managed to weather the liquidity crunch it faced in late<br />
2011 and early <strong>2012</strong>. The liquidity crisis can be attributed to the use<br />
of “hot money” for long term advances.<br />
Distribution 26%<br />
CBZH Deposits<br />
Customers 68%<br />
Other 2%<br />
Manufacturing 16%<br />
Source: Company, IES<br />
Banks 13%<br />
Money market 19%<br />
Source: Company, IES<br />
Management guided for a 10% growth in total income for FY <strong>2012</strong> and<br />
a CIR of 50%. The balance sheet is expected to grow by 32% driven by<br />
a 48% and 5% growth in deposits and advances, respectively. The<br />
increase in the lines of credit by an additional US$ 120.0m is<br />
expected to propel deposits growth and improve liquidity. However,<br />
the additional funds will be channelled towards restructuring existing<br />
facilities. Ratings are undemanding and the bank appears to be in<br />
better shape than the market has given it credit for. FuM are<br />
forecast to increase by 40% with the insurance assets expected to<br />
grow by 124%.<br />
Group rationalisation to improve efficiencies<br />
Management anticipates saving approximately 35% of combined group<br />
operating expenditure, following the rationalisation of the bank and<br />
building society. The group’s long term CIR is 50%.<br />
PBT split<br />
143%<br />
93%<br />
43%<br />
‐8%<br />
111%<br />
Commercial<br />
Banking<br />
(4%)<br />
Asset<br />
Management<br />
0.4%<br />
Short term<br />
Insurance<br />
8% (7%)<br />
Property<br />
Other<br />
Source: Company, IES<br />
25
Valuation and Recommendation<br />
Strong earnings growth is expected from CBZ Holdings. As<br />
the largest bank in the country, CBZ has and is likely to<br />
continue benefiting from its size. The group is<br />
concentrating on consolidating its position through quality<br />
and efficiency enhancements. Furthermore, CBZH<br />
anticipates unlocking value entrenched in its property<br />
portfolio.<br />
discount to the ZSE. We believe CBZH will grow<br />
earnings faster than the ZSE over the next four<br />
years.<br />
We believe that the share price can easily recover<br />
to above 10 US cents. BUY.<br />
CBZH is currently trading on a forward PER of 1.5x, a 76%<br />
CBZ HOLDINGS - 5 YEAR CGR COMPARISON<br />
31 DECEMBER (US$m) 2006 2007 2008 2009 2010 2011 <strong>2012</strong>F 2013F<br />
Balance Sheet<br />
Shareholders' equity 9.0 18.1 45.9 63.2 86.6 118.9 148.6 183.4<br />
Deposits and current accounts 47.3 16.2 63.9 360.8 578.4 829.9 1,126.1 1,269.2<br />
Current and other liabilities 11.9 4.2 2.1 24.2 17.7 103.5 76.0 87.8<br />
Total Liabilities 59.2 20.4 65.9 385.0 596.1 933.3 1,202.1 1,357.1<br />
Liabilities and shareholders' funds 68.6 44.1 115.1 452.5 686.8 1,055.7 1,353.0 1,542.3<br />
Fixed assets 2.8 16.2 37.4 54.9 57.8 69.0 71.5 75.0<br />
Total cash and short term funds 26.2 14.1 50.3 134.5 153.2 150.4 391.9 429.4<br />
Total advances and acceptances 37.4 5.6 14.6 245.0 444.6 790.3 839.6 987.5<br />
Total operating assets 63.6 19.7 64.9 379.5 597.8 940.8 1,231.5 1,416.9<br />
Total assets 68.6 44.1 115.1 452.5 686.8 1,055.7 1,353.0 1,542.3<br />
Income Statement<br />
Net interest income 31.0 16.0 2.0 16.5 44.2 75.1 90.2 107.6<br />
Non funded income 14.1 59.0 15.2 25.2 37.4 48.0 55.7 63.3<br />
Total operating income 45.1 74.9 17.2 41.7 81.6 123.1 145.9 170.9<br />
Total Expenses 13.3 12.8 0.4 29.6 56.0 84.0 87.9 94.8<br />
Operating profit 31.8 62.2 16.8 12.2 25.6 39.1 58.0 76.1<br />
Associate income 0.0 0.0 0.0 0.0 0.0 (0.9) 0.0 0.0<br />
Profit before Tax 31.8 62.2 16.8 12.1 25.5 38.2 58.0 76.1<br />
Taxation 11.6 15.7 4.8 4.0 6.8 7.9 20.7 27.2<br />
Profit after Tax 20.2 46.6 12.0 8.1 18.8 30.3 37.3 49.0<br />
Minorities 0.0 0.3 0.0 (0.1) 0.1 0.1 0.2 0.2<br />
Adj. Attributable Income 17.4 7.6 2.0 3.4 18.7 30.2 37.1 48.8<br />
Weighted shares<br />
Adj. EPS (USc) 2.5 1.1 0.3 0.5 2.7 4.4 5.4 7.1<br />
DPS (USc) 0.2 1.5 0.0 0.0 0.0 0.3 1.1 2.0<br />
NAV/share (USc) 1.3 2.7 6.7 9.2 12.7 17.4 21.7 26.8<br />
Growth Ratios<br />
NII growth (%) (59.8) (48.4) (87.7) 738.7 167.3 69.9 20.2 19.3<br />
Op exp growth (%) (49.2) (4.0) (96.9) 7,461.0 89.3 50.0 4.7 7.8<br />
PBT growth (%) (55.7) 95.5 (73.0) (27.7) 110.4 49.6 51.7 31.3<br />
Eps growth (%) (57.0) 128.7 (74.0) (31.9) 128.7 61.4 22.9 31.3<br />
Deposit growth (%) (51.5) (65.8) 293.9 465.1 60.3 43.5 35.7 12.7<br />
Advances growth (%) (35.9) (84.9) 158.3 1,581.6 81.5 77.8 6.2 17.6<br />
Net Asset Growth (%) (48.4) 102.1 152.8 37.7 37.1 37.2 25.0 23.4<br />
Profitability/Efficiency<br />
Adj. Non-interest income:total income (%)<br />
Net Interest Income/Assets (%) 45.2 36.3 1.7 3.7 6.4 7.1 6.7 7.0<br />
Return on ave Assets (%) 17.9 82.2 15.1 2.9 3.3 3.5 3.1 3.4<br />
Return on Equity (%) 153.3 341.2 37.5 15.0 25.0 29.4 27.8 29.4<br />
Adj. Costs/Income (%) 29.9 54.2 8.5 69.7 68.6 57.0 49.8 44.9<br />
Costs/Assets (%) 10.8 20.7 0.3 9.2 9.5 8.0 6.0 5.3<br />
Asset Management Measures (%)<br />
Net Interest Margin (%) 21.5 26.8 2.3 3.8 5.4 5.9 5.2 5.2<br />
Cost of funds (%) 30.3 14.2 0.0 1.8 4.5 4.6 4.0 5.1<br />
Loan/Deposit ratio (%) 79.0 34.8 22.8 67.9 76.9 95.2 74.6 77.8<br />
Shareholder Equity:Advances (%) 24.0 321.8 315.0 25.8 19.5 15.0 17.7 18.6<br />
Equity/Assets (%) 13.1 41.2 39.8 14.0 12.6 11.3 11.0 11.9<br />
*Note: Financial figures for 2006 to 2008 were derived using the Old Mutual Implied Rate (OMIR), which<br />
may not reflect a true account due to variability of exchange rates during that period.<br />
26
EQUITY RESEARCH<br />
ZIMBABWE<br />
FOOD<br />
Staying ahead of the pack<br />
In the face of increasing competition in the local market,<br />
high operating costs, uncompetitive cost of capital and<br />
inconsistencies in government policy pronouncements<br />
relating to import duty and the Zim dollar, Dairibord has<br />
managed to defend its position, with market share across<br />
its product portfolio ranging above 50%. In Malawi, which<br />
management emphasised is a strategic investment, the<br />
company is successfully dealing with constraints including<br />
forex shortages and strikes which are disrupting business.<br />
• Lowest milk consumption in the region<br />
<strong>Zimbabwe</strong>'s consumption is still to recover to its peak<br />
of 25 litres per capita with current consumption at 8<br />
litres. It ranks at the bottom along with Malawi’s 5<br />
litres per capita. Consumption in other regional<br />
countries is much higher with Kenya at 100 litres,<br />
Uganda at 50 litres, South Africa at 56 litres and<br />
Zambia 10 litres.<br />
• New products expected to make a significant<br />
contribution<br />
Nutriplus and Froot Scoop which were introduced on<br />
the market towards the end of 2011 are expected to<br />
increase their contribution in FY <strong>2012</strong>. Targeted<br />
output and revenue for Nutriplus amounts to 400,000<br />
litres and US$ 460,000 per month respectively. Froot<br />
Scoop volume target amounts 40,000 litres per month<br />
against monthly revenues of US$ 116,000.<br />
• Buy recommendation maintained<br />
We remain long terms bulls on Dairibord, given its<br />
substantial asset base, aggressive management and<br />
the potentially compelling consumer story. We thus<br />
maintain our BUY call.<br />
BLOOMBERG: DZHL:ZH<br />
BUY<br />
Current price (USc) 17.0<br />
Target price (USc) 35.2<br />
Upside/Downside (%) 107.1<br />
Liquidity<br />
Market Cap (US$m) 60.5<br />
Shares (m) 356.0<br />
Free float (%) 57.7<br />
Ave. daily vol ('000) 304.6<br />
Share price performance<br />
6 Months (%) 2,100.0<br />
Relative change (%)* 0.0<br />
12 Months (%) 2,100.0<br />
Relative change (%)* 0.0<br />
*Relative to ZSE Industrial Index<br />
Financials (US$m) - FY 31 Dec 2011 <strong>2012</strong>F 2013F<br />
Turnover 96.0 118.1 139.3<br />
EBITDA 13.4 16.6 21.8<br />
Net finance income (0.4) (0.5) (0.5)<br />
Attributable earnings 7.1 9.5 13.0<br />
EPS (USc) 2.0 2.7 3.6<br />
DPS (USc) 0.4 0.6 0.8<br />
NAV/share (USc) 7.5 8.2 10.4<br />
Valuation Ratios<br />
PBV (x) 2.3 2.1 1.6<br />
PER (x) 8.6 6.3 4.7<br />
EV/EBITDA (x) 4.8 3.8 2.9<br />
EBITDA margin (%) 14.5 13.9 14.1<br />
Dividend Yield (%) 2.6 3.6 4.8<br />
Earnings Yield (%) 11.7 15.8 21.5<br />
Gearing (%) 9.2 7.3 5.3<br />
RoaA (%) 12.4 11.9 14.0<br />
RoaE (%) 16.4 16.0 19.3<br />
Dairibord-Price vs Volume<br />
35<br />
30<br />
25<br />
20<br />
15<br />
10<br />
5<br />
0<br />
Feb-09 Sep-09 Apr-10 Nov-10 Jun-11 Jan-12<br />
16.0<br />
14.0<br />
12.0<br />
10.0<br />
8.0<br />
6.0<br />
4.0<br />
2.0<br />
-<br />
STRENGTHS<br />
WEAKNESSES<br />
Quasi monopoly with strong brands Milk is a basic good and price sensitive<br />
Value added products Capacity utilisation levels still low at 40%<br />
Regional presence, Malawi<br />
Strong management team<br />
OPPORTUNITIES<br />
THREATS<br />
Continued regional expansion Cheap imports from SA<br />
Recovery of domestic consumption Prolonged time to recovery<br />
Growing domestic milk volumes <strong>Exchange</strong> rate risk in Malawi<br />
Recovery of farming sector High stockfeed prices<br />
Middle Price(US c)-LHS<br />
Total Volume(m)-RHS<br />
Source: IES<br />
27
Nature of business<br />
Dairibord Holdings specialises in the production of a range of products<br />
including beverages, milk and milk products, cordials, condiments, canned<br />
and processed foods, sauces, spreads and confectionery, which are marketed<br />
to the domestic and foreign markets. At its peak, Dairibord produced in the<br />
region of 80-100m litres of milk. Fully owned subsidiaries include a transport<br />
company, NFB Logistics. In Malawi, it has a 60:40 JV in Dairibord Malawi<br />
Limited which produces 4.5m litres of milk per annum.<br />
<strong>Overview</strong> of FY 2011 results<br />
Top line short of target but shows strong volume growth<br />
Revenue went up 28% to US$ 96.0m, falling short of the anticipated 39%<br />
growth on FY 2010. The top line was backed by a 20% growth in volumes to<br />
65.2m litres while higher average prices were realised driven by an<br />
improvement in the proportion of high value added products. Improved<br />
efficiencies drove a one percentage point increase in the operating profit<br />
margin to 11%, dispersing fears of a decline due to higher operating costs<br />
(fuel, utilities, labour). A loss from the associate, Charhons, amounting to<br />
US$ 512,000 was made as the unit continued to suffer from<br />
undercapitalisation. Net finance costs were limited to US$ 367,000,<br />
indicating a strong interest cover ratio of 29.6x up from 26.9x. PBT went up<br />
22% to US$ 10.0m, although a higher tax charge led to a lower increase of<br />
14% in the PAT to US$ 7.2m.<br />
DZL Shareholding - 31/12/10<br />
Shareholder # of Shares (m) %<br />
1 Serrapin Investments P/L 59.4 17.1%<br />
2 Old Mutual Life Assurance Co. Zim Ltd 52.1 15.0%<br />
3 Remo Nominees P/L 20.3 5.9%<br />
4 Scrimpton Investments P/L 15.0 4.3%<br />
5 Fed Nominees P/L 11.9 3.4%<br />
6 National Social Security Authority WICF 10.0 2.9%<br />
7 Remo Nominees P/L NNR 10.0 2.9%<br />
8 DZL Holdings Employee Share Trust 10.0 2.9%<br />
9 Barclays <strong>Zimbabwe</strong> Nominees P/L-NNR 10.0 2.9%<br />
10 Stanbic Nominees P/L 9.9 2.9%<br />
Strong balance sheet<br />
On the balance sheet, total assets increased by 19% to US$ 64.5m. The<br />
gearing ratio was well contained, declining from 10% in the prior period to<br />
8%. From US$ 5.4m for FY 2010, total borrowings increased to US$ 5.7m<br />
comprising US$ 1.4m in long term loans and US$ 4.3m in short term loans.<br />
The average all in cost of the loans is 10.6%. The group also accessed a US$<br />
4.0m 5 year facility with the PTA at an all in cost of 11%. Net cash flows<br />
generated from operations amounted to US$ 5.4m whilst the closing cash<br />
flow position was US$ 2.3m.<br />
High value added lines support outperformance of liquid milks and foods<br />
division over the beverages division<br />
In terms of divisional performance, the liquid milks registered 26% volume<br />
growth compared to a 32% revenue growth due to an increase in sales<br />
volumes of higher value added lines. The foods also registered a similar<br />
performance as volumes went up by 19% against a 38% growth in revenue.<br />
The late commissioning of the Cascade plant affected the performance of<br />
the beverages, which registered the least volume and revenue growth of 15%<br />
and 16% respectively. The logistics company registered a 31% volume growth<br />
against a 30% growth in revenue although it only accounted for 1% of group<br />
revenue.<br />
Milk supply shortage continues unabated<br />
Milk supply shortages remain a hurdle as current supply stands at 4.5m litres<br />
against an estimated demand of 7.5m litres. 1,816 tonnes of milk powder<br />
were imported for FY 2011 to supplement local supply, at landed prices of<br />
US$ 3,963/tonne. 755 tonnes were used at DZPL whilst 420 tonnes were used<br />
at Lyons, leaving a surplus of 641 tonnes. The group is carrying out several<br />
strategies to try and boost milk supply including a heifer importation<br />
scheme, resuscitation of dairy co-operatives and extension services to<br />
farmers. Funding options for these initiatives are being considered. Since<br />
1980 the group has helped to set up 10 dairy co-operatives which are<br />
currently not in full production but the infrastructure is still in place. It is<br />
hoped that the planned strategies will succeed in boosting milk supply.<br />
Outlook<br />
For FY <strong>2012</strong>, the group is targeting volume growth of 20%, revenue growth of<br />
at least 23% and a further growth in the operating profit margin to 12%.<br />
Management also expects its raw milk intake to grow by 6% against the NADF<br />
60%<br />
50%<br />
40%<br />
30%<br />
20%<br />
10%<br />
0%<br />
Divisional Volume Contribution(%)<br />
53%<br />
50% 49%<br />
36% 35%<br />
31%<br />
14% 16% 16%<br />
Liquid Milks Foods Beverages<br />
2009 2010 2011F<br />
28
national forecast increase of 5%. The group will,<br />
however, continue to import milk powders to<br />
compliment local raw milk supply. US$ 10.0m is targeted<br />
for capital expenditure for the current year in order to<br />
increase production capacity for value added lines,<br />
enhance distribution capacity and efficiencies, invest in<br />
cold chain facilities and milk supply development.<br />
Valuation and recommendation<br />
In valuing the counter, we used a DCF valuation. Our<br />
assumptions include an after tax cost of debt of<br />
8%, risk free rate of 12%, risk premium of 19% and<br />
beta of 0.9x. We arrive at an enterprise value of<br />
US$ 127.4m and implied equity value of US$<br />
123.9m, which translates to a US$ 0.35 share<br />
price. We remain long term bulls on Dairibord,<br />
given its substantial asset base, aggressive<br />
management and the compelling consumer story.<br />
BUY<br />
DZHL- 5 YEAR CGR COMPARISON<br />
31 DEC (US$m) 2006 2007 2008 2009 2010 2011 <strong>2012</strong>F 2013F<br />
Balance sheet<br />
Shareholders' equity 3.6 30.6 25.4 34.5 40.4 47.8 51.1 55.5<br />
Minority interests 0.1 0.6 1.2 1.1 1.2 0.9 0.9 0.9<br />
Total shareholders' funds 3.6 30.6 25.4 34.5 40.4 47.8 51.1 55.5<br />
Interest Bearing Debt 0.0 0.3 1.7 4.1 5.4 5.7 5.5 5.0<br />
Trade creditors 3.9 2.1 5.0 6.6 8.1 9.8 11.9 14.0<br />
Current Liabilities 4.6 2.5 5.5 6.6 8.5 11.0 15.4 18.5<br />
Total Liabilities and equity 8.2 33.4 32.6 45.2 54.2 64.5 71.9 79.0<br />
Fixed Assets 0.7 28.8 27.0 32.8 34.5 37.2 40.3 45.9<br />
Investments 0.9 1.7 0.6 1.4 0.8 0.2 0.3 0.3<br />
<strong>Stock</strong> - Trade net 2.8 1.5 3.0 5.6 9.9 11.9 14.6 17.2<br />
Debtors 3.0 1.0 1.8 4.5 7.3 11.4 14.0 11.9<br />
Cash at bank 0.8 0.4 0.2 1.0 1.7 2.3 2.7 3.7<br />
Current Assets 6.6 2.9 5.0 11.1 18.9 25.5 31.3 32.8<br />
Total Assets 8.2 33.4 32.6 45.2 54.2 64.5 71.9 79.0<br />
Income Statement<br />
Turnover 39.8 19.9 12.2 43.4 75.2 96.0 118.1 139.3<br />
Gross profit 14.2 7.1 4.3 13.9 23.9 30.7 37.8 46.0<br />
EBITDA 11.2 5.9 3.3 6.4 10.9 13.4 16.6 21.8<br />
Net finance income 0.1 - 0.0 (0.4) (0.4) (0.4) (0.5) (0.5)<br />
Profit before Tax 12.0 5.5 4.4 4.0 8.0 9.9 13.3 18.1<br />
Taxation 3.8 2.1 2.0 0.9 1.9 2.8 3.8 5.1<br />
Profit after Tax 8.1 3.4 2.4 3.1 6.1 7.1 9.5 13.0<br />
Minorities 0.0 0.0 0.0 (0.0) - - - -<br />
Attributable Income 8.1 3.4 2.4 3.1 6.1 7.1 9.5 13.0<br />
Weighted shares 311.2 311.2 311.2 356.0 353.9 353.9 353.9 353.9<br />
EPS (USc) 2.3 0.9 0.7 0.9 1.7 2.0 2.7 3.6<br />
Cash EPS (USc) 2.4 1.1 0.7 1.4 2.4 2.7 3.5 4.6<br />
DPS (USc) 0.4 0.0 - - - 0.4 0.6 0.8<br />
NAV per share (USc) 0.8 0.2 0.2 3.4 5.5 7.5 8.2 10.4<br />
Growth Ratios<br />
Sales growth (%) (34.24) (49.93) (38.97) 257.00 73.14 27.66 23.00 18.00<br />
Pre-interest profit growth (%) (33.40) (50.09) (38.97) 41.01 85.89 25.79 27.42 34.31<br />
Earnings growth (%) (38.82) (58.54) (28.23) 29.07 96.81 15.18 34.98 35.98<br />
Margins<br />
Gross margin (%) 35.7 35.7 35.7 32.0 31.8 32.0 32.0 33.0<br />
EBITDA margin (%) 28.2 29.6 27.0 14.7 14.5 13.9 14.1 15.6<br />
Pre-interest margin (%) 27.1 27.0 27.0 10.7 11.5 11.3 11.7 13.3<br />
Interest cover (times) n/a n/a n/a 10.6 21.3 29.6 26.7 39.2<br />
Pre-tax profit margin (%) 30.1 27.7 35.9 9.2 10.7 10.3 11.3 13.0<br />
*Note: Financial figures for 2006 to 2008 were derived using the Old Mutual Implied Rate (OMIR), which<br />
may not reflect a true account due to variability of exchange rates during that period.<br />
29
EQUITY RESEARCH<br />
ZIMBABWE<br />
BREWERIES/BEVERAGES<br />
Stronger growth emerging<br />
Delta continues to post a strong operating performance<br />
propelled by sturdy volume recovery across the group<br />
and margin expansion. The volume growth is on the back<br />
of strong economic growth underscoring the fundamental<br />
macro-economic changes which have taken place. Delta<br />
plans to disinvest from the remaining non-core<br />
businesses namely Megapak (51%) and Food & Industrial<br />
(49%) by end <strong>2012</strong>.<br />
• Dominant position<br />
Delta enjoys a dominant position in <strong>Zimbabwe</strong>,<br />
commanding approximately 96% of the beer market<br />
and about 92% of the sparkling beverages market.<br />
Management estimates that imported lagers<br />
constitute approximately 5% of which Delta brings in<br />
2%. The group aggressively markets its brands, and<br />
in so doing stimulates volume growth. Marketing<br />
costs are approximately 2% of revenues.<br />
• Progressive margin expansion<br />
Operational efficiencies have been enhanced with<br />
investment in new equipment setting the scene for<br />
sustained growth. Margins are expected to further<br />
expand on improved efficiencies, reduced<br />
maintenance costs, supply chain savings and an<br />
enhanced product mix.<br />
• Pristine balance sheet and strong cash generation<br />
Delta generates excellent cash flow, with<br />
approximately 60% of sales being for cash. As a<br />
consequence, the balance sheet continues to<br />
strengthen.<br />
• Robust profit growth at low risk<br />
The outlook for the group remains closely aligned<br />
with that of the country at large. Our two valuation<br />
methodologies, DCF and EV/Hl production point to a<br />
fair value for the group of US$ 1.3bn. BUY.<br />
Bloomberg: DELTA:ZH BUY<br />
Current price (USc) 70.0<br />
Target price (USc) 110.0<br />
Upside (%) 57.2<br />
Liquidity<br />
Market Cap (US$m) 836.6<br />
Shares (m) 1,195.1<br />
Free float (%) 39.5<br />
Ave. daily vol ('000) 554.1<br />
Share price performance<br />
6 Months (%) 2.2<br />
Relative change (%)* 1.4<br />
12 Months (%) 56.2<br />
Relative change (%)* 22.9<br />
*Relative to ZSE Industrial Index<br />
Financials (US$m) - FY 31 Mar <strong>2012</strong> 2013F 2014F<br />
Turnover 554.8 676.3 813.8<br />
EBITDA 118.7 150.0 186.8<br />
Net finance income (2.0) (2.7) (2.9)<br />
Attributable earnings 73.7 94.3 119.6<br />
EPS (USc) 4.4 6.2 7.9<br />
DPS (USc) 1.5 2.1 3.2<br />
NAV/share (USc) 17.4 22.1 28.8<br />
Valuation Ratios<br />
PBV (x) 4.0 3.2 2.4<br />
EV/EBITDA (x) 7.3 5.7 4.5<br />
PER (x) 15.7 11.3 8.9<br />
EV/Hl (US$) 124.8 109.0 95.8<br />
RoaA (%) 17.6 20.4 20.8<br />
RoaE (%) 28.9 34.9 34.2<br />
EBITDA Margin (%) 21.4 22.2 23.0<br />
Earnings Yield (%) 6.4 8.8 11.3<br />
Dividend Yield (%) 2.1 3.0 4.5<br />
Delta ‐ volume vs price<br />
100<br />
30<br />
80<br />
25<br />
60<br />
20<br />
15<br />
40<br />
10<br />
20<br />
5<br />
‐<br />
0<br />
<strong>May</strong>‐11 Aug‐11 Nov‐11 Feb‐12 <strong>May</strong>‐12<br />
Volume (m) RHS Price (USc) LHS<br />
Source: IES<br />
STRENGTHS<br />
WEAKNESSES<br />
Dominant position<br />
Low disposable incomes<br />
No exchange risk<br />
Weak macro economy<br />
Resurging volumes<br />
Frequent energy disruptions<br />
Strong parent company<br />
Leading brands, volumes up<br />
OPPORTUNITIES<br />
THREATS<br />
Stabilising economy<br />
Increase in excise taxes<br />
Recovery in public finances Commodity price shocks<br />
Aid inflows<br />
Disruptions to utilities<br />
Growth in local premium brands More aggressive competition<br />
30
Nature of business<br />
Delta is the largest manufacturer, distributor and marketer of beverages in<br />
<strong>Zimbabwe</strong>. The operating divisions within the group are: beverages<br />
(comprising Lager beer, sorghum (traditional) beer, sparkling beverages (SBs)<br />
and a related transport operation), a maltings business and Megapak (a 51-49<br />
venture with South Africa’s Nampak. The group also has a 30% shareholding in<br />
Afdis (a manufacturer, importer, distributor and marketer of branded wines<br />
and spirits), and a 49% holding in Schweppes <strong>Zimbabwe</strong>.<br />
The lager business has two breweries (in Harare and Bulawayo), which have a<br />
market share of 96%. Lion and Castle account for 65% to 70% of its<br />
production, but it also has its own brands: Zambezi, Bohlinger’s and Pilsener.<br />
The unit has an installed brewing capacity of 3.0m hl. Due to years of under<br />
utilisation and limited maintenance, current available capacity is 2.0m hl pa.<br />
Delta Shareholding - Dec 2011<br />
Shareholder No. shares (m) %<br />
1 SABMiller <strong>Zimbabwe</strong> B.V 234.0 18.1%<br />
2 Rainier Incorporated 193.1 16.4%<br />
3 Old Mutual Life Assurance 139.4 10.4%<br />
4 Barclays Zimbabw Nomine 157.9 9.1%<br />
5 Stanbic Nominees P/L NN 118.4 5.2%<br />
6 Old Mutual <strong>Zimbabwe</strong> Lim 84.6 4.2%<br />
7 Delta Employee Participat 27.5 2.4%<br />
8 Browning Investments NV 22.2 1.9%<br />
9 Fed Nominees P/L 17.4 1.8%<br />
10 Stanbic Nominees P/L NN 15.9 1.6%<br />
The traditional beer has 15 traditional sorghum breweries, which have a<br />
combined available capacity of 5.0m hl. Capacity utilisation averaged<br />
approximately 68% in FY <strong>2012</strong> and demand has remained strong.<br />
Sparkling beverages (SBs) capacity utilisation averaged 75% on the available<br />
capacity of 1.5m hl pa (total installed of 2.2m hl pa). The PET market is<br />
estimated at 5% and is expected to grow as the economy recovers.<br />
Delta revenue split<br />
Sorghum 25%<br />
SBs 28%<br />
<strong>Overview</strong> of FY <strong>2012</strong> results<br />
Delta posted a robust set of results showing attributable earnings of US$<br />
73.7m, up 39% y-o-y for eps of US 6.03c. The strong performance was driven<br />
by solid volume growth, margin expansion and a stronger performance by<br />
associates. Overall beverage volume grew 19% to 6.9m hl, supported by<br />
growth in lager (+23% to 2.0m hl), sparkling beverages (+26% to 1.5m hl),<br />
sorghum (+15% to 3.4m hl) and maheu (+4%). Plastic tonnage increased by<br />
24% to 7,196 tonnes anchored by the strong beverage volume growth. The<br />
strong volume growth was supported by investments in machinery, brands<br />
and capacity. Sales value grew ahead of volume growth at 36%. Operating<br />
margins widened to 20.5% from 19.5% driving EBITDA growth of 45%. This was<br />
on the back of improved efficiencies, competitive pricing, and improved<br />
product mix and supply chain management. Nonetheless, margins were<br />
dragged by the repairs and maintenance on re-commissioning of some<br />
decommissioned machinery due to the strong volume growth. A final dividend<br />
of US 1.25c a share was declared implying a dividend yield of 3.0% and cover<br />
of 3x.<br />
Cash generation remained strong with cash generated from operations of US$<br />
121.4m. Net cash inflow of US$ 90.2m represented a cash interest cover of<br />
34x. The balance sheet strengthened through this very strong operating<br />
performance. Capital expenditure of US$ 74.0m (mainly for capacity<br />
enhancement) resulted in a significantly expanded balance sheet, with<br />
shareholders funds up 27%. Delta closed the period with debt of US$ 81.4m of<br />
which US$ 60.0m was long term at an all in cost of approximately 7.4%. Net<br />
gearing remained manageable at 9.8% (FY 2011: 9.1%).<br />
Outlook<br />
Strong fundamentals to sustain sturdy operating performance<br />
Per capita consumption of circa 40 litres p.a. (including sorghum beer) is low<br />
in <strong>Zimbabwe</strong> by developing world standards suggesting tremendous growth<br />
potential off a low base. Stripping out sorghum based beers, the figure is<br />
approximately 11 litres p.a. Management anticipates volumes to reach 7.3m<br />
hl in FY 2013. As the group increases the total volume sold it further<br />
increases its efficiencies allowing it to keep competitive pricing on its<br />
products. The company states that for every 1% growth in GDP the company’s<br />
volumes can grow by a factor of 2.5x. According to the Ministry of Finance<br />
GDP is expected to grow at 9.4% in <strong>2012</strong>.<br />
4,500<br />
4,000<br />
3,500<br />
3,000<br />
2,500<br />
2,000<br />
1,500<br />
1,000<br />
500<br />
0<br />
Vol '000<br />
Hl<br />
Lagers 47%<br />
Source: Company, IES<br />
2005 2007 2009 2011 2013F<br />
Sorghum Lager Beer Soft Drinks<br />
31
Margin expansion<br />
We believe the company has solid opportunities to expand<br />
the operating margin as a result of the combination of a<br />
favorable mix shift to high end products, improved<br />
efficiencies, competitive pricing, reduced maintenance<br />
costs and supply chain savings.<br />
Strong cash flow<br />
Delta generates excellent cash flows. The strong cash flow<br />
provides management flexibility, as cash can be used for<br />
working capital, capital expenditure, cash dividends or<br />
share-buy backs. Capex for FY 2013 is expected at US$<br />
79.0m and capex/EBITDA is anticipated to recede to<br />
between 30% and 50% in the medium to long term. In our<br />
DELTA - 5 YEAR CGR COMPARISON<br />
view, the declining capex will enable the company<br />
to increase its dividend payout. The capex<br />
programmes will not only increase capacity but<br />
also improve production facilities and reduce costs.<br />
Valuation and Recommendation<br />
In our view, Delta has a compelling story with its<br />
pristine balance sheet, strong cashflows, and solid<br />
brands. There are high barriers to entry in this<br />
industry and Delta enjoys a dominant position with<br />
a solid distribution network. Ratings are<br />
undemanding at PER+1 of 9.0x and EV/production<br />
of US$ 124 versus PER of 20.0x and EV/production<br />
of US$ 250 for our comparative sample. We<br />
maintain our BUY rating.<br />
31 MARCH (US$m) 2007 2008 2009 2010 2011 <strong>2012</strong> 2013F 2014F<br />
Balance Sheet<br />
Shareholders' equity 8.1 10.0 110.0 159.2 207.9 263.9 343.3 425.2<br />
M inority interests 1.2 1.6 8.4 2.7 3.8 5.1 7.1 9.5<br />
Total shareholders' equity 10.1 13.5 155.7 184.7 234.4 296.3 383.1 475.5<br />
Interest Bearing Debt 0.2 0.0 0.5 15.0 24.2 81.4 79.1 75.9<br />
Trade creditors 8.0 10.4 22.8 36.3 88.5 89.4 96.4 99.0<br />
Current Liabilities 8.0 10.4 25.2 55.3 88.5 89.4 96.4 99.0<br />
Total Liabilities and equity 18.3 24.0 181.3 255.0 347.1 467.1 558.6 650.4<br />
Fixed Assets 1.3 0.1 130.7 162.4 227.0 268.5 333.5 398.5<br />
Investments 0.6 0.6 11.5 11.0 20.7 28.1 29.5 32.1<br />
<strong>Stock</strong> - Trade net 0.0 0.0 28.5 51.4 67.9 77.6 85.2 92.2<br />
Debtors 14.5 18.5 4.6 14.3 26.4 37.3 50.1 63.3<br />
Cash at bank 0.0 1.6 2.9 7.3 5.2 55.6 62.8 74.3<br />
Current Assets 16.4 23.3 39.1 81.6 99.4 170.5 198.1 229.8<br />
Total Assets 18.3 24.0 181.3 255.0 347.1 467.1 561.1 660.4<br />
Income Statement<br />
Turnover 120.0 121.9 104.2 281.3 408.0 554.8 676.3 813.8<br />
EBITDA 46.5 62.1 41.3 49.1 81.7 118.7 150.0 186.8<br />
Associate income 1.0 0.6 -0.1 -0.6 0.9 1.7 2.4 3.4<br />
Profit before Tax 86.3 161.0 7.8 41.9 70.1 99.3 124.2 157.4<br />
Taxation 25.8 49.0 2.4 2.2 15.9 24.1 27.9 35.4<br />
Profit after Tax 60.6 112.0 5.4 39.7 54.1 75.2 96.2 122.0<br />
Minorities 7.6 15.5 0.3 0.7 1.1 1.5 2.0 2.4<br />
Attributable Income 53.0 96.5 5.1 39.0 53.0 73.7 94.3 119.6<br />
W eighted shares<br />
EPS (USc) 4.4 8.1 0.4 3.3 4.4 6.2 7.9 10.0<br />
Cash EPS (USc) 4.8 10.6 2.9 3.4 5.6 7.9 10.0 12.6<br />
DPS (USc) 0.4 0.4 0.0 0.0 1.5 2.1 3.2 4.8<br />
NAV per share (USc) 0.7 0.8 9.2 13.4 17.4 22.1 28.8 35.7<br />
Dividend yield (%) 0.5 0.6 0.0 0.0 2.1 3.0 4.5 6.8<br />
Growth Ratios<br />
Sales growth (%) (36.2) 1.6 (14.5) 169.9 45.0 36.0 21.9 20.3<br />
Pre-interest profit growth (%) 4.8 33.8 (80.1) 214.8 75.8 44.0 26.8 25.6<br />
Earnings growth (%) 59.4 82.1 (94.7) 665.4 36.1 39.1 27.8 26.9<br />
Margins<br />
Gross margin incl finance chgs ( 60.0 62.0 60.0 0.0 0.0 0.0 0.0 0.0<br />
EBITDA margin (%) 38.7 50.9 39.6 17.5 20.0 21.4 22.2 23.0<br />
Pre-interest margin (%) 38.7 50.9 11.8 13.8 16.7 17.7 18.4 19.2<br />
Interest cover (times) n/a 8.6 2.7 49.5 34.4 37.1 43.6 61.5<br />
Pre-tax profit margin (%) 72.0 132.0 7.5 14.9 17.2 17.9 18.4 19.3<br />
*Note: Financial figures for 2007 to 2009 were derived using the Old Mutual Implied Rate (OMIR),<br />
which may not reflect a true account due to variability of exchange rates during that period.<br />
32
EQUITY RESEARCH<br />
ZIMBABWE<br />
TELECOMS<br />
Virtually compelling<br />
Econet is the dominant player in the domestic telecoms<br />
market, commanding 70% of the mobile telecoms industry<br />
with a subscriber base of 6.4m. Econet has a head start over<br />
other players, in terms of penetration in data, which is<br />
expected to be the next growth avenue. To us, this secures<br />
high revenue visibility. In our view, the weak competition<br />
provides excellent growth prospects for Econet.<br />
• Strong cash generation<br />
Cash generation was solid with EBITDA/OCF of 97%.<br />
Given the high cash generation, Econet will fund most<br />
of its capex requirements from internal resources and<br />
increase dividend pay outs post peak capex funding.<br />
• Margins and ARPUs remain healthy<br />
Although EBITDA margins eased to 47% from 49%,<br />
negatively impacted by the increased cost of the<br />
network and fuel, they remain healthy and higher than<br />
regional peers of approximately 45%. ARPUs increased<br />
6% to US$ 10.33. Nonetheless, as the expansion unfolds<br />
we expect EBITDA margins to ease as ARPU’s decrease<br />
and costs increase. Furthermore, Econet has also<br />
entered into the handset sale market.<br />
• Solid infrastructure to support future growth<br />
In our view, Econet has a robust transmission backbone<br />
given its access to optic fibre. The company has<br />
invested a total of approximately US$ 614.0m in capex<br />
since 2009. The introduction of new products should<br />
continue to attract revenues for the company as well as<br />
increasing its subscriber base.<br />
• Valuations remain compelling<br />
We have valued Econet at US 664c a share and believe<br />
that the market is ignoring the company’s dominant<br />
market share and the tremendous potential in the<br />
sector. We believe that the share has been oversold<br />
and current levels provide a good entry point. Buy into<br />
current weakness.<br />
BLOOMBERG: ECWH:ZH<br />
BUY<br />
Current price (USc) 400.0<br />
Target price (USc) 604.0<br />
Upside/Downside (%) 51.0<br />
Liquidity<br />
Market Cap (US$m) 677.7<br />
Shares (m) 169.4<br />
Free float (%) 17.6<br />
Ave. daily vol ('000) 105.8<br />
Share price performance<br />
6 Months (%) 2.1<br />
Relative change (%)* (13.1)<br />
12 Months (%) 0.2<br />
Relative change (%)* (11.9)<br />
*Relative to ZSE Industrial Index<br />
Financials (US$m) - FY 28 Feb <strong>2012</strong> 2013F 2014F<br />
Turnover 611.1 693.6 780.3<br />
EBITDA 290.9 328.3 366.2<br />
Net finance income (4.4) (7.2) (8.1)<br />
Attributable earnings 165.7 196.2 225.1<br />
EPS (USc) 97.8 115.8 132.9<br />
NAV/share (USc) 183.1 260.3 348.9<br />
DPS (USc) 11.9 38.6 44.3<br />
Valuation Ratios<br />
Subscribers' 000 6,409.0 7,063.9 7,539.9<br />
PER (X) 4.1 3.5 3.0<br />
PBV (X) 2.2 1.5 1.1<br />
EV/EBITDA (x) 2.8 2.5 2.2<br />
ARPU (US$) 7.9 8.2 8.6<br />
EV/Subscriber (US$) 128.6 116.6 109.3<br />
EBITDA margin (%) 47.6 47.3 46.9<br />
Earnings Yield (%) 24.5 28.9 33.2<br />
Dividend Yield (%) 3.0 9.6 11.1<br />
Gearing (%) 38.5 31.9 11.4<br />
RoaA (%) 22.9 22.2 22.6<br />
RoaE (%) 49.7 43.9 38.2<br />
Econet - volume vs price<br />
600<br />
500<br />
400<br />
300<br />
200<br />
100<br />
-<br />
<strong>May</strong>-11 Sep-11 Jan-12 <strong>May</strong>-12<br />
Volume (m) RHS<br />
Price (USc) LHS<br />
2<br />
1<br />
0<br />
Source: m IES<br />
STRENGTHS<br />
Market leader<br />
Strong brand locally and regionally<br />
High tarriffs<br />
Economies of scale<br />
3G network in place<br />
OPPORTUNITIES<br />
New products/services<br />
Weak competition: Telecel/NetOne<br />
Mobile banking<br />
Expansion of data services<br />
Economic recovery<br />
WEAKNESSES<br />
Low disposable incomes<br />
Energy disruptions<br />
High gearing<br />
THREATS<br />
Entry of stronger players eg. MTN<br />
Price wars<br />
Resurgence of beer market<br />
as a percent of wallet<br />
33
Nature of business<br />
Econet Wireless (Private) Limited is a communications and technology<br />
company. It is the largest GSM mobile operator in <strong>Zimbabwe</strong> with a<br />
market share of over 69% and more than 5.0m subscribers and 400 base<br />
stations. Econet offers a unique blend of branded subscriber and pre-paid<br />
mobile phone services. Econet also owns Data Control and Systems (51%)<br />
trading as Ecoweb, one of the largest ISPs in <strong>Zimbabwe</strong>. This is supported<br />
by Econet’s wireless infrastructure and earth station, which also provides<br />
direct international dial access to more than 244 countries and territories<br />
worldwide. The company also has a 51% stake in Transaction Processing<br />
Systems (Pvt) Ltd, a provider of financial transaction switching, point of<br />
sale and other value added services that look to exploit the convergence<br />
of banking, IT and telecoms. Econet also owns 69% of Mutare Bottling<br />
Company.<br />
<strong>Overview</strong> of FY <strong>2012</strong> results<br />
For FY <strong>2012</strong>, Econet released a solid set of results which were broadly in<br />
line with our expectations. The 24% revenue growth was supported by a<br />
16% increase in subscribers to 6.4m and strong growth in voice and data.<br />
ARPU increased 6% to US$ 10.33 on increased usage. Econet maintained<br />
its dominant position commanding a market share of over 70%. Local<br />
mobile penetration improved to 74%. Subscribers connected to broadband<br />
were in excess of 2.0m while the new service EcoCash closed the period<br />
with approximately 1.4m subscribers.<br />
Econet Shareholding - Jan 2011<br />
Shareholding No. shares %<br />
1 Stanbic Nominees (Pvt) Ltd ( 9.0 10.7%<br />
2 Austin ECO Holdings Limited 9.0 7.8%<br />
3 Old Mutual Life Assurance Lif 8.5 5.3%<br />
4 Econet Wireless Holdings, 7.2 4.7%<br />
5 Barclays <strong>Zimbabwe</strong> Nominees 6.1 3.3%<br />
6 Old Mutual <strong>Zimbabwe</strong> Ltd 3.6 3.1%<br />
7 Barclays <strong>Zimbabwe</strong> Nominees 3.2 2.6%<br />
8 Barclays <strong>Zimbabwe</strong> Nominees 2.4 2.4%<br />
9 Northunderland Investments 2.2 2.4%<br />
10 Barclays <strong>Zimbabwe</strong> Nominees 2.0 2.4%<br />
* excluding class A shares<br />
Interconnet &<br />
Roaming 15%<br />
Revenue contribution<br />
Other 4%<br />
Healthy margins maintained<br />
EBITDA margins eased to 47.6% from 49.0% negatively impacted by the<br />
increased network expenses. No final dividend was declared as the<br />
company is in the final stages of concluding a syndicated US$ 307.0m loan<br />
facility. The company bought back approximately 6.8m shares at US$<br />
28.5m during the year.<br />
Data & SMS 13%<br />
Airtime & Supscriptions 68%<br />
Non payment of interconnet fees negatively impacted cash flows<br />
Cash generation remained strong with EBITDA/OCF of 115%. Capex was<br />
US$ 184.0m and gearing improved to 65% from 86%. EBITDA interest<br />
coverage was high at 35.9x, although finance charges increased 12% as the<br />
company reached peak funding. Management state that future expansion<br />
shall be funded mostly from internally generated cashflows. The nonpayment<br />
of interconnect fees also negatively impacted Econet as<br />
outstanding interconnect fees increased to approximately US$ 85.0m.<br />
Included in the current liabilities is a short-term loan (vendor financing<br />
facility, which we estimate to be approximately US$ 144.0m) that is due<br />
to be restructured as part of the US$ 307.0m syndicated loan facility.<br />
Outlook<br />
Demand for voice remains strong and there is immense potential for data.<br />
National penetration is expected to reach 100% by 2015 from the current<br />
74%. Econet is well positioned given its dominant position and weak<br />
competition. The focus for Econet will be on innovation, improving the<br />
quality of service and cost containment. We anticipate increased dividend<br />
payouts once the company is post its peak funding. Management state<br />
that ARPUs and margins will be defended at U$ 10 and 49%, respectively.<br />
Total Econet<br />
subscribers'<br />
9,000<br />
000<br />
7,500<br />
6,000<br />
4,500<br />
3,000<br />
1,500<br />
0<br />
Subscribers and penetration<br />
2007 2008 2009 2010 2011 <strong>2012</strong> 2013F 2014F<br />
Penetration<br />
100%<br />
80%<br />
60%<br />
40%<br />
20%<br />
0%<br />
Valuation and Recommendation<br />
Econet remains a great company and ratings are undemanding at<br />
EV/Subscriber of US$ 123 against a regional peer average of<br />
approximately US$ 214, EV/EBITDA 2.7x and PER+1 of 3.9x versus a<br />
regional average of 10.7x. We maintain our BUY recommendation.<br />
Econet Subscribers<br />
Penetration<br />
Source: IES, company reports<br />
34
ECONET - 5 YEAR CGR COMPARISON<br />
28 FEBRUARY (US$m) 2007 2008 2009 2010 2011 <strong>2012</strong> 2013F 2014F<br />
Balance Sheet<br />
Shareholders' equity 49.2 61.3 81.2 163.2 286.7 379.9 513.6 663.7<br />
Minority interests 0.0 0.2 5.7 2.3 2.8 2.8 2.9 2.9<br />
Total shareholders' equity 69.7 81.1 127.2 201.2 335.1 453.5 562.4 703.3<br />
Interest Bearing Debt 0.6 0.0 9.1 138.7 240.9 247.0 291.5 240.9<br />
Trade creditors 1.3 1.7 40.0 14.4 53.9 101.9 92.5 83.3<br />
Current Liabilities 3.1 1.8 40.1 52.8 60.7 112.0 101.6 93.6<br />
Total Liabilities and equity 73.4 82.9 176.4 392.7 636.6 812.4 955.4 1,037.9<br />
Fixed Assets 54.2 38.5 134.4 267.5 498.9 561.7 601.7 641.7<br />
Investments 15.7 42.8 13.3 0.0 31.1 9.0 9.4 10.4<br />
<strong>Stock</strong> - Trade net 0.1 0.2 25.3 8.7 33.6 110.0 168.5 189.6<br />
Debtors 1.2 1.2 0.1 30.5 0.5 0.8 0.9 1.3<br />
Cash at bank 0.2 0.1 0.1 13.9 34.7 100.8 127.4 165.2<br />
Current Assets 3.0 1.5 25.6 53.2 68.9 211.9 297.4 357.3<br />
Total Assets 73.4 82.9 176.4 392.7 636.6 812.4 955.4 1,037.9<br />
Income Statement<br />
Turnover 34.6 21.4 87.9 362.8 493.5 611.1 693.6 780.3<br />
EBITDA 16.1 6.1 26.6 179.3 242.7 290.9 328.3 366.2<br />
Associate income 2.5 8.4 (1.1) 1.9 0.0 2.8 3.3 3.9<br />
Profit before Tax 22.3 58.3 3.1 148.1 196.5 239.1 261.6 300.2<br />
Taxation 5.9 11.7 5.1 34.9 55.5 73.4 65.4 75.0<br />
Profit after Tax 16.4 46.6 (2.1) 113.2 141.0 165.7 196.2 225.1<br />
Minorities 0.0 0.0 0.1 (1.4) 0.5 0.0 0.0 0.0<br />
Attributable Income 16.4 46.6 (2.2) 114.6 140.4 165.7 196.2 225.1<br />
Weighted shares 169.4 169.4 169.4<br />
EPS (USc) 9.7 27.5 (1.3) 67.7 82.9 97.8 115.8 132.9<br />
Cash EPS (USc) 10.2 27.8 9.6 78.3 105.9 125.3 145.2 164.2<br />
DPS (USc) 3.2 0.8 0.0 22.6 12.0 11.9 38.6 44.3<br />
NAV per share (USc) 1.0 3.0 (1.3) 73.9 126.1 183.1 260.3 348.9<br />
Growth Ratios<br />
Sales growth (%) 8.7 (38.1) 310.4 312.5 36.0 23.8 13.5 12.5<br />
Pre-interest profit growth (%) (3.4) (63.1) 44.6 1,850.5 28.8 20.0 13.9 12.4<br />
Earnings growth (%) 32.8 184.5 (104.7) (5,282.6) 22.5 18.0 18.4 14.7<br />
Margins<br />
Gross margin incl finance chgs (%) 76.6 84.0 78.6 80.0 80.0 80.8 80.8 80.8<br />
EBITDA margin (%) 46.5 28.2 30.2 49.4 49.2 47.6 47.3 46.9<br />
Pre-interest margin (%) 43.9 26.2 9.2 43.6 41.3 40.0 40.2 40.1<br />
Interest cover (times) n/a 1.2 9.1 35.7 28.1 30.2 13.8 18.6<br />
Pre-tax profit margin (%) 64.5 272.0 3.5 40.8 39.8 39.1 37.7 38.5<br />
*Note: Financial figures for 2007 to 2009 were derived using the Old Mutual Implied Rate (OMIR), which may not reflect a<br />
account due to variability of exchange rates during that period.<br />
35
EQUITY RESEARCH<br />
ZIMBABWE<br />
AGRICULTURE<br />
Adding on to its sweetness<br />
The USDA estimates that <strong>Zimbabwe</strong>’s sugar output in<br />
<strong>2012</strong>/13 will increase by 16% to 430,000mt from<br />
372,000mt in the 2011/12 season on the back of an<br />
expected 6% increase in the area harvested to<br />
37,500ha, improvement in sugarcane yields and<br />
enhanced efficiencies following significant<br />
investments. Hippo Valley, a significant player in the<br />
country’s sugar industry, is poised to contribute<br />
significantly to this increase as it recently undertook<br />
several initiatives to boost production.<br />
• Still on positive growth trajectory<br />
Hippo has undertaken projects including mill<br />
refurbishment, to re-establish cane supply and<br />
sugar milling capacity utilisation. We expect this<br />
to significantly improve its total sugar output<br />
and yield per hectare beyond 300,000 tonnes<br />
and 110 tonnes/ha respectively.<br />
• Recapitalisation of out growers a booster<br />
We expect cane deliveries to the mill from out<br />
growers to improve in the long term on the back<br />
of the European Union National Sugar<br />
Adaptation Strategy (NSAS). The increased<br />
deliveries are likely to be coupled with<br />
improved quality due to availability and early<br />
application of all necessary fertilisers and<br />
herbicides.<br />
• Valuation<br />
In valuing Hippo we used a relative comparison,<br />
by taking an average of the P/NAV and P/Sales<br />
ratios for regional sugar companies against FY<br />
<strong>2012</strong> forecasts for Hippo. We derive a target<br />
price of US$ 1.23 and recommend investors.<br />
HOLD.<br />
Hippo - volume vs price<br />
200<br />
150<br />
100<br />
50<br />
0<br />
Mar-09 Mar-10 Mar-11 Mar-12<br />
6.0<br />
5.0<br />
4.0<br />
3.0<br />
2.0<br />
1.0<br />
-<br />
BLOOMBERG: HIPPO:ZH<br />
HOLD<br />
Current price (USc) 95.0<br />
Target price (USc) 122.5<br />
Upside/Downside (%) 29.0<br />
Liquidity<br />
Market Cap (US$m) 183.4<br />
Shares (m) 193.0<br />
Free float (%) 19.7<br />
Ave. daily vol ('000) 29.6<br />
Share price performance<br />
6 Months (%) 33.3<br />
Relative change (%)* 39.4<br />
12 Months (%) (13.8)<br />
Relative change (%)* 0.7<br />
*Relative to ZSE Industrial Index<br />
Financials (US$m) - FY 30 Mar 2011 <strong>2012</strong>F 2013F<br />
Turnover 101.5 150.3 165.3<br />
EBITDA 12.2 21.0 29.8<br />
Net finance income 3.7 2.8 1.3<br />
Attributable earnings 8.8 18.7 29.3<br />
EPS (USc) 4.6 9.7 15.2<br />
DPS (USc) 0.0 0.0 0.0<br />
NAV/share (USc) 91.4 101.1 116.3<br />
Valuation Ratios<br />
PBV (x) 1.0 0.9 0.8<br />
PER (x) 20.9 9.8 6.3<br />
EV/EBITDA (x) 8.7 5.0 3.5<br />
EBITDA margin (%) 28.3 12.0 14.0<br />
Dividend Yield (%) na na na<br />
Earnings Yield (%) 4.8 10.2 16.0<br />
Gearing (%) 7.8 16.4 8.6<br />
RoaA (%) 9.4 3.0 5.8<br />
RoaE (%) 11.2 3.9 7.8<br />
STRENGTHS<br />
WEAKNESSES<br />
European Union support of the local sugar<br />
industry<br />
Dependent on favourable weather<br />
patterns<br />
Susceptible to commodities price<br />
High sugar recoveries<br />
movement<br />
Historically a low cost producer<br />
Low quality sugar production<br />
A return to pricing based on fundamentals Power disruptions<br />
OPPORTUNITIES<br />
THREATS<br />
Successful relaunch of outgrower scheme<br />
will boost prod<br />
The land scenario still remains a<br />
contentious issue<br />
Improved quality of sugar to fetch higher<br />
prices<br />
Slow economic growth<br />
Increase in sugar production<br />
Low disposable incomes<br />
Lack of adequate liquidity in the<br />
Increased production of by-products market<br />
Volume (m) RHS<br />
Middle Price (US c)-LHS<br />
Source: IES<br />
36
Nature of business<br />
Hippo Valley grows sugar cane on 12,300ha of arable land and has a<br />
50% stake in the 442ha Mkwasine Sugar Estates, which engages in the<br />
growing of sugar cane and other agricultural operations. Cane<br />
production normally totals in the region of 1.4m tonnes per annum at<br />
an average yield of 112t per hectare. Hippo also has a 33.3% stake in<br />
Sugar Industries Ltd, the sole packer and distributor of refined sugar<br />
in Botswana and a 49% stake in NCP Distillers, which is engaged in<br />
the conversion of molasses into alcohol. The distillery uses up to<br />
17,000 tonnes of the 70,000 tonnes of molasses produced annually by<br />
the mill. Other interests include a 50% stake in <strong>Zimbabwe</strong> Sugar Sales<br />
Ltd a sugar broking entity and Chiredzi Township Ltd that develops<br />
and sells township stands.<br />
<strong>Overview</strong> of H1 <strong>2012</strong> results<br />
An improved set of results<br />
For H1 <strong>2012</strong>, Hippo Valley posted a solid set of results propelled by<br />
improved margins and increased sugar production. Sugar production<br />
increased 80% to 118,654 tonnes and sugar recoveries were 85.6% at<br />
a cane-to-sugar ratio of 8.0x. We estimate that EBITDA margins<br />
widened to approximately 37.7% from 18.4% on improved efficiencies<br />
as a result of the extensive mill maintenance and refurbishment<br />
programme undertaken over the last two off-crops. Cash flows were<br />
strong as the company generated US$ 17.1m from operations. Net<br />
gearing improved to 13.4% from 21.2% at year-end.<br />
Sugar recoveries to go beyond 90%<br />
Historically, cane production totalled in the region of 1.3m tonnes<br />
per annum at an average yield of 112 tonnes per ha, whilst the<br />
highest sugar production was 297,000 tonnes achieved in 1997.<br />
Following the refurbishment, the mill is now crushing 400 tonnes of<br />
cane per hour, which should see greater throughput and sugar<br />
recoveries. We expect sugar recoveries to go beyond 90%.<br />
Outlook<br />
Sugar production expected to increase<br />
The company continues to provide inputs and extension services to<br />
third party cane growers so as to enhance cane production and<br />
deliveries to the mill. Sugar production is expected to improve and<br />
the company aims to restore production levels to the installed<br />
capacity of 300,000 tonnes.<br />
Hippo Shareholding - 30/12/11<br />
Shareholder<br />
# of Shares (m) of Total<br />
1 Triangle Sugar Corporation Limited, 97.1 50.3%<br />
2 Old Mutual Life Assurance Co. Zim Ltd 29.3 15.2%<br />
3 Tate and Lyle Holland BV 19.3 10.0%<br />
4 NSSA 5.0 2.6%<br />
5 Old Mutual <strong>Zimbabwe</strong> Limited 4.1 2.1%<br />
6 Stanbic Nominees (Pvt) Ltd 3.9 2.0%<br />
7 Barclays <strong>Zimbabwe</strong> Nominees (Pvt) Ltd 3.5 1.8%<br />
8 Datvest Nominees (Pvt) Ltd 1.7 0.9%<br />
9 Barclays <strong>Zimbabwe</strong> Nominees (Pvt) Ltd 1.3 0.7%<br />
10 Mining Industry Pension Fund 1.2 0.6%<br />
Hippo Valley H1 <strong>2012</strong> results<br />
Income Statement (US$ '000) H1 2011 H1 <strong>2012</strong> % change<br />
Turnover 39,000.0 70,015.0 79.5<br />
EBITDA 7,182.0 26,412.0 267.8<br />
PBIT 8,847.0 21,152.0 139.1<br />
Net finance income (1,812.0) (3,578.0) 97.5<br />
Share of associate 615.0 843.0 37.1<br />
PBT 7,650.0 18,417.0 140.7<br />
Attributable earnings 7,690.0 13,712.0 78.3<br />
EPS (USc) 4.00 7.10 77.5<br />
Balance Sheet (US$ '000) FY 2011<br />
Total Assets 310,295.0 350,143.0 12.8<br />
NAV 176,431.0 189,849.0 7.6<br />
Current Assets 83,108.0 121,135.0 45.8<br />
Current Liabilities 69,230.0 91,629.0 32.4<br />
Current ratio 1.2 1.3 10.1<br />
Cash flow (US$ '000) H1 2011<br />
Operating activities (2,151.0) 17,097.0 (894.8)<br />
Investing activities (13,783.0) (5,043.0) (63.4)<br />
Financing activities 32,751.0 5,867.0 (82.1)<br />
For FY <strong>2012</strong>, sugar production is expected to increase by 26% y-o-y to<br />
165,000 tonnes. Longer-term, the completion of the Tokwe Mukosi<br />
dam will result in increased production of sugarcane, raw & refined<br />
sugar, and maximise beneficiation to by products.<br />
Domestic consumption on the rise<br />
Domestic demand is also increasing, the USDA estimates that total<br />
local sugar consumption in 2011/12 season reached 280,000mt and is<br />
forecast to remain firm at 285,000mt in the <strong>2012</strong>/13 marketing<br />
season. Per capita consumption is estimated at 24.6kg, with the<br />
consumption pattern influenced by availability rather than price.<br />
Valuation and recommendation<br />
In valuing Hippo we used relative comparison, by taking an average<br />
of the P/NAV and P/Sales ratios for regional sugar companies against<br />
FY <strong>2012</strong> forecasts for Hippo. We derive a target price of US$ 1.23 and<br />
recommend investors HOLD.<br />
37
HIPPO - 5 YEAR CGR COMPARISON<br />
31 MAR (US$m) 2006 2007 2008 2009 2010 2011 <strong>2012</strong>F 2013F<br />
Balance sheet<br />
Shareholders' equity 114.9 36.8 143.1 143.8 167.5 176.4 195.2 224.5<br />
Deffered tax 42.2 13.7 57.0 57.8 52.5 53.1 53.1 53.1<br />
Total shareholders' funds 157.1 50.4 200.1 201.6 219.9 229.5 248.3 277.6<br />
Interest Bearing Debt 1.5 0.6 2.8 3.5 19.7 44.9 34.2 12.6<br />
Trade creditors 2.3 0.8 10.1 9.3 21.6 24.9 30.9 34.0<br />
Current Liabilities 3.0 1.5 22.4 24.3 36.0 35.8 48.3 48.7<br />
Total Liabilities and equity 161.6 52.5 225.3 229.5 275.6 310.3 330.8 338.9<br />
Fixed Assets 150.7 48.1 189.6 193.1 183.2 194.4 196.9 199.4<br />
Investments 2.6 - - 18.5 53.7 29.5 - -<br />
<strong>Stock</strong> - Trade net 2.5 2.5 18.5 - - 37.3 63.4 69.7<br />
Debtors 1.1 0.7 1.5 1.5 11.0 11.0 16.3 17.9<br />
Cash at bank 0.5 0.2 3.7 3.7 2.4 7.4 12.9 7.2<br />
Current Assets 8.1 4.2 34.1 15.6 36.2 83.5 131.0 136.6<br />
Total Assets 161.6 52.5 225.3 229.5 275.6 310.3 330.8 338.9<br />
Income Statement<br />
Turnover 51.7 24.6 11.4 58.9 64.9 101.5 150.3 165.3<br />
Gross profit (2.4) (1.3) (3.7) 39.9 18.4 41.3 65.6 76.3<br />
EBITDA 17.7 17.0 9.2 24.9 18.4 12.2 21.0 29.8<br />
Net finance income 1.8 0.4 0.1 0.5 0.8 3.7 2.8 1.3<br />
Profit before Tax 15.7 16.0 9.5 17.2 18.8 9.6 20.1 30.8<br />
Taxation 1.0 1.0 3.3 0.5 0.3 0.9 1.3 1.5<br />
Profit after Tax 11.2 11.0 6.2 21.2 23.6 8.8 18.7 29.3<br />
Minorities n/a n/a n/a n/a n/a n/a n/a n/a<br />
Attributable Income 11.2 11.0 6.2 21.2 23.6 8.8 18.7 29.3<br />
Weighted shares 192.9 193.0 193.0 193.0 193.0 193.0 193.0 193.0<br />
EPS (USc) 5.8 5.7 3.2 11.0 12.3 4.6 9.7 15.2<br />
Cash EPS (USc) 8.1 8.1 3.2 12.9 14.9 4.6 9.7 15.2<br />
DPS (USc) - - - - - - - -<br />
NAV per share (USc) 59.5 19.0 74.2 74.5 86.8 91.4 101.1 116.3<br />
Growth Ratios<br />
Sales growth (%) (51.68) (52.39) (53.84) 418.37 10.12 56.45 48.04 10.00<br />
Pre-interest profit growth (%) (73.38) (1.70) (43.80) 243.07 11.59 (62.81) 113.17 56.25<br />
Earnings growth (%) (73.38) (1.70) (43.80) 243.07 11.59 (62.81) 113.17 56.25<br />
Margins<br />
Gross margin (%) - 4.6 - 5.3 - 32.6 67.7 28.3 40.6 43.6 46.2<br />
EBITDA margin (%) 34.2 68.8 81.0 42.2 28.3 12.0 14.0 18.0<br />
Pre-interest margin (%) 30.3 64.8 83.3 29.2 29.0 9.5 13.4 18.6<br />
Interest cover (times) 9.4 36.9 115.6 32.5 24.5 3.3 8.3 26.6<br />
Pre-tax profit margin (%) 30.3 64.8 83.3 29.2 29.0 9.5 13.4 18.6<br />
*Note: Financial figures for 2006 to 2008 were derived using the Old Mutual Implied Rate (OMIR), which<br />
may not reflect a true account due to variability of exchange rates during that period.<br />
38
EQUITY RESEARCH<br />
ZIMBABWE<br />
FMCG/LEISURE<br />
Full steam ahead<br />
Due to its orientation towards FMCGs, Innscor’s business<br />
is generally not very capital intensive. As a result, cash<br />
generation is strong and return on assets and capital<br />
employed high. Increased efficiencies and tight working<br />
capital management continue to drive profitability. In our<br />
view, the stable environment provides an opportunity for<br />
the group to unbundle and unlock value to shareholders.<br />
• Robust performance<br />
Innscor reported an impressive set of interims<br />
showing attributable earnings of US$ 22.5m (FY 2011<br />
US$ 26.1m), up 59% y-o-y. The strong performance<br />
was anchored by increased volumes and efficiencies<br />
which resulted in enhanced margins.<br />
• Strong cash generation<br />
Innscor has unparalleled cash generation abilities in<br />
fast foods and retail, which provide capacity for<br />
growth, through organic expansion, acquisitions,<br />
adding new brands and entering new markets.<br />
• Earnings leverage from franchise system<br />
Fast Foods and retail outlets operate as franchise<br />
units, although the majority are owned by Innscor.<br />
Earnings leveraged on a strong franchise system can<br />
provide significant earnings momentum as franchise<br />
income outstrips the fixed nature of the franchise<br />
support system.<br />
• Valuation attractive<br />
In our view, Innscor’s valuation is attractive<br />
considering its impressive growth prospects and the<br />
defensive nature of its earnings. Innscor is dominant<br />
in its businesses and we expect the earnings growth<br />
rate to improve substantially with the improved<br />
economic climate. Buy.<br />
BLOOMBERG: INAF:ZH<br />
BUY<br />
Current price (USc) 58.0<br />
Target price (USc) 92.4<br />
Upside/Downside (%) 59.3<br />
Liquidity<br />
Market Cap (US$m) 314.0<br />
Shares (m) 541.3<br />
Free float (%) 34.4<br />
Ave. daily vol ('000) 178.4<br />
Share price performance<br />
6 Months (%) (10.8)<br />
Relative change (%)* 1.3<br />
12 Months (%) (14.7)<br />
Relative change (%)* 1.5<br />
*Relative to ZSE Industrial Index<br />
Financials (US$m) - FY 30 Jun 2011 <strong>2012</strong>F 2013F<br />
Turnover 516.1 637.4 777.7<br />
EBITDA 47.7 77.5 101.9<br />
Attributable earnings 26.1 38.6 52.1<br />
EPS (USc) 4.8 7.1 9.6<br />
DPS (USc) 1.2 2.4 3.2<br />
NAV/share (USc) 18.8 24.2 31.3<br />
Valuation Ratios<br />
PBV (x) 3.1 2.4 1.9<br />
PER (x) 12.0 8.1 6.0<br />
EV/EBITDA (x) 7.0 4.3 3.3<br />
EBITDA margin (%) 9.2 12.2 13.1<br />
Dividend Yield (%) 2.1 4.1 5.5<br />
Earnings Yield (%) 8.3 12.3 16.6<br />
Gearing (%) 21.5 19.3 11.3<br />
RoaA (%) 12.2 14.8 16.8<br />
RoaE (%) 25.7 31.6 38.4<br />
Innscor - volume vs price<br />
80<br />
2.0<br />
70<br />
60<br />
1.5<br />
50<br />
40<br />
1.0<br />
30<br />
0.5<br />
20<br />
10<br />
0.0<br />
<strong>May</strong>-11 Sep-11 Jan-12 <strong>May</strong>-12<br />
Volume (m) RHS Price (USc) LHS<br />
STRENGTHS<br />
Uncorrelated portfolio of<br />
defensive businesses<br />
Strong brands<br />
Vertical integration<br />
Geographical diversification<br />
OPPORTUNITIES<br />
continued regional growth<br />
Franchise expansion<br />
Growth in disposable incomes<br />
Stronger retail presence with<br />
Spar franchise<br />
WEAKNESSES<br />
Strong competitive environment<br />
Conglomerate feel<br />
THREATS<br />
Cheap imports from SA<br />
Prolonged time to recovery<br />
Source: IES<br />
39
<strong>Overview</strong> of H1 <strong>2012</strong> results<br />
Stellar results<br />
Innscor reported a robust set of financials showing attributable earnings of US$<br />
22.5m, up 59.3% y-o-y for eps of 4.2 US cents a share. The attributable earnings<br />
were just shy of the FY 2011 reported earnings of US$ 26.1m. The strong<br />
performance was anchored by strong volume growth, increased efficiencies and<br />
tight working capital management. EBITDA margins expanded 181bps to 12.0%<br />
resulting in EBITDA growing faster than turnover growth. PBT was enhanced by a<br />
US$ 5.1m profit on the disposal of National Foods shares as Innscor reduced its<br />
stake to 37.8% through a disposal to Tiger Brands.<br />
Pristine balance sheet and solid cash generation<br />
Cash generation remained strong with 70.5% of EBITDA converted into cash, despite<br />
the significant growth of the debtors’ book at TV Sales & Home which grew by<br />
approximately US$ 4.2m. The balance sheet remained in pristine condition and net<br />
gearing improved to 8.5% from 21.5% at year-end. An interim dividend of 0.75 US<br />
cents o a share was declared, implying a dividend cover of 5.5x and an annualised<br />
yield of 2.2%.<br />
BAKERIES & FAST FOODS<br />
Volumes for Bakeries accelerated by 60% y-o-y on improved capacity and<br />
efficiencies. Installed capacity increased to 400,000 loaves a day after the<br />
commissioning of a 3 rd line in Harare and the upgrade of the Bulawayo plant.<br />
Fast Foods customer counts for <strong>Zimbabwe</strong> increased by 8% y-o-y. An additional 11<br />
new counters were opened in <strong>Zimbabwe</strong>. Regional customer counts grew by 13%.<br />
DISTRIBUTION GROUP AFRICA<br />
Volumes grew by 19% y-o-y for the <strong>Zimbabwe</strong> business. GP margins were squeezed<br />
although costs were well contained resulting in improved profitability. The Snack<br />
Food division returned to profitability. Volumes increased by 19% for the regional<br />
business.<br />
SPAR<br />
The <strong>Zimbabwe</strong> Corporate Stores reported a 24% growth in revenue and a small<br />
trading profit of US$ 0.3m. The unit posted a PBT loss of US$ 1.4m due to high<br />
interest and depreciation charges. Further rationalisation of the store network to<br />
focus on larger stores is likely.<br />
SPAR Distribution Centre supported 40 SPAR member stores, 2 SPAR Express Stores,<br />
10 SaveMor branded stores and 2 TOPS bottle stores.<br />
Zambia Corporate stores recorded a 12% increase in revenue on a same store basis.<br />
However, profitability declined on lower margins and new store reopening costs.<br />
The unit operated six corporate stores and five franchised outlets.<br />
PROTEIN<br />
Colcom reported volume growth of 8% (underpinned by entry level products) and<br />
modest growth in both revenue (+4%) and profitability (PAT, up 10%). EBITDA<br />
margins expanded to 17.4% from 13.0% in the prior period. Cash generation<br />
remained strong as US$ 2.9m was generated from operations. A number of capital<br />
projects were completed with US$ 2.0m spent on capex.<br />
Irvine’s posted volume growth of 32%, 21% and 10% for chicken, day old chicks and<br />
table eggs, respectively. Focus is on improving production, factory and distribution<br />
efficiencies.<br />
NATIONAL FOODS<br />
Volumes grew 18% y-o-y to 194,000 metric tonnes translating to a 24% growth in the<br />
topline to US$ 116.1m. Realisations were maintained at US$ 598 per tonne.<br />
Efficiencies improved on better procurement, line automation and enhanced<br />
logistics. EBITDA margins were maintained at approximately 5.0%, despite an<br />
Innscor Shareholding - 31 Jan 2011<br />
Shareholding No. shares (m) %<br />
1 ZMD Investments P/L 102.8 19.0%<br />
2 H M Barbour P/L 100.0 18.5%<br />
3 Old Mutual Group 36.8 6.8%<br />
4 Sarcor Investments P/L 22.5 4.2%<br />
5 Fed Nominees P/L 18.1 3.3%<br />
6 Pharaoh Limited NNR 16.2 3.0%<br />
7 Barclays <strong>Zimbabwe</strong> Nominees P/L-NNR 15.0 2.8%<br />
8 Stanbic Nominees P/L 11.3 2.1%<br />
9 Muzika Rubi Holdings (Pvt) Ltd 11.3 2.1%<br />
10 Barclays <strong>Zimbabwe</strong> Nominees 11.0 2.0%<br />
INNSCOR AFRICA LIMITED<br />
Bakeries & Fast Foods<br />
Distribution Group Africa<br />
SPAR<br />
Bakeries<br />
230,000 loaves per day<br />
Fast Foods<br />
172 Fast food outlets<br />
Distribution Group<br />
Africa (<strong>Zimbabwe</strong>,<br />
Zambia & Malawi)<br />
Snacks (Zapsnaks, Iris Biscuits,<br />
Herbies<br />
Protein<br />
Regional Fast Foods<br />
200 counters spanning Kenya,<br />
Ghana, Zambia, Senegal franchised<br />
SPAR Corporate<br />
11 Stores (<strong>Zimbabwe</strong>)<br />
Xx stores (Zambia)<br />
SPAR Distribution<br />
40 SPAR, 14 Savemor<br />
Colcom (listed)<br />
80% , food processing<br />
Irvine’s<br />
49% chicken producer<br />
NatFoods (listed)<br />
38%<br />
TV sales and Home<br />
12 TV sales& home 2 SPAR good<br />
living, 1 Your Space<br />
Capri<br />
Appliance manufacturerri (fridges),<br />
Other ‐ Associates<br />
Shearwater<br />
Natpak<br />
40
investment of US$ 1.1m in repairs and maintenance.<br />
TV SALES & HOME<br />
Exceptional results were reported as units sold increased<br />
by 45% y-o-y. The debtors’ book increased to over US$<br />
9.0m by 31 December 2011.<br />
CAPRI<br />
Volumes grew 64% y-o-y on improved manufacturing quality<br />
and increased range of products and finishes. New lines<br />
included microwaves, washing machines and driers.<br />
OTHER ASSOCIATES<br />
Shearwater contributed positively while Natpak posted a<br />
small loss.<br />
Outlook<br />
The group continues to invest in its brands<br />
Rationalisation, restructuring and upgrades of production<br />
facilities are part of the group’s strategy to become a low<br />
cost producer and to enhance competitiveness. For FY <strong>2012</strong><br />
the group plans to spend US$ 42.0m (H1 <strong>2012</strong> US$ 21.6m)<br />
on capex. The capex will not only increase capacity, but<br />
also improve production facilities and reduce costs.<br />
Innscor management expects group revenues for FY <strong>2012</strong><br />
to grow by between 20% and 25% and margins to<br />
continue to expand boosting bottom-line growth which is<br />
likely to exceed the FY 2011 growth rate. A PBT margin<br />
of approximately 10% is anticipated.<br />
Valuation and Recommendation<br />
Our SOP valuation ascribes a value of US$ 500.0m i.e. US<br />
92c per share. Innscor’s fundamental strength is that it<br />
is the perfect blend of defensive and complementary<br />
businesses. As well as being dominant in its sectors. In<br />
our view, most of the sectors in which the group is<br />
invested are currently exuding growth rates in excess of<br />
that of the economy. Furthermore, the company<br />
generates significant free cash flow, which creates<br />
financial flexibility (for dividends, acquisitions, stock<br />
repurchase, among other applications). We think that<br />
the earnings per share growth rate can improve<br />
substantially as the economic environment recovers,<br />
making Innscor an excellent early economic recovery<br />
cycle candidate. Buy.<br />
INNSCOR - 5 YEAR CGR COMPARISON<br />
30 JUNE (US$m) 2006 2007 2008 2009 2010 2011 <strong>2012</strong>F 2013F<br />
Balance sheet<br />
Shareholders' equity 20.7 16.1 96.3 101.4 113.7 101.7 130.9 169.4<br />
Minority interests 4.1 3.6 17.3 16.5 19.0 22.8 32.3 45.2<br />
Total shareholders' funds 29.0 23.0 120.2 125.2 137.2 133.4 170.8 221.1<br />
Interest Bearing Debt 1.0 4.9 3.3 13.9 15.2 39.6 46.9 42.1<br />
Trade creditors 11.0 16.9 20.3 25.5 29.0 44.6 55.1 67.2<br />
Current Liabilities 14.3 17.7 22.0 43.7 60.3 73.0 91.1 111.5<br />
Total Liabilities and equity 44.3 45.6 145.4 182.8 212.6 246.1 308.8 374.8<br />
Fixed Assets 9.2 7.4 54.4 57.4 53.0 84.4 114.4 142.4<br />
Investments - - 31.2 33.5 36.4 50.2 59.5 70.5<br />
<strong>Stock</strong> - Trade net 9.7 2.3 48.6 25.0 27.0 35.1 42.6 54.5<br />
Debtors 7.2 8.2 - 30.6 38.2 49.2 59.6 71.5<br />
Cash at bank 4.3 27.7 11.3 14.2 16.3 17.8 21.6 22.9<br />
Current Assets 35.1 38.2 59.9 91.9 123.2 111.5 134.9 161.8<br />
Total Assets 44.3 45.6 145.4 182.8 212.6 246.1 308.8 374.8<br />
Income Statement<br />
Turnover 166.4 166.5 228.3 254.8 403.5 516.1 637.4 777.7<br />
Gross profit 69.8 89.1 138.6 87.6 138.0 184.6 228.0 278.2<br />
EBIT 68.8 52.9 112.7 8.1 22.5 38.7 65.4 86.8<br />
Profit before Tax 85.3 55.8 189.7 9.7 26.6 41.3 65.0 87.7<br />
Taxation 23.2 38.3 37.0 (1.2) 5.0 8.6 16.6 22.4<br />
Profit after Tax 62.2 17.4 152.7 10.9 21.6 32.7 48.4 65.4<br />
Minorities 10.0 13.9 97.3 1.8 5.8 6.6 9.8 13.2<br />
Attributable Income 52.1 3.6 55.4 9.1 15.8 26.1 38.6 52.1<br />
Weighted shares 541.3 541.3 541.3 541.3<br />
EPS (USc) 9.6 0.7 10.2 1.7 2.9 4.8 7.1 9.6<br />
Cash EPS (USc) 9.8 0.8 10.5 1.6 3.9 6.5 9.4 12.4<br />
DPS (USc) 1.1 1.8 - - 0.8 1.2 2.4 3.2<br />
NAV per share (USc) 3.8 3.0 17.8 18.7 21.0 18.8 24.2 31.3<br />
Growth Ratios<br />
Sales growth (%) (21.17) 0.07 37.07 11.63 58.33 27.92 23.50 22.00<br />
Pre-interest profit growth (%) 61.53 (23.08) 112.99 (92.80) 177.75 71.79 68.77 32.78<br />
Earnings growth (%) 38.61 (93.17) 1,456.70 (83.58) 73.82 65.12 47.82 35.07<br />
Margins<br />
Gross margin (%) 41.9 53.5 60.7 34.4 34.2 35.8 35.8 35.8<br />
EBITDA margin (%) 41.9 32.1 50.0 5.4 7.2 9.2 12.2 13.1<br />
Pre-interest margin (%) 41.3 31.8 49.4 3.2 5.6 7.5 10.3 11.2<br />
Interest cover (times) n/a 14.4 n/a 22.2 50.7 13.8 15.7 23.9<br />
Pre-tax profit margin (%) 51.3 33.5 83.1 3.8 6.6 8.0 10.2 11.3<br />
*Note: Financial figures for 2006 to 2008 were derived using the Old Mutual Implied Rate (OMIR), which<br />
may not reflect a true account due to variability of exchange rates during that period.<br />
41
EQUITY RESEARCH<br />
ZIMBABWE<br />
INVESTMENT HOLDING<br />
Banking on growth<br />
Masawara listed on LSE’s AIM, is an investment company<br />
focussed on acquiring interests in companies and projects<br />
based in <strong>Zimbabwe</strong> and the southern Africa region. The<br />
company targets investments that can generate a<br />
minimum project IRR of 25%. The targeted investee<br />
companies should be cash generative with clear growth<br />
potential. Masawara invests in entities where it has the<br />
ability to influence the business at board level. The<br />
company proposes to invest in real estate assets, equity,<br />
quasi-equity or debt instruments that may or may not<br />
provide shareholding or management control.<br />
Investments may be made directly, through special<br />
purpose vehicles or trusts. It is envisaged that exits from<br />
investments will primarily take the form of trade sales or<br />
through listings on an appropriate exchange, although the<br />
company will consider and evaluate other forms of exit.<br />
• Robust portfolio<br />
The portfolio includes an effective 57.3% in Joina<br />
Centre, a 24 storey retail/office building in Harare.<br />
The property has a total gross area of approximately<br />
64,000m 2 and lettable space of approximately<br />
26,851m 2 (15,415m 2 of lettable retail space and<br />
11,436m 2 of lettable office space) and approximately<br />
600 parking bays. Joina City is valued at US$ 49.4m<br />
million, assuming full capacity and annual gross rents<br />
of US$ 3.9m per annum. The office tower was 29%<br />
occupied as at 31 December 2011, while the retail<br />
section was 90% occupied (2010: 63%), leading to an<br />
increase in the group’s share of revenue from US$<br />
0.5m in 2010 to US$ 1.2m in 2011. However, the unit<br />
recorded a loss of US$ 117,000 due to higher<br />
operating costs and bad debts provisioning.<br />
• Masawara also controls a 37.7% stake in TA Holdings,<br />
a <strong>Zimbabwe</strong>an investment company listed on the ZSE<br />
with investments in sub-Saharan Africa focusing on<br />
the insurance, agro-chemical and hospitality<br />
industries.<br />
• Masawara owns 100% of BP and Shell Marketing<br />
Services (Private) Limited (BPSMS), which was<br />
renamed Zuva Petroleum and was acquired for a<br />
consideration of US$ 30.0m financed through a US$<br />
8.2m cash and debt funding arrangements. The<br />
equity investment will be diluted through a<br />
combination of the following measures: i)<br />
introduction of financial and technical partners ii)<br />
the introduction of an employee share ownership<br />
scheme iii). implementation of other economic<br />
empowerment initiatives.<br />
BLOOMBERG: MASA:LN<br />
Current price (USc) 0.8<br />
Liquidity<br />
Market Cap (US$m) 99.0<br />
Shares (m) 119.3<br />
Share price performance<br />
52 Wk High (USc) 1.0<br />
52 Wk Low 0.8<br />
Financials (US$m) - FY 31 Dec 2009 2010 2011<br />
Turnover 0.0 0.5 1.2<br />
Operating Profit (0.7) 1.8 (1.0)<br />
Net finance income 0.1 3.0 10.1<br />
Attributable earnings (2.9) (3.3) 6.7<br />
EPS (USc) (96.4) (9.0) 6.0<br />
DPS (USc) 0.0 0.0 0.0<br />
NAV/share (USc) 379.3 0.0 0.0<br />
Valuation Ratios<br />
PBV (x) 0.0 na na<br />
PER (x) na na 0.1<br />
Earnings Yield (%) na na 723.0<br />
Gearing (%) 294.7 (9.5) (1.3)<br />
RoaA (%) (6.3) (5.7) 7.7<br />
RoaE (%) (25.7) (9.3) 9.0<br />
Nonetheless, Masawara will retain a minimum<br />
51% stake in the company. BPSMS is a long<br />
established importer and distributor of<br />
petroleum products with the largest storage<br />
capacity and widest distribution network<br />
comprising, 70 retail sites. Performance in FY<br />
2011 disappointed. Since acquisition, Zuva<br />
incurred a loss after tax of US$ 1.6m<br />
(Masawara Plc’s effective share of loss of Zuva<br />
was US$ 0.8m)<br />
• The company also acquired a 50% stake in<br />
Telerix Communications (Private) Limited<br />
(Telerix) in November 2010 for a consideration<br />
of US$ 5.0m through a private placement and<br />
invested a further US$ 2.0m in February 2011<br />
through a subscription for preference shares.<br />
The preference shares carry a coupon of 8%<br />
per annum and mature on 30 November <strong>2012</strong>.<br />
Telerix is as an Internet Service Provider (ISP)<br />
in <strong>Zimbabwe</strong>. The company can legally<br />
construct, operate, develop and maintain a<br />
public data internet access and Voice over IP<br />
network in <strong>Zimbabwe</strong> as its subsidiary has an<br />
Internet Access Provider Class A Licence.<br />
Telerix has a 20 year Capacity Purchase<br />
Agreement contract with a local long distance<br />
dark fibre operator, to connect its network<br />
operations centre to the SEACOM. The future<br />
42
for Telerix is in;<br />
- the wholesaling of international bandwidth<br />
to corporate customers and other Internet<br />
Service Providers in <strong>Zimbabwe</strong><br />
- the establishment of fixed, nomadic and<br />
ultimately fully mobile broadband services<br />
via fibre optic and WiMAX network<br />
architecture<br />
- the roll-out of a Fourth Generation<br />
network to provide a "last mile" solution<br />
for Internet customers<br />
-<br />
A loss of US$ 3.2m was incurred in FY 2011(group’s<br />
share US$ 1.6m). The loss was attributable to the<br />
costs being incurred and fixed operating expenses<br />
relating to the ongoing development and testing of<br />
the network, which, was yet to publicly launch the<br />
WiMAX product.<br />
During FY 2011 Masawara acquired a 15.03% interest<br />
in iWayAfrica two months before year end and the<br />
group’s share of iWayAfrica’s was a loss of US$ 8,373.<br />
MASAWARA - 3 YEAR COMPARISON<br />
31 MAR (US$m) 2009 2010 2011<br />
Balance sheet<br />
Shareholders' equity 11.3 59.9 88.6<br />
Minority interests 0.1 1.1 1.4<br />
Total shareholders' funds 11.4 61.0 90.0<br />
Interest Bearing Debt 33.5 5.8 13.9<br />
Trade creditors 0.1 1.2 0.5<br />
Current Liabilities 0.1 1.6 8.9<br />
Total Liabilities and equity 46.3 69.4 105.8<br />
Fixed Assets 0.0 0.0 0.4<br />
Investments 43.3 49.6 85.9<br />
Deposits 0.0 8.0 0.0<br />
Other receivables 0.0 0.3 4.5<br />
Cash at bank 0.2 11.5 15.0<br />
Current Assets 0.5 11.8 19.5<br />
Total Assets 46.3 69.4 105.8<br />
Income Statement<br />
Turnover 0.0 0.5 1.2<br />
Share of associates (0.7) 1.8 -1.0<br />
Fair value gains 0.1 3.0 10.1<br />
Operating profit -0.7 -0.3 7.2<br />
Net finance income (3.0) (1.8) (0.2)<br />
PBT (3.5) (2.1) 7.0<br />
Taxation 0.0 -0.1 0.0<br />
PAT -3.5 -2.2 7.0<br />
Minorities (0.8) 1.1 0.2<br />
Attributable Income -2.9 -3.3 6.7<br />
Weighted shares 0.0 38.3<br />
EPS (USc) -96.4 -9.0 6.0<br />
Cash EPS (USc) 7.1<br />
DPS (USc) - - -<br />
NAV per share (USc) 379.3<br />
43
EQUITY RESEARCH<br />
ZIMBABWE<br />
PROPERTY<br />
Steady as she goes<br />
As the gap between local average rentals and the<br />
regional rentals per square metre is narrowing,<br />
Mashonaland Holdings management have decided to<br />
actively seek ways to diversify the group’s income<br />
streams through the exploitation of new development<br />
opportunities.<br />
• Open market values remain lower than<br />
replacement costs<br />
A liquidity shortage in the economy is suppressing<br />
the increase in the open market values of<br />
properties. For Mash, the property portfolio is<br />
currently valued at US$ 82.5m against a gross<br />
replacement cost of US$ 139.0m. Management<br />
sees room for further growth in real estate values<br />
if fundamentals such as liquidity for mortgage<br />
finance and interest rates improve.<br />
• Tenant ability to pay rentals affected by sluggish<br />
economic growth<br />
Tenants are currently struggling to pay<br />
competitive rents with high default risks being a<br />
major threat.<br />
• Rental reviews supported FY 2011 performance<br />
whilst occupancy levels were also noted to have<br />
improved<br />
The vacancy rate at 9% is still manageable as the<br />
company is working on renovation and<br />
improvement of its property portfolio.<br />
• Valuation indicates the counter is worth holding<br />
Using EV/EBITDA and PBV valuation methods, we<br />
derive a target price of US 2.9 cents, indicating<br />
significant upside. BUY.<br />
BLOOMBERG: MASH:ZH<br />
BUY<br />
Current price (USc) 1.9<br />
Target price (USc) 4.1<br />
Upside/Downside (%) 113.9<br />
Liquidity<br />
Market Cap (US$m) 34.6<br />
Shares (m) 1,819.4<br />
Free float (%) 19.9<br />
Ave. daily vol ('000) 580.6<br />
Share price performance<br />
6 Months (%) -21%<br />
Relative change (%)* -11%<br />
12 Months (%) -5%<br />
Relative change (%)* 16%<br />
*Relative to ZSE Industrial Index<br />
Financials - 31 DEC (US$m) 2011 <strong>2012</strong>F 2013F<br />
Turnover 5.6 7.0 8.3<br />
EBITDA 3.5 4.2 4.9<br />
Net Finance Income 0.2 0.1 0.2<br />
Adj Attributable earnings 2.8 3.0 3.5<br />
Adj EPS 0.2 0.2 0.2<br />
DPS (USc) 0.1 0.1 0.0<br />
NAV/share (USc) 4.3 6.4 4.9<br />
Valuation Ratios 2011 <strong>2012</strong>F 2013F<br />
PBV (x) 0.4 0.3 0.4<br />
PER (x) 12.5 11.5 9.9<br />
EBITDA/EV (%) 11.0 12.8 15.0<br />
EBITDA margin (%) 63.1 59.0 58.4<br />
Dividend Yield (%) 5.8 7.6 1.5<br />
Earnings Yield (%) 8.0 8.7 10.1<br />
Gearing (%) 0.0 0.0 0.0<br />
Adj RoaA (%) 3.2 2.7 2.5<br />
Adj RoaE (%) 3.3 2.8 2.6<br />
Mash Holdings-Price vs Volume<br />
6.0<br />
5.0<br />
4.0<br />
3.0<br />
20.0<br />
15.0<br />
10.0<br />
STRENGTHS<br />
Well managed<br />
Diversified property portfolio<br />
Sizeable land bank<br />
Internal property management skills<br />
WEAKNESSES<br />
Limited funding for capex projects<br />
2.0<br />
1.0<br />
-<br />
Feb-09 Oct-09 Jun-10 Feb-11 Oct-11<br />
5.0<br />
-<br />
OPPORTUNITIES<br />
Improving economic fundamentals<br />
Operating costs stabilising<br />
Increasing availability of funding<br />
for new projects<br />
THREATS<br />
Protracted economic recovery<br />
Political uncertainities<br />
Middle Price (US c)-LHS<br />
Total Volume (m)-RHS<br />
Source: IES<br />
44
<strong>Overview</strong> of FY 2011 results<br />
Revenue up backed by rental reviews and occupancy levels<br />
For FY 2011, revenue went up by 39% to US$ 5.6m supported by<br />
successful rental reviews and increased occupancy levels. The average<br />
rent per square increased to US$ 4.47 from US$ 3.20 in the prior period.<br />
Fair value adjustment boosts the PBT<br />
The office sector contributed approximately 80% to rental income.<br />
Arrears improved to 8% of revenue from 9% in the corresponding period.<br />
A fair value adjustment of US$ 20.2m boosted the PBT to US$ 24.0m.<br />
Stripping out the fair value adjustment, we estimate an adjusted<br />
attributable profit of US$ 2.8m, up 59% y-o-y, translating to an adj. eps<br />
of US 0.15 cents. A final dividend of US 0.026 cents per share was<br />
declared implying a dividend yield of 1.0%.<br />
Mashonaland Shareholding - 30/12/11<br />
Shareholder<br />
# of Shares (m) % of Total<br />
1 ZB Life Assurance Limited 505.0 27.2%<br />
2 Africa Enterprise Network Trust 349.0 18.8%<br />
3 Turner Roy 143.4 7.7%<br />
4 Fed Nominees P/L 127.3 6.8%<br />
5 Mashonaland Holdings Limited 125.1 6.7%<br />
6 Datvest Nominees P/L 66.5 3.6%<br />
7 Old Mutual Life Ass. Co. Zim Ltd 58.1 3.1%<br />
8 ZB Life Staff Pension Fund 57.7 3.1%<br />
9 L.E.S Nominees (Pvt) Ltd 29.5 1.6%<br />
10 Barclays <strong>Zimbabwe</strong> Nominees P/L 27.5 1.5%<br />
Average rentals remain firm although there is limited upside.<br />
Despite the increase in the average rent per square metre the rental<br />
yields for the year eased to 7.28% from 8.5% as the property values<br />
increased. We see limited room for growth in the average rental per<br />
square metre, as other operating costs such as utilities are also weighing<br />
down on tenants.<br />
Gross lettable space<br />
Residential<br />
3%<br />
Retail<br />
4%<br />
The office sector is the group’s flagship<br />
Occupancy levels improved to 92% from 90%. The office sector<br />
contributed approximately 80% to rental income of US$ 5.6m (FY 2010:<br />
US$ 4.1m).<br />
Industrial<br />
45%<br />
Office/retail<br />
46%<br />
Outlook<br />
Performing ahead of budget<br />
Revenue for Q1 <strong>2012</strong> amounted to US$ 2.3m averaging US$ 570,000 per<br />
month, which was 15% ahead of budget and 26% up on the prior quarter.<br />
Operating expenses stood at 34% of income and were in line with the<br />
budget. The profit for the period was 29% ahead of budget and 27% up<br />
for last year<br />
Specialised<br />
2%<br />
Source: IES, company<br />
Property development plans on the board<br />
The group has plans for two property developments, an office park in<br />
Avondale and a residential housing project in Westgate. The projects<br />
will be funded from the company’s cashflow and from borrowings.<br />
Valuation and Recommendation<br />
Valuations indicate the counter is worth buying. Using EV/EBITDA and<br />
PBV valuation methods, we derive a target price of US 2.9 cents,<br />
indicating significant upside. We expect Mash’s quality property<br />
portfolio and stable tenant base to continue driving rental income<br />
growth and the group’s profitability. The property development projects<br />
especially with the diversification to the residential sector are an<br />
additional plus. Accordingly we maintain our BUY recommendation.<br />
Portfolio by value<br />
Industrial<br />
14%<br />
Specialised<br />
2%<br />
Residential<br />
3%<br />
Retail<br />
6%<br />
Development<br />
land<br />
5%<br />
Office/retail<br />
70%<br />
Source: IES, company<br />
45
MASH- 5 YR CGR COMPARISON<br />
31 DEC (US$m) 2006 2007 2008 2009 2010 2011 <strong>2012</strong>F 2013F<br />
Balance sheet<br />
Shareholders' equity 16.8 23.7 51.8 42.1 47.3 80.7 118.4 163.7<br />
Deffered tax 7.4 10.5 23.1 9.0 15.4 4.1 (10.7) (28.8)<br />
Total shareholders' funds 24.2 34.2 74.9 51.1 62.7 84.8 107.8 134.9<br />
Interest Bearing Debt - - - - - - - -<br />
Trade creditors 0.0 0.0 0.0 0.2 0.4 0.4 0.5 0.5<br />
Current Liabilities 0.0 0.0 0.0 0.5 0.9 0.5 4.2 4.6<br />
Total Liabilities and equity 24.3 34.3 74.9 51.6 63.7 85.4 112.0 139.6<br />
Fixed Assets 0.0 34.2 0.0 0.3 0.5 0.5 0.5 0.5<br />
Investments 23.9 - 74.9 50.5 61.7 82.0 105.9 129.2<br />
Debtors 0.0 0.0 0.0 0.3 0.6 0.7 1.2 2.2<br />
Cash at bank 0.1 - 0.0 0.4 0.9 2.2 4.0 7.2<br />
Current Assets 0.4 0.0 0.0 0.8 1.5 2.9 5.6 9.9<br />
Total Assets 24.3 34.3 74.9 51.6 63.7 85.4 112.0 139.6<br />
Income Statement<br />
Turnover 0.2 0.2 0.0 2.4 4.1 5.6 7.0 8.3<br />
Gross profit 0.2 0.1 0.0 2.2 3.4 5.0 5.6 6.4<br />
EBITDA 0.1 0.0 (0.5) 1.5 2.3 3.5 4.2 4.9<br />
Net finance income 0.1 0.0 0.0 0.0 0.1 0.2 0.1 0.2<br />
Adj Attributable Income (12.6) (64.3) (0.5) 1.1 1.7 2.8 3.0 3.5<br />
Weighted shares 1,819.4 1,819.4 1,819.4 1,819.4 1,819.4 1,819.4 1,819.4 1,819.4<br />
Adj EPS (0.7) (3.5) (0.0) 0.1 0.1 0.2 0.2 0.2<br />
DPS (USc) 0.0 0.1 - - 0.0 0.1 0.1 0.0<br />
NAV per share (USc) 0.9 1.3 2.8 2.3 2.5 4.3 6.4 4.9<br />
Growth Ratios<br />
Sales growth (%) (25.0) (81.9) 7,313.4 69.2 38.6 25.0 18.5<br />
Pre-interest profit growth (%) (68.5) (98.4) (420.0) 45.9 54.7 17.5 24.1<br />
Earnings growth (%) 408.7 (99.3) (325.2) 61.7 59.3 9.1 15.5<br />
Margins<br />
Gross margin (%) 78.3 83.6 81.5 92.9 83.4 88.8 89.3 89.9<br />
EBITDA margin (%) 31.4 0.7 (1,468.0) 64.4 56.8 63.1 59.0 58.4<br />
Pre-interest margin (%) 17,589.7 (1,467.4) (954.4) 326.1 426.1 492.2 71.8<br />
Interest cover (times) n/a n/a n/a n/a n/a n/a n/a n/a<br />
*Note: Financial figures for 2006 to 2008 were derived using the Old Mutual Implied Rate (OMIR), which may not reflect a true<br />
account due to variability of exchange rates during that period.<br />
46
EQUITY RESEARCH<br />
ZIMBABWE<br />
INDUSTRIAL HOLDING<br />
Show me the money<br />
Dogged by shareholder squabbles, Meikles’ share price<br />
plummeted 76% to lows of US13c. In our view, execution<br />
missteps have hurt the company, but we believe they can<br />
be fixed and we are watching closely for signs of healing.<br />
Investors also remain wary about the weak corporate<br />
governance issues. We expect a lot of value unlocking in its<br />
subsidiaries, namely supermarkets, departmental stores,<br />
hotels and Tanganda in the long term. The group has<br />
strong defensive characteristics, solid market positioning<br />
and excellent growth potential.<br />
• Margins remained under pressure<br />
For H1 <strong>2012</strong>, Meikles posted a weak set of financials<br />
showing an attributable loss of US$ 5.3m, negatively<br />
impacted by the high finance charges and weak<br />
performances by Tanganda and Head Office. Gross<br />
margins eased to 20.4% from 22.6% in the prior period.<br />
• Changed environment less appealing for<br />
conglomerates<br />
The unbundling of retail operations and the<br />
agriculture concern, Tanganda can unlock value to<br />
shareholders. We believe that any unbundling can be<br />
accelerated as the group plans to introduce new<br />
investors into the units to facilitate substantial<br />
growth.<br />
• Improving business visibility will gradually reduce<br />
valuation discount<br />
Our sum of parts valuation ascribes a fair value of 59.8<br />
US cents a share, representing 232% upside potential.<br />
As investors witness the scaling up of business and<br />
profitability, we expect the market to reassess its<br />
perception. Spec BUY.<br />
BLOOMBERG: KMAL:ZH<br />
SPEC BUY<br />
Current price (USc) 14.0<br />
Target price (USc) 59.8<br />
Upside/Downside (%) 327.1<br />
Liquidity<br />
Market Cap (US$m) 33.7<br />
Shares (m) 240.8<br />
Free float (%) 37.0<br />
Ave. daily vol ('000) 628.2<br />
Share price performance<br />
6 Months (%) (30.0)<br />
Relative change (%)* (22.1)<br />
12 Months (%) (66.7)<br />
Relative change (%)* (58.4)<br />
*Relative to ZSE Industrial Index<br />
Financials (US$m) - FY 31 Mar 2011* <strong>2012</strong>F 2013F<br />
Turnover 330.4 396.5 485.7<br />
EBITDA (0.7) 12.9 15.7<br />
Net finance income (7.6) (6.2) (4.5)<br />
Attributable earnings 6.7 (1.2) 1.3<br />
EPS (USc) 2.8 -0.5 0.6<br />
DPS (USc) 0.0 0.0 0.0<br />
NAV/share (USc) 55.8 56.1 56.6<br />
Valuation Ratios<br />
PBV (x) 0.3 0.2 0.2<br />
PER (x) 5.0 na 25.2<br />
EV/EBITDA (x) na 6.5 5.3<br />
EBITDA margin (%) (0.2) 3.2 3.2<br />
Dividend Yield (%) na na na<br />
Earnings Yield (%) 19.8 na 4.0<br />
Gearing (%) 36.8 35.2 30.1<br />
RoaA (%) 2.5 (0.5) 0.5<br />
RoaE (%) 4.9 (0.9) 1.0<br />
*15 Months<br />
Meikles - volume vs price<br />
80<br />
150<br />
100<br />
40<br />
50<br />
-<br />
0<br />
<strong>May</strong>-11 Sep-11 Jan-12 <strong>May</strong>-12<br />
Volume (m) RHS Price (USc) LHS<br />
STRENGTHS<br />
Diversified income streams<br />
Domestic and regional presence<br />
Strategic Partners (Pick n Pay; TN Bank)<br />
Highly rated brands<br />
Significant asset base (Properties)<br />
OPPORTUNITIES<br />
Regional expansion<br />
Unlocking value through the floatation<br />
of subsidiaries such as Tanganda and<br />
TM Supermarkets<br />
WEAKNESSES<br />
High operating cost structure<br />
Poor image in terms of corporate<br />
governance failures<br />
Weak IT Systems-Supermarkets and<br />
Stores<br />
THREATS<br />
Intense local competition can exert<br />
pressure on margins<br />
Indigenisation laws can stall progress<br />
on potential deals<br />
Source:IES<br />
47
<strong>Overview</strong> of H1 <strong>2012</strong> results<br />
High costs adversely impacted profitability<br />
For H1 <strong>2012</strong>, Meikles posted a weak set of financials showing an<br />
attributable loss of US$ 5.3m, negatively impacted by the high finance<br />
charges and weak performances by Tanganda and Head Office. Gross<br />
margins eased to 20.4% from 22.6% the prior period. Revenue growth was<br />
mainly driven by Supermarkets which contributed 82.5% from 84.0%,<br />
followed by Departmental Stores 7.4% vs 4.8%, Tanganda 5.5% vs 6.6% and<br />
Hotels flat at 4.8%.<br />
Cash generation improved as the net operating cash flow turned positive at<br />
US$ 4.0m from a negative US$ 40.4m. Nonetheless, net gearing<br />
deteriorated to 41.7% from 36.8% at year end. Total debt was<br />
approximately US$ 57.4m at an average cost of 15% p.a. The Cape Grace<br />
remains an asset for disposal by the Cape Grace Group to Mentor. The<br />
disposal is expected to be concluded in the second half of the year. The<br />
group is still owed approximately US$ 37.0m by the RBZ.<br />
Supermarkets remained the crown jewel<br />
Revenue grew 36.4% to US$ 136.6m and EBITDA margins improved to 2.5%<br />
from 1.4%. The supermarkets largely operated from 48 branches during the<br />
period and opened a 50 th store in September 2011.<br />
High utility charges and reduced rains impacted on tea production<br />
EBITDA losses deteriorated to US$ 2.3m from US$ 0.2m in the prior period<br />
as bulk tea production eased by 3% to 2,415 tonnes. High power and labour<br />
costs continue to impact returns on tea, hence the planned diversification<br />
into coffee, macadamia and avocados. A total of 200ha of coffee, 600ha of<br />
macadamia and 400ha of avocados are planned in the next 18 months.<br />
Departmental stores turned the corner<br />
Turnover grew 114.9% y-o-y as the number of credit customers increased to<br />
37,000 from 27,500 at year end. Credit sales accounted for 76% of sales.<br />
Gross margins eased to 32% from 33%. EBITDA was US$ 234,000 from a loss<br />
of US$ 579,000.<br />
Focus on business traveller<br />
The local hotels clocked revenue growth of 25% to US$ 7.9m as tourist<br />
arrivals into <strong>Zimbabwe</strong> grew 16%. Cape Grace revenues declined by 4% to<br />
US$ 6.8m. EBITDA margins for local hotels jumped to 12.5% from 11.3%<br />
whilst EBITDA margins for Cape Grace shrunk to 5.2% from 9.6%. Occupancy<br />
levels improved to 56% from 44% for Victoria Falls, 63% from 59% for Cape<br />
Grace and 52% from 38% for Meikles Hotel. RevPAR increased to US$ 154<br />
from US$ 136 and US$ 62 from US$ 52 for the Victoria Falls and Meikles,<br />
respectively. RevPAR for Cape Grace declined to ZAR 1,616 from ZAR 1,837.<br />
Outlook<br />
Pick n Pay acquisition of TM concluded<br />
Pick ‘n Pay is investing US$ 13.0m into TM Supermarkets and will increase<br />
its shareholding in TM Supermarkets from 25% to 49%. The investment<br />
received all the regulatory requirements. The US$ 13.0m will be used to<br />
update and refurbish existing stores. The TM brand will be retained as it is a<br />
key brand in the market although some strategic stores will be rebranded<br />
Pick ‘n Pay. TM Supermarkets is expected to benefit through stocking and<br />
supplier arrangements, staff training and technology transfer.<br />
The group’s core debt is largely in the form of short term borrowings.<br />
Meikles is therefore looking into ways of replacing short term debt with a<br />
long-term loan. The group plans to introduce new investors into the units to<br />
facilitate substantial growth. Nonetheless, if there are prolonged delays in<br />
the capital raising initiatives growth would wane.<br />
Meikles Shareholding - 31/12/11<br />
Shareholder # of Shares (m) %<br />
1 JRTM Investments P/L 21.3 8.7%<br />
2 Ash Investments P/L 21.1 8.6%<br />
3 FPS Investments P/L 21.0 8.6%<br />
4 ACM Investments P/L 21.0 8.5%<br />
5 APWM Investments P/L 21.0 8.5%<br />
6 Old Mutual Life Assurance Company Zi 16.4 6.7%<br />
7 L.E.S Nominees (Pvt) Ltd 12.8 5.2%<br />
8 Clayway Investments (Pvt) Ltd 12.6 5.1%<br />
9 Datvest Nominees (Pvt) Ltd 5.8 2.4%<br />
10 Stanbic Nominees P/L-NNR 5.3 2.2%<br />
Meikles H1 <strong>2012</strong> results<br />
Income Statement (US$' 000) H1 2011 H1 <strong>2012</strong> % change<br />
Turnover 119,319.0 165,591.0 38.8%<br />
EBITDA 1,147.0 (357.0)<br />
Net finance income (2,889.0) (4,253.0) 47.2%<br />
PBT (2,442.0) (7,040.0) 188.3%<br />
Attributable earnings (694.0) (5,349.0) 670.7%<br />
EPS (USc) (1.2) (2.4) 101.7%<br />
Balance Sheet (US$' 000) FY 2011<br />
Total Assets 249,480.0 249,455.0 0.0%<br />
NAV 134,369.0 126,240.0 -6.0%<br />
Current Assets 60,152.0 63,975.0 6.4%<br />
Current Liabilities 79,523.0 92,603.0 16.4%<br />
Current ratio 0.8 0.7 -8.7%<br />
Cash flow (US$' 000) H1 2011<br />
Operating activities (40,390.0) 4,070.0<br />
Investing activities (5,783.0) (2,461.0) -57.4%<br />
Financing activities 23,109.0 285.0 -98.8%<br />
EBITDA contribution<br />
780%<br />
580%<br />
380%<br />
180%<br />
‐20%<br />
‐220%<br />
549%<br />
Supermarkets<br />
Agriculture<br />
156%<br />
Hotels<br />
(361%)<br />
37%)<br />
Stores<br />
Corporate<br />
(282%)<br />
48
Valuation and Recommendation<br />
Based on our sum of parts valuation for Meikles, we value<br />
the group at US$ 0.60 per share. There is no doubt that<br />
there is political and economic uncertainty hence<br />
investors should be prepared to wait. Overall we believe<br />
Meikles is a solid company with impressive market<br />
positioning and excellent growth potential.<br />
Therefore, we recommend investors begin<br />
acquiring a core position at current levels. Spec<br />
Buy<br />
MEIKLES LIMITED - 5 YEAR CGR COMPARISON<br />
31 MAR (US$m) 2006 2007 2008** 2009 2011* <strong>2012</strong>F 2013F<br />
Balance sheet<br />
Shareholders' equity 43.0 60.5 123.7 140.3 134.4 135.1 136.4<br />
Minority interests 1.6 0.4 1.7 1.3 0.8 3.5 6.8<br />
Total shareholders' funds 3.9 5.1 20.5 15.3 16.0 16.0 16.0<br />
Interest Bearing Debt 6.6 3.6 0.2 7.8 52.8 52.4 46.0<br />
Trade creditors 25.7 9.0 0.8 22.9 30.0 38.9 47.6<br />
Current Liabilities 25.7 22.1 35.3 111.9 45.6 39.3 48.4<br />
Total Liabilities and equity 80.8 91.8 187.8 276.7 249.5 246.3 253.7<br />
Fixed Assets 14.0 17.8 81.5 80.5 84.3 86.8 87.3<br />
Investments 14.4 23.5 22.5 23.5 63.5 86.3 83.8<br />
<strong>Stock</strong> - Trade net 19.4 6.9 29.8 17.1 40.7 48.9 53.9<br />
Debtors 5.5 4.5 42.8 7.3 16.2 19.4 23.7<br />
Cash at bank 27.6 39.2 10.9 2.5 3.3 4.8 4.9<br />
Current Assets 52.5 50.5 83.5 172.4 101.6 73.0 82.5<br />
Total Assets 80.8 91.8 187.8 276.7 249.5 246.3 253.7<br />
Income Statement<br />
Turnover 170.1 114.2 55.8 148.8 330.4 396.5 485.7<br />
Gross profit 139.6 102.8 45.8 29.8 72.8 102.8 125.9<br />
EBITDA 26.7 25.6 15.2 (6.0) (0.7) 12.9 15.7<br />
Net finance income (1.5) 1.5 (1.1) 0.3 (7.6) (6.2) (4.5)<br />
Profit before Tax 59.8 419.0 (134.7) (11.0) 2.9 2.0 6.0<br />
Taxation 15.7 53.9 (7.1) (5.4) (0.8) 0.4 1.3<br />
Profit after Tax 44.1 365.0 (127.7) (5.5) 3.7 1.5 4.6<br />
Minorities 3.9 2.9 -0.2 (0.7) (0.6) 2.8 3.3<br />
Attributable Income 40.2 365.0 (127.5) (4.8) 6.7 -1.2 1.3<br />
Weighted shares 240.8 240.8 240.8<br />
EPS (USc) 16.9 151.6 7.3 (2.0) 2.8 -0.5 0.6<br />
Cash EPS (USc) 3.0 131.5 9.0 (2.1) (2.2) 1.5 2.7<br />
DPS (USc) 3.0 3.5 - - - - -<br />
NAV per share (USc) 17.9 25.1 51.4 58.3 55.8 56.1 56.6<br />
Growth Ratios<br />
Sales growth (%) (35.3) (32.9) (51.2) 166.9 122.0 20.0 22.5<br />
Pre-interest profit growth (%) 10.9 (4.9) (59.8) (202.1) (42.1) (221.0) 37.9<br />
Earnings growth (%) 97.5 808.5 (134.9) (96.2) (238.9) (118.2) (210.1)<br />
Margins<br />
Gross margin (%) 82.0 90.0 82.1 20.0 22.0 25.9 25.9<br />
EBITDA margin (%) 36.0 66.9 (230.7) (4.6) (0.2) 3.2 3.2<br />
Pre-interest margin (%) 15.7 22.3 18.3 (7.0) (1.8) 1.8 2.1<br />
Interest cover (times) 18.2 n/a 9.3 n/a (0.8) 1.2 2.3<br />
Pre-tax profit margin (%) 35.2 367.0 (241.6) (7.4) 0.9 0.5 1.2<br />
*Note: Financial figures for 2006 to 2008 were derived using the Old Mutual Implied Rate (OMIR), which<br />
may not reflect a true account due to variability of exchange rates during that period.<br />
*15 months<br />
** 9 months<br />
49
EQUITY RESEARCH<br />
ZIMBABWE<br />
RETAIL<br />
Xxx<br />
Galloping high on promotions heels!!!!!!!<br />
A steadily improving macro-economic environment and a<br />
stable inflationary environment have supported the growth<br />
in OK Zim’s performance with revenue moving up by more<br />
than the current GDP growth rate.<br />
• Significant sales growth backed by adequate stock<br />
All the company’s stores were adequately stocked<br />
throughout H1 <strong>2012</strong>, which combined with effective<br />
sales and marketing programmes generated significant<br />
growth in sales. Recent refurbishments have also<br />
resulted in noticeable increases in business activity.<br />
• Shrinkage has been controlled<br />
Shrinkage is the main setback for most retailers, and<br />
OK has managed to reduce its shrinkage to 1% against<br />
international standards of 1.5%.<br />
• Improving economic fundamentals a plus<br />
In <strong>2012</strong>, <strong>Zimbabwe</strong>’s GDP is forecast to grow by 9.4%,<br />
up from 9.3% in 2011 and 8.1% in 2010, whilst inflation<br />
is expected to end the year at 4.8%. This positive<br />
trend will obviously trickle through to the household<br />
level, thus boosting disposable incomes.<br />
• Valuation shows upside<br />
Although current ratings are demanding, we expect<br />
the counter to rerate favourably driven by the growth<br />
in earnings. The new look stores, OK’s brand equity<br />
and extensive branch network, should ensure volume<br />
growth and retain the group’s position as the nation’s<br />
top retailer. BUY.<br />
BLOOMBERG:OKZIM:ZH<br />
BUY<br />
Current price (USc) 10.0<br />
Target price (USc) 15.9<br />
Upside/Downside (%) 59.1<br />
Liquidity<br />
Market Cap (US$m) 102.1<br />
Shares (m) 1,020.9<br />
Free float (%) 24.8<br />
Ave. daily vol ('000) 556.8<br />
Share price performance<br />
6 Months (%) 10.5<br />
Relative change (%)* 18.4<br />
12 Months (%) 40.0<br />
Relative change (%)* 57.3<br />
*Relative to ZSE Industrial Index<br />
Financials (US$m) - FY 30 Mar 2011 <strong>2012</strong>F 2013F<br />
Turnover 257.4 370.2 436.8<br />
EBITDA 8.1 18.4 22.7<br />
Net finance income -0.1 -0.6 -0.6<br />
Attributable earnings 4.3 11.9 14.8<br />
EPS (USc) 0.4 1.0 1.2<br />
DPS (USc) 0.2 0.2 0.3<br />
NAV/share (USc) 3.8 4.8 5.9<br />
Valuation Ratios<br />
PBV (x) 2.6 2.1 1.7<br />
PER (x) 25.7 9.9 8.5<br />
EV/EBITDA (x) 11.7 5.2 4.2<br />
EBITDA margin (%) 2.6 3.2 5.0<br />
Dividend Yield (%) 2.1 2.3 2.9<br />
Earnings Yield (%) 3.9 10.1 11.7<br />
Gearing (%) -15.6 -4.8 -2.0<br />
RoaA (%) 3.6 7.9 15.3<br />
RoaE (%) 6.5 13.9 25.7<br />
OK Zim-Price vs Volume<br />
14.0<br />
12.0<br />
10.0<br />
8.0<br />
6.0<br />
4.0<br />
2.0<br />
-<br />
Feb-09 Sep-09 Apr-10 Nov-10 Jun-11 Jan-12<br />
60.00<br />
50.00<br />
40.00<br />
30.00<br />
20.00<br />
10.00<br />
-<br />
STRENGTHS<br />
Defensive food/FMCG business<br />
Expansive retail network<br />
Key locations with high traffic<br />
Strong cash generator<br />
OPPORTUNITIES<br />
Increasing disposable incomes<br />
Resurgence of public sector spend<br />
Recovery in local income<br />
Franchising<br />
WEAKNESSES<br />
Weak consumer incomes<br />
No credit available for white goods<br />
Weak banking sector results in self<br />
financing<br />
THREATS<br />
Competition from locals<br />
Entry of regional players<br />
Protracted economic recovery<br />
Middle Price USc<br />
Total Volume (m)<br />
Source: IES<br />
50
Nature of business<br />
OK <strong>Zimbabwe</strong> is the country’s largest retailer with over 69 years’<br />
experience in retailing. From the company’s first branch which<br />
opened in Harare in 1942, the stores’ portfolio has increased to 51,<br />
comprising 37 OK Stores, 6 Bon Marche, 6 OK Express and 2 OK Mart<br />
stores. The latter were acquired recently after the group took over<br />
Makro’s stores in Harare and Bulawayo. The Pax Cash and Carry was<br />
discontinued in the last financial period and the shops were<br />
converted to OK and OK Express respectively according to size.<br />
Substantial lettable space<br />
The group’s retail space amounts to 66,000m 2 with an additional<br />
13,000m 2 from the recently acquired OK Mart stores. The<br />
company’s offering borders three major categories, groceries, basic<br />
clothing and textiles and house ware products. The target market<br />
ranges from the low income earners (OK Express Stores), middle<br />
income (OK Stores) and high income (Bon Marche). Aside from<br />
offering local and imported goods, the company has developed its<br />
own brands through the OK Pot 'O' Gold, OK Value and Bon Marche'<br />
Premier Choice labels.<br />
<strong>Overview</strong> of H1 <strong>2012</strong> results<br />
Impressive set of financials as both sales and revenue grew<br />
ahead of budget.<br />
The successful recapitalization enabled the company to clear its<br />
short term borrowings and reduce finance cost to just above US$<br />
1,000. Revenue for the period shot up 61% to US$ 185.6m with gross<br />
margins increasing from 16% to 17.1%. PBT for the period amounted<br />
to US$ 5.1m up from US$ 0.6m for the prior period indicating a<br />
profit before tax margin of 2.7% up from 0.53%. Attributable profit,<br />
on the other hand, stood at US$ 3.8m and translated to an EPS of<br />
US 0.38 cents, which compares favourably to US 0.03c for H1 2010.<br />
The company declared an interim dividend of US 0.15c, which<br />
works out to an interim dividend yield of 1.61%.<br />
Strong cash position<br />
As the company cleared its borrowings it was able to register an<br />
impressive current ratio of 1.8x up from 1.4x in the prior period.<br />
Cash ended the period down from US$ 9.5m to US$ 2.26m as the<br />
company forged ahead with its expansion and branch refurbishment<br />
drive.<br />
OK Zim Shareholding - 30/12/11<br />
Shareholder<br />
# of Shares (m) of Total<br />
1 Old Mutual Life Assurance Co. Zim Ltd 160.0 15.3%<br />
2 Old Mutual <strong>Zimbabwe</strong> Ltd 105.7 10.1%<br />
3 National Social Security Authority 105.6 10.1%<br />
4 Barclays <strong>Zimbabwe</strong> Nominees P/L NNR 83.4 8.0%<br />
5 IAFPEF OKZL Limited NNR 82.9 7.9%<br />
6 Lasmid Investments (Pvt) Ltd 62.1 6.0%<br />
7 National Social Security Authority 55.7 5.3%<br />
8 Ractor Investments (Pvt) Ltd 54.9 5.3%<br />
9 IAFPEF OKZL Management Partnership 27.1 2.6%<br />
10 Mining Industry Pension Fund 25.9 2.5%<br />
OK <strong>Zimbabwe</strong> H1 <strong>2012</strong> results<br />
Income Statement (US$) H1 2011 H1 <strong>2012</strong> %∆<br />
Revenue 115,061,283 185,609,258 61%<br />
Net operating expense 1,546,033 7,037,745 355%<br />
Profit/(Loss) before tax 614,951 5,151,350 738%<br />
Attributable Profit/(Loss) 322,151 3,826,861 1088%<br />
HEPS (USc) 0.04 0.38 762%<br />
Balance Sheet (US$)<br />
Total Assets 52,667,957 75,688,375 44%<br />
NAV 31,612,196 41,005,970 30%<br />
Current Assets 31,724,238 42,313,328 33%<br />
Current Liabilities 17,893,909 31,114,884 74%<br />
Current ratio 1.8 1.4 -23%<br />
Cash flow (US$)<br />
C/f from operating activities 3,221,361 2,729,510 -15%<br />
C/f from investing activities (4,299,591) (7,010,898) 63%<br />
C/Financing activities 6,942,292 2,100 -100%<br />
Closing cash and cash equiv 9,536,942 2,264,991 -76%<br />
Outlook<br />
Refurbishments still on the cards<br />
The company had planned a US$ 16.0m capex budget for FY <strong>2012</strong>. A<br />
number of new store sights were also being negotiated, whilst<br />
major refurbishment was planned for four more stores and face<br />
lifting for another four branches.<br />
Valuation and Recommendation<br />
We forecast FY <strong>2012</strong> revenue of US$ 370.2m whilst margins are<br />
likely to improve given the declining shrinkage; we forecast a gross<br />
profit margin of 17.9% for FY <strong>2012</strong> and 18.6% for FY 2013. Our<br />
forecast operating profit margin is 4.0% for FY <strong>2012</strong> up from 2.1%<br />
for FY 2011.<br />
Using an EV/EBITDA valuation, we derive a price of US 15.7c, by<br />
multiplying our forecast EBITDA of US$ 18.4m by the average<br />
EV/EBITDA for OK and its South African peers. BUY<br />
51
OK ZIM - 5 YEAR CGR COMPARISON<br />
31 MAR (US$m) 2006 2007 2008 2009 2010 2011 <strong>2012</strong>F 2013F<br />
Balance sheet<br />
Shareholders' equity 5.7 7.2 7.5 14.2 16.7 38.8 48.5 60.7<br />
Deffered tax - - - 3.6 3.0 3.3 1.8 1.0<br />
Total shareholders' funds 5.7 7.2 7.5 17.8 19.7 42.1 50.3 61.7<br />
Interest Bearing Debt - - 0.1 1.3 7.1 - 5.0 5.0<br />
Trade creditors 5.7 3.4 1.7 6.5 10.9 26.0 28.1 19.9<br />
Current Liabilities 7.5 3.6 1.8 8.6 13.0 26.7 31.0 23.6<br />
Total Liabilities and equity 13.2 10.9 9.4 27.7 39.8 68.8 86.2 90.2<br />
Fixed Assets 0.9 6.0 7.1 17.5 17.8 27.3 31.0 36.1<br />
Investments 0.3 0.1 0.1 0.1 0.1 0.4 1.7 2.3<br />
<strong>Stock</strong> - Trade net 8.2 3.0 1.6 8.6 17.3 31.3 41.5 43.7<br />
Debtors - - 0.0 0.2 0.8 2.8 4.6 1.9<br />
Cash at bank 3.1 1.5 0.4 1.2 3.7 6.5 7.4 6.2<br />
Current Assets 12.0 4.8 2.2 10.0 21.8 40.7 53.5 51.8<br />
Total Assets 13.2 10.9 9.4 27.7 39.8 68.8 86.2 90.2<br />
Income Statement<br />
Turnover 103.4 70.2 38.3 20.3 187.5 257.4 370.2 436.8<br />
Gross profit 0.4 0.3 0.2 8.5 50.1 43.5 66.3 81.1<br />
EBITDA 12.4 11.0 4.6 1.3 4.9 8.1 18.4 22.7<br />
Net finance income 4.2 2.2 0.4 0.1 (1.3) (0.1) (0.6) (0.6)<br />
Profit before Tax 16.7 13.2 5.0 1.4 1.2 5.3 14.7 18.4<br />
Taxation 3.9 3.3 1.5 0.4 0.0 1.0 2.9 3.7<br />
Profit after Tax 12.7 9.9 3.4 1.0 1.2 4.3 11.9 14.8<br />
Minorities - - - - - - - -<br />
Attributable Income 12.7 9.9 3.4 1.0 1.2 4.3 11.9 14.8<br />
Weighted shares 3,518.0 3,518.0 3,518.0 1,020.9 1,020.9 1,060.5 1,120.1 1,189.5<br />
EPS (USc) 1.2 1.0 0.3 0.1 0.1 0.4 1.0 1.2<br />
Cash EPS (USc) 1.2 1.0 0.3 0.1 0.3 0.6 1.3 1.5<br />
DPS (USc) 0.6 0.5 - - - 0.2 0.2 0.3<br />
NAV per share (USc) 0.6 0.7 0.7 1.4 1.6 3.8 4.8 5.9<br />
Growth Ratios<br />
Sales growth (%) (39.96) (32.12) (45.48) (46.94) 823.76 37.28 43.80 18.00<br />
Pre-interest profit growth (%) 35.28 (11.40) (58.20) (71.75) 95.28 113.56 183.27 24.16<br />
Earnings growth (%) 5.83 (22.29) (65.41) (70.93) 23.12 249.78 176.92 24.32<br />
Margins<br />
Gross margin (%) 0.4 0.4 0.5 41.9 26.7 16.9 17.9 18.6<br />
EBITDA margin (%) 12.0 15.7 12.0 6.4 2.6 3.2 5.0 5.2<br />
Pre-interest margin (%) 12.0 15.7 12.0 6.4 1.4 2.1 4.1 4.4<br />
Interest cover (times) 2.9 5.1 12.8 9.5 - 1.9 53.4 - -<br />
Pre-tax profit margin (%) 16.1 18.8 13.0 7.1 0.7 2.1 4.0 4.2<br />
*Note: Financial figures for 2006 to 2008 were derived using the Old Mutual Implied Rate (OMIR), which<br />
may not reflect a true account due to variability of exchange rates during that period.<br />
52
EQUITY RESEARCH<br />
ZIMBABWE<br />
MINING<br />
The ramp-up story continues<br />
Despite the fact that New Dawn Mining is listed on the<br />
Toronto <strong>Stock</strong> <strong>Exchange</strong> (TSX) and has access to international<br />
capital markets, we think that capital raising initiatives are<br />
likely to remain thwarted given the issue of indigenisation in<br />
<strong>Zimbabwe</strong> (at least in the short to medium term).<br />
Management has already indicated that the group will<br />
require a total sum of US$ 40.0m in capex funding so as to<br />
grow the mining operation beyond the 100,000oz annualised<br />
gold production target.<br />
• Moving towards low grade mass mining<br />
New Dawn is unique in the sense that it is one of the<br />
few stocks that offers a pure direct-exposure in<br />
<strong>Zimbabwe</strong>’s gold mining sector. The group has been<br />
injecting some funds into CAG assets with the aim of<br />
stabilising operations, settling liabilities and<br />
undertaking some refurbishments. The company is now<br />
ensuring that its mining assets move towards lowermedium<br />
grade mass mining to achieve its production<br />
targets.<br />
• Grossly undervalued<br />
We have derived a theoretical valuation for New Dawn<br />
of US$ 2.22 per share, which implies 141.1% upside<br />
potential on the current price. We think an<br />
EV/Resource oz of US$ 24.63 points to gross<br />
undervaluation given an average EV/resource oz of<br />
cUS$ 80.00 for other African gold producers. We<br />
maintain our call that investors BUY.<br />
BLOOMBERG:ND:CN<br />
BUY<br />
Current price (CAD) 0.92<br />
Current price (USD) 0.92<br />
Target price (USD) 2.22<br />
Upside/Downside 141%<br />
Liquidity<br />
Market Cap (USDm) 39.6<br />
Shares (m) 42.9<br />
Free float (%) 15.0<br />
Ave. daily vol ('000) 30.0<br />
Share Price Performance<br />
6 Months (%) 1.20 -23.3%<br />
Relative change (%)* -20.3%<br />
12 Months (%) 1.25 -26.4%<br />
Relative change (%)* -9.7%<br />
*Relative to MSCI Frontier Market Index<br />
Financials (USDm)-FY 30 Sept 2011 <strong>2012</strong>F 2013F<br />
Revenue 38.3 60.3 77.9<br />
EBITDA 6.3 6.3 22.3<br />
Attributable earnings 4.2 9.8 16.1<br />
EPS (USc) 10.02 23.28 38.24<br />
DPS (USc) - - -<br />
NAV/share (USc) 88.2 93.7 98.4<br />
Ratios 2011 <strong>2012</strong>F 2013F<br />
Gearing 5.4% 5.1% 6.1%<br />
RoaA 8.0% 15.6% 23.6%<br />
RoaE 13.4% 25.6% 39.8%<br />
EV/EBITDA (x) 6.3 2.4 1.8<br />
EV/oz produced (USD) 1,566 1,124 887<br />
PBV (x) 1.0 1.0 0.9<br />
PER (x) 9.2 4.0 2.4<br />
Earnings Yield 10.9% 25.3% 41.5%<br />
Dividend Yield 0.0% 0.0% 0.0%<br />
EBITDA Margin 16.4% 26.8% 28.6%<br />
New Dawn - volume vs price<br />
2.50<br />
2,500,000<br />
2.00<br />
2,000,000<br />
1.50<br />
1,500,000<br />
1.00<br />
1,000,000<br />
0.50<br />
500,000<br />
-<br />
-<br />
Jul-09 Feb-10 Sep-10 Apr-11 Nov-11<br />
Volume-RHS Price-LHS<br />
STRENGTHS<br />
WEAKNESSES<br />
Balance sheet has negligible debt (Gearring of 5.4%) Over reliance on gold- Limited diversification.<br />
Fully funded capex<br />
Power constraints and mining labour wages<br />
20+ years mine life at max output leading to higher production costs thereby<br />
Significant gold assets around the country through increasing cash costs.<br />
its three gold camps ( Kadoma, Bulawayo & Kwekwe)<br />
TSX Listing enables group to access international<br />
capital markets<br />
OPPORTUNITIES<br />
THREATS<br />
First mover advantages in <strong>Zimbabwe</strong><br />
Production disruption due to ZESA power outages<br />
Exploration upside- There is scope to expand Turk mine Indigenisation regulations may threaten capital<br />
(SRK discovery of an additional 1.5-2.0m oz of resources) raising initiatives especially on foreign<br />
Potential for Bulk mining at the Kadoma and Gweru Camp markets such as the TSX.<br />
Potential of 1.2m tonnes per annum tailings<br />
Lack of skilled labour due to brain drain<br />
retreatment plant<br />
Source: IES<br />
53
Nature of business<br />
A pure gold play<br />
New Dawn Mining is a <strong>Zimbabwe</strong>-focused junior gold miner engaged in the<br />
production, exploration, development, mining and processing of gold. New<br />
Dawn has an objective to reach a consolidated annualised gold production of<br />
50,000-60,000oz of gold by 2013 and 100,000oz of gold by 2015. We note<br />
that the miner’s ultimate goal is to become a mid-tier gold producer<br />
(250,000oz per annum). The recent acquisition of CAG (Central African Gold)<br />
has enabled New Dawn to increase its gold resource base and associated<br />
mining capability to support its production targets. These production targets<br />
are premised, in part, on accessing adequate financing. Furthermore,<br />
production targets may also be impacted by more restrictive and expensive<br />
environmental regulations in the country which could require revisions to<br />
New Dawn’s capital allocation budget and expansion plans.<br />
Three Main Gold Camps (Bulawayo, Gweru and Kadoma) identified<br />
As part of its efforts to integrate and consolidate mining activities, New<br />
Dawn has identified three main gold camps making up its core portfolio of<br />
mining assets. Turk, Old Nic and Dalny form two of the three gold camp<br />
areas while potential near term opportunities at some of its other properties<br />
form the third gold camp. Management has highlighted that the projected<br />
expansion at Turk Mine and planned production at Old Nic and Dalny as well<br />
as the potential near term projects, place New Dawn at a firm position to<br />
meet its target of annualised consolidated production of 38,000 to 40,000oz<br />
by FY <strong>2012</strong>.<br />
Exploration activity is gathering momentum<br />
New Dawn is actively exploring on highly prospective ground employing<br />
modern exploration techniques in <strong>Zimbabwe</strong>, a country that is proven to be<br />
geologically rich, highly prospective, and significantly under explored. More<br />
recently, New Dawn initiated an 8,000m exploration project at its<br />
Camperdown mine, which is part of the company's Gweru Gold Camp located<br />
in the Shurugwi District of <strong>Zimbabwe</strong>. The program aims to test the down-dip<br />
extent of the known mineralised zones within the claims area. To provide<br />
efficient drill rig positioning, initial drilling will be sited around the areas of<br />
previous underground operations. While drilling is occurring, extensive<br />
geological mapping and structural analysis will also be conducted. Also,<br />
approximately 650.0m to the SW of Camperdown, within the claims area,<br />
there is another small open pit, known as the Redhill deposit, where a small<br />
amount of mining has taken place in the past with recovered grades on the<br />
order of 1.5 g/t of gold. The exact geological relationship and stratigraphic<br />
position of Redhill relative to Camperdown is not fully understood and<br />
therefore will be investigated during this exploration program.<br />
<strong>Overview</strong> of Q1 <strong>2012</strong> results<br />
Revenue at US$ 15.4m for Q1 <strong>2012</strong> was 139.0% ahead of Q1 2011. The growth<br />
was driven mainly by consolidated gold production that reached a record of<br />
9,095oz of gold for the quarter, compared to 4,808oz of gold for the quarter<br />
ended Q1 2011. This represented an increase of 89.2% (y-o-y). We note that<br />
the production increase was achieved through a continued focus on the CAG<br />
mines that were acquired in June 2010. We also note that the average sales<br />
price per oz of gold sold increased by 23.0% from US$ 1,370/oz in Q1 2011 to<br />
US$ 1,684/oz. This was a direct effect of the increase in the international<br />
gold price.<br />
Margins expanded despite the increased cash costs<br />
The cash cost for all the gold produced by the company's mines was US$<br />
1,029/oz for Q1 <strong>2012</strong> (Q1 2011: US$ 821/oz). Cash costs per oz increased<br />
primarily as a result of significant increases in various base costs such as<br />
labour, power and mine supplies. New Dawn expects continuing upward<br />
pressure on these costs in <strong>2012</strong>, as well as a potential increase in<br />
Group structure<br />
Note: New Dawn Mining has since increased its<br />
stake in CAG from 89% to 96%<br />
Three main gold camps<br />
Income Statement (USD) Q1 2011 Q1 <strong>2012</strong> % Δ<br />
Revenue 6,458,735 15,440,766 139%<br />
Operating Expenses (6,046,682) (12,276,410) 103%<br />
EBIT 412,053 3,164,356 668%<br />
EBITDA 1,010,375 3,583,788 255%<br />
PBT 586,826 3,005,592 412%<br />
Tax (374,165) (706,712) 89%<br />
PAT 212,661 2,298,880 981%<br />
EPS (USD) 0.01 0.05 400%<br />
Margins Q1 2011 Q1 <strong>2012</strong><br />
EBIT margin 6.4% 20.5%<br />
EBITDA margin 15.6% 23.2%<br />
PBT Margin 9.1% 19.5%<br />
PAT Margin 3.3% 14.9%<br />
Balance Sheet (USD) FY 2011 Q1 <strong>2012</strong> % Δ<br />
Current Assets 13,823,487 15,270,884 10%<br />
Other Assets 43,783,067 47,664,842 9%<br />
Total Assets 57,606,554 62,935,726 9%<br />
Current Liabilities 8,776,016 9,413,876 7%<br />
Other Liabilities 10,980,773 13,283,145 21%<br />
Total Liabilities 19,756,789 22,697,021 15%<br />
Equity 37,849,765 40,238,705 6%<br />
Total Equity & Liabilities 57,606,554 62,935,726 9%<br />
Other Measures Q1 2011 Q1 <strong>2012</strong> % Δ<br />
Gold produced (oz) 4,808 9,095 89%<br />
Gold sold (oz) 4,715 9,171 95%<br />
Cash cost/oz 821 1,029 25%<br />
Revenue/oz 1,370 1,684 23%<br />
54
environmental costs. However, as gold production moves<br />
toward higher normalised levels and refurbishment<br />
programs are completed, increased operating efficiencies,<br />
with a corresponding expected downward trend in cash<br />
costs per ounce can be realised.<br />
Despite an increase in cash costs, New Dawn registered a<br />
significant improvement in margins. EBIT increased 668.0%<br />
to US$ 3.2m, giving an EBIT margin of 20.5%. (Q1 2011:<br />
6.4%). Likewise, EBITDA increased 255% to US$ 3.6m giving<br />
an EBITDA margin of 23.2% and PAT was up 981% to US$<br />
2.3m.<br />
Outlook<br />
The Ramp-up trend expected to continue<br />
Despite the fact that capital raising efforts may be<br />
hamstrung by the aforementioned indigenisation laws,<br />
management remains committed to ramping up<br />
production at the mine in line with set production targets.<br />
We also note the fact that as the group moves towards<br />
mass mining, cash costs are likely to decrease as<br />
production rises due to economies of scale. Using a<br />
conservative average gold selling price of US$<br />
1,742/oz and a production estimate of 45,647oz for<br />
FY 2013, we expect revenues to be around US$<br />
77.9m. Applying a PAT margin of 20.6% implies after<br />
tax earnings of about US$ 16.1m.<br />
Valuation and Recommendation<br />
We have modelled New Dawn earnings outlook in line<br />
with is company’s gold production ramp-up project.<br />
However, we consider our estimates conservative<br />
as we think production numbers will reach<br />
c100,000oz by FY 2019. We have derived a<br />
theoretical valuation for New Dawn of US$ 2.22 per<br />
share, which implies 141.1% upside potential on the<br />
current price. We have also carried out a<br />
comparative analysis for New Dawn. We think an<br />
EV/Resource oz of US$ 24.63 points to gross<br />
undervaluation given an average EV/resource oz of<br />
cUS$ 80.00 for other African gold producers. We<br />
maintain our call that investors BUY.<br />
NEW DAWN MINING - 5 YEAR CGR COMPARISON<br />
30 SEPTEMBER (USDm) 2006 2007 2008 2009 2010 2011 <strong>2012</strong>F 2013F 5yr CAGR<br />
Income Statement<br />
Sales 7.7 9.0 7.5 5.6 16.4 38.3 60.3 77.9 38%<br />
Operating Expenses 6.8 9.3 8.5 6.7 15.0 33.5 46.2 58.3 37%<br />
Operating Income (loss) 0.8 (0.3) (1.1) (1.1) 1.4 4.8 14.1 19.6 42%<br />
EBITDA 1.8 0.8 0.1 (0.4) 2.4 6.3 16.1 22.3 28%<br />
Other Income 0.6 2.2 (1.4) (2.5) (0.1) (0.1) (0.4) (0.4)<br />
Income (loss) before tax 1.4 1.9 (2.4) (3.6) 1.3 4.7 13.7 19.3 27%<br />
Tax provision (0.6) (0.7) (0.0) (0.1) (2.3) (0.7) (2.8) (5.8) 3%<br />
Share of loss /profit to minority interests - - - - 0.2 0.1 (1.1) 2.6<br />
Net income (loss) for the year 0.8 1.3 (2.5) (3.7) (0.8) 4.2 9.8 16.1 39%<br />
Balance Sheet<br />
Assets<br />
Current Assets 5.3 6.7 7.2 9.6 8.9 13.8 15.4 16.3 21%<br />
Fixed Assets 10.0 9.8 9.2 9.5 32.9 39.9 44.1 47.9 32%<br />
Total Assets 16.2 18.6 21.4 19.2 44.8 59.9 65.5 70.7 30%<br />
Liabilities and Shareholders' Equity<br />
Total Liabilities 3.6 4.1 4.2 5.6 19.2 22.8 25.9 29.1 45%<br />
Shareholders' Equity 12.6 14.5 17.2 13.6 25.6 37.0 39.3 41.3 24%<br />
Total Equity & Liabilities 16.2 18.6 21.4 19.2 44.8 59.9 65.5 70.7 30%<br />
Ratios<br />
EPS (USc) 2.8 4.4 (8.5) (12.9) (2.5) 10.0 23.3 38.2<br />
NAV (USc) 43.5 50.0 59.4 46.8 80.6 88.2 93.7 98.4<br />
Gearing - - - - 5.9% 5.4% 5.1% 6.1%<br />
RoaA 6.0% 7.3% -12.4% -18.4% -2.5% 8.0% 15.6% 23.6%<br />
RoaE 7.9% 9.3% -15.6% -24.3% -4.0% 13.4% 25.6% 39.8%<br />
EV/EBITDA 20.0 48.7 547.5 (90.3) 16.2 6.3 2.4 1.8<br />
EV/Oz (produced) 7,266 7,351 4,023 6,113 2,733 1,566 1,124 887<br />
Current Ratio 4.5 5.6 5.8 3.2 1.2 1.6 1.5 1.3<br />
DPS - - - - - - - -<br />
Dividend Yield - - - - - - - -<br />
Margins<br />
OP Margin 10.8% -3.1% -14.1% -19.3% 8.7% 12.6% 23.3% 25.2%<br />
PBT Margin 18.4% 21.6% -32.4% -64.4% 8.0% 12.4% 22.7% 24.7%<br />
PAT Margin 10.7% 14.0% -33.0% -66.2% -4.8% 11.0% 16.2% 20.6%<br />
EBITDA Margin 23.7% 8.4% 0.8% -7.2% 14.5% 16.4% 26.8% 28.6%<br />
55
EQUITY RESEARCH<br />
ZIMBABWE<br />
AGRICULTURE<br />
A huge catch for the day<br />
Padenga Holdings operates, three farms, located on the<br />
shores of Lake Kariba in <strong>Zimbabwe</strong>. The company<br />
produces crocodile skins and meat for export to Europe<br />
and Asia. Padenga is one of the largest Nile crocodile<br />
farming operations in Africa, supplying about 33% of the<br />
world’s demand.<br />
• Better quality skin on fewer animals<br />
Padenga’s emphasis is on producing large crocodile<br />
skins. In 2009, the company decided to reduce the<br />
number of its skins produced from 60,000 skins a<br />
year to 42,000 skins. This strategy has paid off, as<br />
they are now producing better skin quality, with<br />
fewer bite marks which reduce the value of the skin.<br />
• Average skin price expected to improve<br />
For FY <strong>2012</strong>, expected capacity increases by two<br />
premier luxury brand manufacturers are expected to<br />
increase demand for the company’s products.<br />
Culling commenced on the 1 st of March, and the<br />
group is confident of culling and selling its targeted<br />
42,800 skins. The average skin price achieved for FY<br />
2011 was approximately US$ 300 per skin and this is<br />
expected to improve in FY <strong>2012</strong>.<br />
• Luxury goods market demand to double<br />
Growth in the luxury branded goods market is<br />
expected to double in the next decade led by<br />
demand from emerging markets. Padenga is thus<br />
prioritising value addition to the skins where<br />
possible in a manner that will not compete with<br />
existing customers.<br />
• Valuation<br />
We have valued Padenga using a combination of the<br />
EV/EBITDA and NAV valuation techniques, deriving a<br />
target of US 9.9c. Forward ratings are undemanding<br />
at PER+1 of 4.1x and PBV of 0.9x. BUY.<br />
BLOOMBERG: PADENGA:ZH<br />
BUY<br />
Current price (USc) 5.5<br />
Target price (USc) 8.5<br />
Upside/Downside (%) 54.4<br />
Liquidity<br />
Market Cap (US$m) 29.8<br />
Shares (m) 541.6<br />
Free float (%) 37.8<br />
Ave. daily vol ('000) 370.8<br />
Share price performance<br />
6 Months (%) 10.0<br />
Relative change (%)* 18.0<br />
12 Months (%) 10.0<br />
Relative change (%)* 28.9<br />
*Relative to ZSE Industrial Index<br />
Financials (US$m) - FY 30 Jun 2011 <strong>2012</strong>F 2013F<br />
Turnover 19.7 21.3 23.0<br />
EBITDA 6.3 11.2 12.3<br />
Net finance income (1.0) (0.6) (0.3)<br />
Attributable earnings 3.7 7.2 8.1<br />
EPS (USc) 0.7 1.3 1.5<br />
DPS (USc) 0.2 0.3 0.4<br />
NAV/share (USc) 5.7 6.4 7.5<br />
Valuation Ratios<br />
PBV (x) 1.0 0.9 0.7<br />
PER (x) 8.0 4.1 3.7<br />
EV/EBITDA (x) 5.8 3.3 3.0<br />
EBITDA margin (%) 32.1 52.4 53.4<br />
Dividend Yield (%) 3.0 5.9 6.6<br />
Earnings Yield (%) 12.4 24.2 27.2<br />
Gearing (%) 9.4 5.6 2.4<br />
RoaA (%) 9.4 15.4 15.4<br />
RoaE (%) 12.2 22.1 21.6<br />
Padenga - volume vs price<br />
10<br />
5<br />
0<br />
Dec-10 Jul-11 Feb-12<br />
10<br />
8<br />
6<br />
4<br />
2<br />
0<br />
STRENGTHS<br />
WEAKNESSES<br />
Group synergies<br />
Strong competitive environment<br />
Branded products<br />
Conglomerate feel<br />
Strong marketing<br />
Advances to farmers at a cost to<br />
Diversified operations the company<br />
OPPORTUNITIES<br />
THREATS<br />
Franchise expansion Cheap imports<br />
Growth in disposable incomes Prolonged time to recovery<br />
New product development Drought<br />
Volume (m) RHS<br />
Middle Price USc<br />
Source: IES<br />
56
Nature of business<br />
Padenga Holdings is a wholly owned <strong>Zimbabwe</strong> holding company for<br />
businesses engaged in the rearing, slaughter and processing of<br />
crocodiles with the end products being meat and skins. Padenga<br />
supplies approximately 33% of the world’s demand for large, high<br />
quality skins making it one of the largest single exporters of crocodile<br />
skins in the world. Between eight and nine kilogrammes of exportable<br />
meat is produced per animal, based on a slaughter size of 2.1 metres.<br />
The group currently operates three farms on Lake Kariba, producing the<br />
Nile crocodile Crocodylus Niloticus, and also has an abattoir which<br />
slaughters the animals on behalf of the farms. The production of<br />
crocodiles incorporates both ranched stock raised from wild eggs<br />
collected on permit and incubated on-farm, and stock produced from<br />
captive domestic breeders.<br />
<strong>Overview</strong> of H1 <strong>2012</strong> results<br />
Depressed H1 performance in line with the seasonal nature of the<br />
business<br />
Padenga’s interim results obviously showed a loss position given the<br />
seasonal nature of the business, in which the first half is a cost<br />
accumulation period. However it is consoling to note that the results<br />
were consistent with budget with the company still expecting to<br />
achieve its full year profit target of US$ 7.1m. Revenue was minimal at<br />
US$ 7,235, whilst an EBITDA loss of US$ 4.3m was registered against a<br />
loss of US$ 409,578 for the prior period. A fair value adjustment of US$<br />
1.3m was allowed for from a fair value loss of US$ 1.2m. A net interest<br />
payment of US$ 162,004 was realised on borrowings of US$ 3.0m<br />
(average borrowing cost was 7%). The attributable loss for the period<br />
totalled US$ 2.9m (H1 2011: US$ 1.9m).<br />
The balance sheet remained pristine as gearing remained unchanged at<br />
11%, whilst the current ratio remained strong at 8.0x against 8.3x for<br />
the prior period. The group is cash positive with US$ 877,516 raised<br />
from operating activities.<br />
Stable trading environment and depreciation of Rand supported<br />
lower input costs<br />
The stable trading environment and depreciation of the Rand by 21%<br />
benefitted the company in terms of lower input costs as the majority of<br />
the feed input is imported from South Africa and Namibia. Annual egg<br />
collection and the incubation exercise during the period yielded 50,163<br />
hatchlings, which were inducted into hatchling pens consistent with<br />
production requirements. The total grower stock grew to 159,761<br />
animals with an additional 5,034 breeders in pens across the three<br />
farms. The group is moving towards self-sufficiency in egg production,<br />
69% of eggs collected in 2011 were from domestic breeders. Nine<br />
breeder pens and four rearing pens were completed during the period<br />
and a further two rearing pens and six at Nyanyana Farm are still under<br />
construction.<br />
Padenga Holdings Shareholding - 30/12/11<br />
Shareholder<br />
# of Shares (m) % of Total<br />
1 ZMD Investments P/L 102.8 19.0%<br />
2 H M Barbour P/L 100.2 18.5%<br />
3 Old Mutual group 37.7 7.0%<br />
4 Sarco Investments P/L 22.5 4.2%<br />
5 Fed Nominees P/L 18.7 3.5%<br />
6 Datvest Nominees (Pvt) Ltd 14.8 2.7%<br />
7 Pharaoh Limited NNR 14.6 2.7%<br />
8 Stanbic Nominees P/L 14.5 2.7%<br />
9 Muzika Rubi Holdings (Pvt) Ltd 11.3 2.1%<br />
10 City & General Holdings (Pvt) Ltd 9.8 1.8%<br />
Padenga Holdings H1 <strong>2012</strong> results<br />
Income Statement (US$) H1 2011 H1 <strong>2012</strong> %∆<br />
Revenue 4,082,336 7,235 -100%<br />
Operating profit (409,578) (4,329,268) 957%<br />
Fair value adjustment (1,184,144) 1,319,192 -211%<br />
Profit/(Loss) before tax (2,508,759) (3,848,945) 53%<br />
Attributable Profit/(Loss) (1,867,085) (2,851,136) 53%<br />
HEPS (USc) (0.3) (0.5) 56%<br />
Balance Sheet (US$)<br />
Total Assets 34,524,086 35,995,061 4%<br />
NAV 26,392,249 27,009,814 2%<br />
Current Assets 19,266,591 21,195,170 10%<br />
Current Liabilities 2,322,802 2,654,119 14%<br />
Current ratio 8.3 8.0 -4%<br />
Cashflow (US$)<br />
C/f from operating activities 3,236,888 877,516 -73%<br />
C/f from investing activities 588043 ‐559864 -195%<br />
C/Financing activities (4,894,090) 114,050 -<br />
Closing cash and cash equiv (1,069,158) 158,824<br />
Outlook<br />
Global market conditions improving<br />
The global market for crocodile skins has improved and the demand for<br />
big, high quality skins is strong. Management reports that the group is<br />
on target to achieve the FY 2011 off-take target of 43,305 skins and<br />
attributable profits of approximately US$ 4.4m. The company intends to<br />
produce 42,000 skins per annum thereafter and from FY 2013 will<br />
achieve this entirely from domestic stock.<br />
57
Luxury goods market demand expected to double<br />
The company hopes to pursue joint venture projects<br />
with suitable partners so as to access technology,<br />
increase value creation, secure market access and<br />
enhance returns to shareholders.<br />
Ultimately a diversified agro-business<br />
Padenga aims to establish itself as a diversified agrobusiness<br />
involved in the primary production of<br />
crocodiles and their derivatives, freshwater fish and<br />
related animal proteins. The company could also<br />
venture into production of crocodile oils and related<br />
by-products for use in the pharmaceutical and<br />
cosmetics industries. Commercial fish production is<br />
also a natural progression for Padenga given the<br />
similarities in the operational and production systems,<br />
raw feed ingredients, abattoir and processing plant<br />
technology, export markets and end customers<br />
Valuation and recommendation<br />
We have valued Padenga using a combination of the<br />
EV/EBITDA and NAV valuation techniques, deriving a<br />
target of US 9.9c. Forward ratings are undemanding at<br />
PER+1 of 4.1x and PBV of 0.9x. BUY.<br />
PADENGA- 5 YEAR CGR COMPARISON<br />
30 JUNE (US$m) 2009 2010 2011 <strong>2012</strong>F 2013F 2014F 2015F<br />
Balance sheet<br />
Shareholders' equity 32.4 30.1 30.8 34.5 40.6 47.8 56.7<br />
Deffered Tax 3.0 3.6 4.3 3.7 3.5 3.3 2.6<br />
Total shareholders' funds 35.4 33.7 35.1 38.2 44.1 51.1 59.3<br />
Interest Bearing Debt 1.4 7.8 2.9 1.9 1.0 - -<br />
Trade creditors 1.3 0.7 1.1 2.4 2.5 2.8 3.2<br />
Current Liabilities (0.2) (1.9) 1.3 6.8 7.5 8.6 10.8<br />
Total Liabilities and equity 36.7 39.6 39.3 46.9 52.5 59.6 70.1<br />
Fixed Assets 14.5 14.4 13.6 14.6 14.6 21.6 26.6<br />
Investments 0.9 1.2 1.3 1.3 1.3 1.3 1.6<br />
<strong>Stock</strong> - Trade net 1.8 0.7 1.0 1.1 2.7 2.9 3.4<br />
Debtors 1.8 5.6 7.1 8.0 8.7 10.8 12.9<br />
Cash at bank 0.5 1.0 0.6 1.2 1.3 1.4 1.6<br />
Current Assets 21.3 24.0 24.4 31.0 36.6 36.8 41.9<br />
Total Assets 36.7 39.6 39.3 46.9 52.5 59.6 70.1<br />
Income Statement<br />
Turnover 10.2 11.8 19.7 21.3 23.0 25.3 29.1<br />
Gross profit 10.2 11.8 13.0 15.9 17.3 19.7 23.8<br />
EBITDA 0.1 1.3 6.3 11.2 12.3 14.0 17.3<br />
Net finance income (0.1) (0.6) (1.0) (0.6) (0.3) - -<br />
Profit before Tax 0.5 (1.6) 5.0 9.7 10.9 12.6 15.9<br />
Taxation (1.8) (0.7) - - - - -<br />
Profit after Tax 2.3 (0.9) 3.7 7.2 8.1 9.4 11.8<br />
Minorities - - - - - - -<br />
Attributable Income 2.3 (0.9) 3.7 7.2 8.1 9.4 11.8<br />
Weighted shares 541.6 192.3 192.3 541.6 541.6 541.6 541.6<br />
EPS (USc) 0.1 (0.3) 0.7 1.3 1.5 1.7 2.2<br />
Cash EPS (USc) - 0.3 (0.1) 0.9 1.5 1.7 2.0<br />
DPS (USc) - - 0.2 0.3 0.4 0.4 0.5<br />
NAV per share (USc) 6.0 3.3 5.7 6.4 7.5 8.8 10.5<br />
Growth Ratios<br />
Sales growth (%) 15.22 67.16 8.36 7.99 9.97 14.99<br />
Pre-interest profit growth (%) (106.56) 9,836.85 94.98 11.43 11.65 26.19<br />
Earnings growth (%) (140.61) (490.05) 94.73 12.38 15.81 26.04<br />
Margins<br />
Gross margin (%) 100.0 100.0 65.9 74.4 74.9 77.7 81.7<br />
EBITDA margin (%) 0.7 11.0 32.1 52.4 53.4 55.4 59.4<br />
Pre-interest margin (%) (7.73) 0.4 26.2 47.1 48.6 49.3 54.1<br />
Interest cover (times) (5.77) 0.1 5.4 15.6 34.8 n/a n/a<br />
Pre-tax profit margin (%) 5.4 (13.73) 25.2 45.3 47.2 49.9 54.6<br />
58
EQUITY RESEARCH<br />
ZIMBABWE<br />
PROPERTY<br />
Leveraging on improving the quality of its lettable space<br />
The property market has been characterised by limited<br />
demand for CBD offices and suburban retail space, yet<br />
despite this Pearl Properties expects to grow its rental<br />
income and occupancy levels through improving the<br />
quality of its lettable space. From one of its suburban<br />
retail properties, the group expects the rental yield level<br />
to rise from a pre-refurbishment yield of 4.26% to a postrefurbishment<br />
yield of 11.35%. New property<br />
developments are also expected to attract higher quality<br />
tenants and thus improve on rental income and yields.<br />
• Office parks remain the highest in terms of rental<br />
growth and higher occupancy levels, however there<br />
is limited upside for continued rental growth.<br />
Consequently the group is targeting to grow its<br />
lettable area and holds a land bank worth 10% of the<br />
total portfolio. During FY 2011 it purchased<br />
52,611m 2 of prime residential land.<br />
• The group’s entry into the residential sector is<br />
expected to yield a high target return of 25%<br />
We are excited about the group’s prospective<br />
property developments in the lucrative sector. The<br />
country has a massive housing backlog, estimated at<br />
1.2m units, which in the short to medium term<br />
should support the high rentals. Upward movement<br />
on prices for residential properties could however be<br />
constrained by limited liquidity and the lack of<br />
mortgage finance.<br />
• Yield on industrial properties improve<br />
Industrial properties have been attracting negligible<br />
rental and yield levels, due to the continued<br />
depressed performance of the manufacturing sector.<br />
However, a new trend of increasing demand for<br />
retail warehousing space has brought the sector to<br />
life.<br />
• Valuations show significant upside<br />
Using an EV/EBITDA valuation method we derive a<br />
value of US 4.7c, signifying significant upside, we<br />
rate the counter a BUY.<br />
BLOOMBERG: PEARL:ZH<br />
BUY<br />
Current price (USc) 2.7<br />
Target price (USc) 4.7<br />
Upside/Downside (%) 74.0<br />
Liquidity<br />
Market Cap (US$m) 33.4<br />
Shares (m) 1,238.2<br />
Free float (%) 16.3<br />
Ave. daily vol ('000) 834.0<br />
Share price performance<br />
6 Months (%) -13%<br />
Relative change (%)* -3%<br />
12 Months (%) -10%<br />
Relative change (%)* 11%<br />
*Relative to ZSE Industrial Index<br />
Financials - 31 DEC (US$m) 2011 <strong>2012</strong>F 2013F<br />
Turnover 9.2 10.5 11.7<br />
EBITDA 5.0 5.7 6.2<br />
Net Finance Income 0.4 -0.8 -0.6<br />
Adj Attributable earnings 4.3 4.6 5.3<br />
Adj EPS 0.3 0.4 0.4<br />
DPS (USc) 0.1 0.0 0.1<br />
NAV/share (USc) 8.6 8.1 8.7<br />
Valuation Ratios 2011 <strong>2012</strong>F 2013F<br />
PBV (x) 0.3 0.3 0.3<br />
PER (x) 7.8 7.3 6.3<br />
EBITDA/EV (%) 15.4 17.3 19.0<br />
EBITDA margin (%) 54.7 54.0 53.3<br />
Dividend Yield (%) 4.1 1.8 2.5<br />
Earnings Yield (%) 12.9 13.8 15.8<br />
Gearing (%) 0.0 7.1 5.5<br />
Adj RoaA (%) 3.7 3.8 4.1<br />
Adj RoaE (%) 3.7 4.1 4.3<br />
Pearl Properties-Price vs Volume<br />
10.0<br />
8.0<br />
6.0<br />
4.0<br />
2.0<br />
-<br />
Feb-09 Feb-10 Feb-11 Feb-12<br />
50.00<br />
40.00<br />
30.00<br />
20.00<br />
10.00<br />
-<br />
STRENGTHS<br />
Focused and experienced management<br />
Sizeable land bank<br />
Diversified property portfolio<br />
Managable arrears levels<br />
OPPORTUNITIES<br />
Improving economic fundamentals<br />
Operating costs stabilising<br />
Increased use of project finance<br />
WEAKNESSES<br />
Limited free cashflow for new<br />
projects<br />
THREATS<br />
Increasing debtors<br />
Drawnout economic recovery<br />
Middle Price (US c)-LHS<br />
Total Volume (m)-RHS<br />
Source: IES<br />
59
<strong>Overview</strong> of FY <strong>2012</strong> results<br />
Steady performer<br />
Pearl’s final results reflected a steady performance from the<br />
group, as it continued to derive significant value from its<br />
substantial asset base. Rental income growth was sustained by<br />
successful rental reviews, and rose by 15% to US$ 8.1m whilst net<br />
property income amounted to US$ 6.9m, rising by about 1.2% as<br />
the group continued to carry out several maintenance and<br />
refurbishment projects.<br />
High operating costs, but within budget<br />
The group had finance income of US$ 439,271 with US$ 192,076<br />
being interest on overdue tenant accounts and US$ 247,195<br />
interest on investments. Other operating expenses went up by<br />
15.8% as the group pays utility bills for the buildings and recovers<br />
the money from its tenants (recoveries are good at between 82%<br />
and 85%). Tenant receivables went up by 62% to US$ 1.5m, of this<br />
total US$ 751,231 are tenant balances that were handed over for<br />
litigation in a bid to recover past amounts due. Provisions for<br />
credit losses were also increased by 71% to US$ 658,239.<br />
Recoveries from cases handed over for collections have been good<br />
at about 98%.<br />
Pearl Shareholding - 30/12/11<br />
Shareholder<br />
# of Shares (m) % of Total<br />
1 FML Policyholders 375.0 30.3%<br />
2 Barclays Zim Nominees P/L NNR 134.9 10.9%<br />
3 Afre Corporation Limited 98.2 7.9%<br />
4 EW Capital Holdings P/L 61.9 5.0%<br />
5 Fist Mutual Life Managed Funds 61.0 4.9%<br />
6 FML - Shareholders 59.1 4.8%<br />
7 FMRE Property and Casulaty Shareholde 53.0 4.3%<br />
8 Stanbic Nominees (Pvt) Ltd NNR 50.5 4.1%<br />
9 Econet Wireless Hldings Limited 49.0 4.0%<br />
10 Fed Nominees (Pvt) Ltd 28.5 2.3%<br />
Bottom-line boosted by a fair value adjustment<br />
A fair value adjustment on property of US$ 19.4m was allowed<br />
for, following a valuation by Knight Frank, which raised the PBT<br />
to US$ 24.9m (FY 2010: US$ 17.1m) and the attributable profit to<br />
US$ 18.6m. Stripping out the fair value adjustment we derive an<br />
adjusted attributable profit of US$ 4.3m.<br />
Balance sheet remains solid<br />
The balance sheet remains solid with total assets up 25% to US$<br />
117.6m, largely backed by the 26% jump in investment properties<br />
to US$ 109.7m. The group has nil gearing and a strong current<br />
ratio of 3.9x.<br />
Gross Lettable Area Split<br />
Retail<br />
Suburban<br />
7%<br />
Office<br />
Parks<br />
20%<br />
Retail<br />
CBD<br />
9%<br />
Industrial<br />
31%<br />
CBD<br />
Office<br />
33%<br />
Improved average rentals..<br />
Portfolio performance showed improved average rentals/m 2 on<br />
the back of ongoing refurbishments which have yielded improved<br />
quality space. Office parks rentals moved from US$ 9.5/m 2 to<br />
US$11/m 2 , as demand remains strong. For CBD offices, average<br />
rentals increased from US$ 7.3/m 2 to US$ 8.7/m 2 and although<br />
the sector has been characterised by low demand, the company is<br />
realising the fruit of its refurbishment exercise as the recovered<br />
space is being let out to quality tenants. Vacancies at 19.5%<br />
reflect evictions of non-paying tenants. CBD retail rentals moved<br />
up from US$ 5.5/m 2 to US$ 7.1/m 2 whilst suburban retail rentals<br />
averaged US$ 7.2/m 2 from US$ 3.7/m 2 with a high vacancy rate of<br />
79.9% being driven by major refurbishments. Industrial properties’<br />
rentals improved from US$ 2.30/m 2 to US$ 3.0/m 2 as there has<br />
been a rise in demand for retail warehousing space.<br />
..at lower rental yields<br />
Occupancy levels for FY 2011 stood at 77.5%, lower than the FY<br />
2010 level of 87.4%, attributed by management to ongoing<br />
refurbishments. The overall portfolio yield, although in line with<br />
budget, declined from FY 2010’s 10.1% to 9.8% due to a decline in<br />
the CBD retail, office parks and suburban retail property yields.<br />
Property Portfolio Review<br />
1.2<br />
0.8<br />
0.4<br />
0<br />
Industrial<br />
CBD<br />
Office<br />
Office<br />
Parks<br />
Retail<br />
Surbaban<br />
Source: IES, company<br />
Retail<br />
CBD<br />
Average rental per m2 ($) Occupancy rate (%)<br />
Rental Yields (%)<br />
$/m2<br />
16<br />
12<br />
8<br />
4<br />
0<br />
Source: IES, Company<br />
Outlook<br />
In a trading update, management reported that revenue for the<br />
two months (January and February <strong>2012</strong>) amounted to US$ 1.37m,<br />
slightly short of the budget of US$ 1.40m, whilst property<br />
60
expenses amounted to US$ 0.26m against a budgeted US$<br />
0.55m. The group intends to continue improving the quality<br />
of its space, acquiring land and existing buildings whilst<br />
tenant re-organisation will continue. Two greenfield<br />
projects to be undertaken in <strong>2012</strong>, are the mixed use<br />
development in Borrowdale which is expected to cost US$<br />
5.0m (project yield of 10%) and 2 Arundel office blocks at a<br />
cost of US$ 9.0m at a yield of 10%. The projects are to be<br />
funded through long term project structured finance.<br />
Valuation and recommendation<br />
We expect rental reviews to be limited given the<br />
prevailing liquidity strain, however Pearl’s<br />
significant land bank and planned property<br />
developments are likely to make the company<br />
derive significant growth going forward. Ratings are<br />
undemanding, with the PBV ratio at less than the<br />
regional average while yield ratios are attractive<br />
and in line with the region. Using an EV/EBITDA<br />
valuation method we derive a value of US 4.7c,<br />
signifying significant upside, we rate the counter a<br />
BUY.<br />
PEARL- 5 YR CGR and Forecasts<br />
31 DEC (US$m) 2006 2007 2008 2009 2010 2011 <strong>2012</strong>F 2013F<br />
Balance sheet<br />
Shareholders' equity 29.1 27.4 66.5 75.1 89.0 106.5 100.7 107.7<br />
Deffered tax 9.2 11.2 27.8 3.7 3.7 9.2 11.0 13.0<br />
Total shareholders' funds 38.6 38.8 95.0 79.5 93.6 116.8 112.8 121.7<br />
Interest Bearing Debt - - - - - - 8.0 6.7<br />
Trade creditors 0.0 0.1 0.1 0.6 0.5 0.8 0.9 1.0<br />
Current Liabilities 0.1 0.1 0.1 0.9 0.7 0.8 1.2 1.3<br />
Total Liabilities and equity 38.7 38.9 95.1 80.4 94.3 117.6 122.0 129.7<br />
Fixed Assets 0.0 0.2 1.3 0.4 0.4 0.6 1.5 2.2<br />
Investments - - 4.9 6.0 3.5 2.3 4.0 5.8<br />
Investment Properties 46.1 32.7 88.8 72.4 86.9 109.7 113.6 117.6<br />
Debtors - - - 1.5 1.9 2.3 1.7 2.6<br />
Cash at bank 0.1 0.0 0.0 0.1 1.6 0.8 1.0 1.3<br />
Current Assets 0.1 6.0 0.1 1.6 3.5 3.3 2.9 4.1<br />
Total Assets 46.2 38.9 95.1 80.4 94.3 117.6 122.0 129.7<br />
Income Statement<br />
Turnover 0.8 2.2 0.1 5.3 8.9 9.2 10.5 11.7<br />
Gross profit 0.8 2.2 0.1 5.3 7.9 8.0 9.1 10.0<br />
EBITDA 0.5 2.1 (0.0) 3.1 5.1 5.0 5.7 6.2<br />
Net finance income 0.1 0.1 0.0 0.1 0.3 0.4 (0.8) (0.6)<br />
Adj Attributable Income 0.1 1.1 (3.3) 3.4 4.5 4.3 4.6 5.3<br />
Weighted shares 1,238.2 1,238.2 1,238.2 1,238.2 1,238.2 1,238.2 1,238.2 1,238.2<br />
Adj EPS 0.0 0.1 - 0.3 0.3 0.4 0.3 0.4 0.4<br />
DPS (USc) - - - - 0.1 0.1 0.0 0.1<br />
NAV per share (USc) 2.3 2.2 5.4 6.1 7.2 8.6 8.1 8.7<br />
Growth Ratios<br />
Sales growth (%) 190.7 (96.7) 7,254.8 67.9 3.5 13.8 11.3<br />
Pre-interest profit growth (%) 2,005.5 (100.8) - 66.7 (2.9) 7.8 7.0<br />
Earnings growth (%) 994.5 323.6 (48.0) 577.6 14.6 (66.3) 7.7<br />
Margins<br />
Gross margin (%) 100.0 100.0 100.0 100.0 88.8 87.4 86.7 86.0<br />
EBITDA margin (%) 13.2 95.7 - 22.0 58.3 57.7 54.7 54.0 53.3<br />
Pre-interest margin (%) 13.2 95.7 - 22.0 56.9 56.5 53.0 50.2 48.3<br />
Interest cover (times) n/a n/a n/a n/a n/a n/a 6.8 8.9<br />
*Note: Financial figures for 2006 to 2008 were derived using the Old Mutual Implied Rate (OMIR), which may not reflect a true<br />
account due to variability of exchange rates during that period.<br />
61
EQUITY RESEARCH<br />
ZIMBABWE<br />
AGRICULTURE MINING<br />
A definate cash spinner<br />
SeedCo, which is 50.86% owned by ZSE listed AICO<br />
Africa Limited, is a producer and marketer of certified<br />
seeds. The company has a dominant market share in the<br />
hybrid maize seed market, controlling around 70% of<br />
the <strong>Zimbabwe</strong>an market. Its main products include<br />
maize, wheat, barley, cotton, soya, sorghum and<br />
groundnut seed. It also owns Quton, a cotton seed<br />
growing company. SeedCo has been expanding its<br />
operations in the region to Zambia, Malawi, Botswana,<br />
DRC, Swaziland, Uganda and Kenya.<br />
• Fortune favours the group<br />
For H1 <strong>2012</strong>, an improvement in commodity prices<br />
buoyed winter cereal sales while demand for<br />
cotton seed in Malawi and Tanzania continues to<br />
grow. Management is confident that improved<br />
stock levels should lower transport and duty costs<br />
and improve margins.<br />
• Production expected to increase for FY <strong>2012</strong><br />
Management estimates overall production volumes<br />
of about 94,000mt for FY <strong>2012</strong> up from 55,000mt<br />
and is targeting sales of about 66% of total<br />
production.<br />
• Real growth in earnings expected<br />
For FY <strong>2012</strong>, we expect the earnings yield to rise<br />
to 10.6% from 8.7% whilst the ROaE should remain<br />
steady at the 27.5% level. Intensified marketing<br />
efforts and positive contribution from new<br />
businesses should provide a boost.<br />
• Valuations are undemanding<br />
Using a DCF valuation, we derive a value of<br />
US$1.43 per share. Ratings are undemanding at<br />
PER+1 of 9.5x and PBV of 3.0x. We maintain our<br />
Buy recommendation.<br />
BLOOMBERG: SEEDCO:ZH<br />
BUY<br />
Current price (USc) 80.0<br />
Target price (USc) 143.4<br />
Upside/Downside (%) 79.3<br />
Liquidity<br />
Market Cap (US$m) 154.4<br />
Shares (m) 193.0<br />
Free float (%) 35.3<br />
Ave. daily vol ('000) 63.2<br />
Share price performance<br />
6 Months (%) 45.3<br />
Relative change (%)* 30.4<br />
12 Months (%) 81.6<br />
Relative change (%)* 61.5<br />
*Relative to ZSE Industrial Index<br />
Financials (US$m) - FY 31 Mar 2011 <strong>2012</strong>F 2013F<br />
Turnover 97.8 124.6 148.4<br />
EBITDA 24.5 29.5 36.3<br />
Net finance income (2.1) (2.1) (2.4)<br />
Attributable earnings 17.4 18.4 22.8<br />
EPS (USc) 9.0 9.5 11.8<br />
DPS (USc) 2.4 3.2 2.6<br />
NAV/share (USc) 27.5 33.8 43.0<br />
Valuation Ratios<br />
PBV (x) 2.9 2.4 1.9<br />
PER (x) 8.9 8.4 6.8<br />
EV/EBITDA (x) 7.1 5.9 4.8<br />
EBITDA margin (%) 25.0 23.7 24.5<br />
Dividend Yield (%) 2.9 4.0 3.3<br />
Earnings Yield (%) 11.3 11.9 14.8<br />
Gearing (%) 29.2 17.3 12.3<br />
RoaA (%) 16.4 14.4 15.9<br />
RoaE (%) 27.5 24.2 25.0<br />
SeedCo - volume vs price<br />
160<br />
1.0<br />
120<br />
80<br />
40<br />
0<br />
0.0<br />
Mar-09 Mar-10 Mar-11 Mar-12<br />
Total Volume(m)-RHS Middle Price (US c)-LHS<br />
Source: IES<br />
STRENGTHS<br />
Significant market share<br />
Strong brands & Syngenta r/ship<br />
Growing presence in SSA<br />
Strong research and dev. unit<br />
Hybrids protected by patents<br />
OPPORTUNITIES<br />
Quintessential recovery play on<br />
<strong>Zimbabwe</strong> agric sector<br />
Growth in Angola, Malawi & Tanzania<br />
Gvt opening up to GMO varieties<br />
WEAKNESSES<br />
Dependence on reg governments<br />
Aggressive competition<br />
and imported varities<br />
Over reliance on maize<br />
THREATS<br />
Drought<br />
Lower aid inflows and less public<br />
spend on small holder farmer<br />
input schemes<br />
Fertiliser and fuel price shocks<br />
62
Nature of business<br />
SeedCo has a research collaboration agreement with Syngenta, a<br />
European based global agribusiness involved in seed and crop<br />
protection. Quton Company is the only cotton seed producer in<br />
<strong>Zimbabwe</strong> with a production base of about 10,000 tonnes a year and<br />
about 20 seed varieties. Seed production is equally spilt between<br />
<strong>Zimbabwe</strong> and the region. Annual regional production amounts to<br />
50,000 tonnes, and the group’s total capacity is about 70,000<br />
tonnes.<br />
<strong>Overview</strong> of H1 2011 results<br />
Sales volumes boosted by winter cereals<br />
Because of the seasonality of the business, SeedCo’s first half is a<br />
cost only period and as such the company posted a loss for H1 <strong>2012</strong>.<br />
Nonetheless, sales volumes grew 63% y-o-y propelled by a 44%<br />
growth in winter cereals to 5,441mt and early seed cotton to Malawi<br />
of 3,400mt. Maize seed sales declined 4% to 6,754mt.<br />
Profitability margins weaker<br />
Gross profit margin eased to 40% from 42%, a result of carryover<br />
stock of winter cereals (wheat) which had to be sold at lower prices<br />
as it is open pollinated with a shorter life. Opex increased 24% y-o-y<br />
driven by a 28% increase in research costs and a 34% jump in sales<br />
and marketing expenses as the company has moved from a<br />
production based approach to a market oriented approach in order<br />
to stimulate increased sales volumes. SeedCo fully provided for<br />
doubtful debtors which knocked off approximately US$ 0.7m off the<br />
earnings. Finance charges increased as the group financed the seed<br />
intake and the carryover borrowings that funded production.<br />
Strained cashflows<br />
Due to the seasonality of its business, cash flows were strained on<br />
high working capital requirements. Gearing deteriorated to 73.1%<br />
from 32.8% at year-end. Borrowings were at an average cost of<br />
approximately 13% in <strong>Zimbabwe</strong> (approximately US$ 25.0m) and<br />
between 5% and 7% in the regional businesses.<br />
Outlook<br />
Management anticipates sales volumes to exceed 65,000mt in FY<br />
<strong>2012</strong> and the company has adequate stock to meet the firm<br />
demand. Revenue is forecast to grow by at least 20% and net<br />
margins to be maintained at approximately 20%. In our view,<br />
margins might be enhanced given the carryover stock which was<br />
produced at lower prices.<br />
We estimate that the average seed prices will stay at the same<br />
levels of between US$ 1,800/mt and US$ 2,000/mt. Soya bean seed<br />
is expected to sell out. The cotton seed business continues to grow<br />
especially in Tanzania and Malawi with further opportunities in<br />
Zambia. Production in 2011/12 will be scaled down due to carryover<br />
stock. SeedCo is likely to have significant cash in FY <strong>2012</strong>/3 due to<br />
reduced working capital requirements allowing for increased<br />
dividend payouts.<br />
SeedCo Shareholding - 31/12/11<br />
Shareholder # of Shares (m) %<br />
1 AICO Africa Limited 97.5 50.2%<br />
2 Old Mutual Life Assurance Co. Zim Ltd 20.5 10.5%<br />
3 Barclays Nominees P/L - NNR 12.5 6.4%<br />
4 Stanbic Nominees P/L 8.4 4.3%<br />
5 Fed Nominees (Pvt) Ltd 5.4 2.8%<br />
6 National Social Security Authority 3.7 1.9%<br />
7 Local Authorities Penion Fund 3.4 1.7%<br />
8 Old Mutual <strong>Zimbabwe</strong> Limited 2.6 1.3%<br />
9 Mining Industry Pension Fund 2.3 1.2%<br />
10 Dekalb Genetics Corporation 1.7 0.9%<br />
SeedCo H1 <strong>2012</strong> results<br />
Income Statement (US$ '000) H1 2011 H1 <strong>2012</strong> % change<br />
Turnover 20,350.9 30,388.8 49.3<br />
Gross Profit 8,504.2 12,053.5 41.7<br />
PBIT (693.2) 509.3 (173.5)<br />
Net finance income (244.6) (1,075.3) 339.7<br />
PBT (937.8) (566.0) (39.6)<br />
Attributable earnings (1,458.8) (1,404.1) (3.7)<br />
EPS (USc) (0.76) (0.73) (3.7)<br />
Balance Sheet (US$ '000) FY 2011<br />
Total Assets 122,567.8 146,477.6 19.5<br />
NAV 70,014.7 62,726.8 (10.4)<br />
Current Assets 81,625.4 103,027.7 26.2<br />
Current Liabilities 17,239.8 25,494.3 47.9<br />
Current ratio 4.7 4.0 (14.6)<br />
Cash flow (US$ '000) H1 2011<br />
Operating activities (13,694.4) (13,713.7) 0.1<br />
Investing activities (6,549.2) (5,395.1) (17.6)<br />
Financing activities (3,601.7) (6,887.5) 91.2<br />
Source: IES, Company<br />
SeedCo Market Share<br />
80%<br />
20,000<br />
60%<br />
16,000<br />
12,000<br />
40%<br />
8,000<br />
20%<br />
4,000<br />
0%<br />
-<br />
Sales Volumes (Tonnes)-RHS Market Share-LHS<br />
Source: IES, Company<br />
Valuation and recommendation<br />
Using a DCF valuation, we derive a value of US$ 1.43 per share.<br />
Ratings are undemanding at PER+1 of 9.5x and PBV of 3.0x. We<br />
recommend investors Accumulate.<br />
63
SEEDCO- 5 YEAR CGR COMPARISON<br />
31 MAR (US$m) 2006 2007 2008 2009 2010 2011 <strong>2012</strong>F 2013F<br />
Balance sheet<br />
Shareholders' equity 4.3 14.1 29.5 52.0 57.0 70.0 82.3 100.0<br />
Minority interests 1.3 1.9 2.3 2.2 2.4 - - -<br />
Total shareholders' funds 6.4 19.5 40.5 68.9 70.6 82.4 88.5 103.1<br />
Interest Bearing Debt 12.5 16.3 13.5 6.0 4.4 25.4 20.5 20.2<br />
Trade creditors 2.1 1.3 1.6 3.5 5.2 11.2 17.2 22.9<br />
Current Liabilities 6.7 3.5 4.5 10.6 14.5 14.7 24.0 31.3<br />
Total Liabilities and equity 25.7 39.3 58.5 85.5 89.5 122.6 133.0 154.6<br />
Fixed Assets 3.9 16.7 30.1 46.6 37.0 40.6 40.6 49.6<br />
Investments 0.0 0.0 0.3 1.2 1.1 0.3 0.4 0.4<br />
<strong>Stock</strong> - Trade net 7.4 13.8 11.0 11.9 14.6 28.5 30.8 36.7<br />
Debtors 8.3 7.1 12.9 17.2 19.6 40.4 45.7 49.2<br />
Cash at bank 3.5 0.2 1.3 3.5 9.6 5.0 6.3 7.9<br />
Current Assets 21.7 22.6 28.1 37.7 51.3 81.6 92.0 104.6<br />
Total Assets 25.7 39.3 58.5 85.5 89.5 122.6 133.0 154.6<br />
Income Statement<br />
Turnover 33.8 39.2 52.8 53.9 77.0 97.8 124.6 148.4<br />
Gross profit 14.1 23.4 25.8 27.6 33.4 49.7 61.0 72.7<br />
EBITDA 14.8 12.9 15.0 12.9 17.4 24.5 29.5 36.3<br />
Net finance income (1.8) (2.0) (3.7) (0.6) (0.6) (2.1) (2.1) (2.4)<br />
Profit before Tax 11.9 7.8 11.6 16.7 17.9 23.4 24.7 30.6<br />
Taxation 0.9 3.0 1.6 2.0 4.5 6.0 6.3 7.8<br />
Profit after Tax 9.8 4.7 9.2 13.9 13.4 17.4 18.4 22.8<br />
Minorities 0.5 0.9 0.5 0.9 - - - -<br />
Attributable Income 9.4 3.8 8.7 12.9 13.4 17.4 18.4 22.8<br />
Weighted shares 176.1 159.2 159.2 159.2 192.3 193.0 193.0 193.0<br />
EPS (USc) 5.9 2.4 5.4 8.1 7.0 9.0 9.5 11.8<br />
Cash EPS (USc) 3.3 5.2 7.6 7.4 10.4 10.9 13.5 101.3<br />
DPS (USc) - - - - 1.4 2.4 3.2 2.6<br />
NAV per share (USc) 1.4 0.5 5.0 11.7 18.6 27.5 33.8 43.0<br />
Growth Ratios<br />
Sales growth (%) (36.45) 15.95 34.58 1.99 42.93 27.06 27.35 19.09<br />
Pre-interest profit growth (%) 21.16 (22.90) 36.87 (15.68) 36.13 32.62 23.15 22.98<br />
Earnings growth (%) 7.46 (58.97) 125.67 49.43 3.56 30.12 5.58 23.97<br />
Margins<br />
Gross margin (%) 41.6 59.6 48.8 51.3 43.3 50.8 49.0 49.0<br />
EBITDA margin (%) 43.8 32.8 28.3 24.0 22.6 25.0 23.7 24.5<br />
Pre-interest margin (%) 40.1 26.7 27.1 22.4 21.4 22.3 21.5 22.3<br />
Interest cover (times) 7.6 5.3 3.9 19.4 29.9 10.5 12.5 13.8<br />
Pre-tax profit margin (%) 35.1 19.9 22.0 31.1 23.2 23.9 19.8 20.6<br />
*Note: Financial figures for 2006 to 2008 were derived using the Old Mutual Implied Rate (OMIR), which<br />
may not reflect a true account due to variability of exchange rates during that period.<br />
64
Resilince in diversity<br />
TA Holdings is a <strong>Zimbabwe</strong> investment company<br />
whose portfolio spans insurance, agro-chemicals and<br />
hotels. Having had first hand expertise in virtually<br />
every business sector in the country, at one time or<br />
another, the company boasts one of the strongest<br />
and most experienced board of directors in the<br />
country.<br />
• Diversified earnings base<br />
TA’s diversified and expansive earnings base<br />
stretches across several sectors including<br />
agriculture, hotels/tourism, mining, insurance<br />
and industrial. Geographical diversity adds to<br />
the group’s attractiveness with a presence in<br />
Botswana, Malawi, Uganda and now Angola,<br />
making it a play on SSA.<br />
• Significant balance sheet outside <strong>Zimbabwe</strong><br />
The bulk (53%) of the group’s balance sheet is<br />
outside <strong>Zimbabwe</strong>, enhancing the group’s<br />
ability to weather downturns in any of the<br />
countries it operates in.<br />
• Cash generating businesses<br />
Generally, the insurance and hotel businesses<br />
are cash cows. The free cash generated has<br />
been used to invest in new projects and<br />
advance both horizontal and vertical<br />
integration. Local hotel properties are soon to<br />
be refurbished, in a renewed bid to benefit<br />
from <strong>Zimbabwe</strong>’s improving local eco-political<br />
situation<br />
• Asset base<br />
TA has a strong asset base and all its<br />
investments have good growth potential. The<br />
group’s investments are well poised for the<br />
recovery in the local economy. We believe that<br />
there is limited downside at current levels.<br />
Spec Buy.<br />
TA - volume vs price<br />
75<br />
-<br />
<strong>May</strong>-11 Oct-11 Mar-12<br />
Volume (m) RHS<br />
Price (USc) LHS<br />
1.75<br />
1.5<br />
1.25<br />
1<br />
0.75<br />
0.5<br />
0.25<br />
0<br />
BLOOMBERG: TAHLDS:ZH<br />
Spec Buy<br />
Current price (USc) 12.0<br />
Target price (USc)<br />
na<br />
Upside/Downside (%)<br />
na<br />
Liquidity<br />
Market Cap (US$m) 19.8<br />
Shares (m) 164.8<br />
Free float (%) 31.3<br />
Ave. daily vol ('000) 49.9<br />
Share price performance<br />
6 Months (%) (40.0)<br />
Relative change (%)* (33.2)<br />
12 Months (%) (23.8)<br />
Relative change (%)* 0.0<br />
*Relative to ZSE Industrial Index<br />
Financials (US$m)- FY 31 Dec 2011 <strong>2012</strong>F 2013F<br />
Turnover 62.1 77.6 93.1<br />
EBITDA 7.3 10.8 11.6<br />
Attributable earnings 4.6 6.9 8.1<br />
EPS (USc)<br />
STRENGTHS<br />
2.8<br />
WEAKNESSES<br />
4.2 4.9<br />
DPS Diversified (USc) amalgamation of Too -diversified ‐-conglomerate-feel<br />
NAV/share uncorrelated (USc) businesses<br />
massive 31.1 recapitalisation 31.1 needs 31.2<br />
EBITDA<br />
market<br />
margin<br />
leadership<br />
(%)<br />
in several areas Government<br />
11.8<br />
interference<br />
13.9<br />
in<br />
12.4<br />
Regional footprint<br />
fertilizer pricing<br />
Valuation<br />
Strong management<br />
Ratios<br />
PBV OPPORTUNITIES<br />
(x) THREATS 0.4 0.4 0.4<br />
PER Continued (x) regional expansion <strong>Exchange</strong> 4.3 rate risk 2.9 2.5<br />
Expansion of fertilizer plant capacity Competition in insurance<br />
Gearing (%) 5.5 5.6 5.7<br />
Increased insurance activities Slump in hotels business<br />
RoaA (%) Energy 2.3 price shocks 3.4 3.9<br />
RoaE (%) 0.9 1.1 1.2<br />
Source: IES<br />
EQUITY RESEARCH<br />
ZIMBABWE<br />
CONGLOMERATE<br />
STRENGTHS<br />
WEAKNESSES<br />
Diversified amalgamation of Too diversified - conglomerate feel<br />
uncorrelated businesses<br />
massive recapitalisation needs<br />
market leadership in several areas Government interference in<br />
Regional footprint<br />
fertilizer pricing<br />
Strong management<br />
OPPORTUNITIES<br />
THREATS<br />
Continued regional expansion <strong>Exchange</strong> rate risk<br />
Expansion of fertilizer plant capacitCompetition in insurance<br />
Increased insurance activities Slump in hotels business<br />
Energy price shocks<br />
65
Nature of business<br />
INSURANCE<br />
Botswana Insurance Company (BIC): A short-term insurer, acquired in 2003 at<br />
a total cost of US$ 13.0m. The claims ratio has been in the 53%-57% region<br />
over the past couple of years.<br />
Lion Assurance of Uganda: A short term insurance arm acquired in January<br />
2004 and is a subsidiary of Botswana Insurance Company. It has an 8% market<br />
share in Uganda.<br />
Zimnat Life Assurance: The fifth largest life assurance company in <strong>Zimbabwe</strong><br />
commanding a market share of 6% by gross premium. The long-term portfolio<br />
currently stands at approximately US$ 10.3m.<br />
Zimnat Lion: A short-term insurer and the second largest insurer by written<br />
gross premiums. TA is to recapitalise the short term insurer after having<br />
bought out the minorities by way of a share swap for TA shares.<br />
Aon: <strong>Zimbabwe</strong>’s largest insurance broker.<br />
Grand Reinsurance - Purchased the asset/liability book of Swiss Re<br />
(<strong>Zimbabwe</strong>) and rebranded to GrandRe. Its earnings have been dominated by<br />
investment income (property revaluation and exchange gains).<br />
MANUFACTURING<br />
Sable Chemicals - A 51% owned operation that has an electrolysis plant<br />
(ammonia manufacturing) and an ammonium nitrate (AN) plant. Installed<br />
capacity amounts to 240,000 metric tonnes per annum, however it is currently<br />
operating at below 40%. Due to aged technology the long term plan is coal<br />
gasification and in the interim the importation of ammonia will be scaled up.<br />
<strong>Zimbabwe</strong> Fertiliser Company (ZFC): An associate in which TA own 22.5%,<br />
the company manufactures and distributes fertiliser. ZFC sells 135,000 tonnes<br />
of fertiliser per annum, though production is dependent on availability of<br />
Ammonium Nitrate from Sable. Capacity utilisation is approximately 40%. The<br />
operations continue to be negatively impacted by the liquidity constraints as<br />
farmers are failing to access finance for the purchase of inputs.<br />
HOTELS<br />
The group owns and operates hotel investments in <strong>Zimbabwe</strong> & Botswana and<br />
has management contracts in Uganda, Zambia, Malawi and Ghana. Total room<br />
nights amount to 475,230 per annum, with approximately 45% being four-star.<br />
In <strong>Zimbabwe</strong> TA operates under the Cresta brand, which has a total of 442<br />
rooms. The local hotels break-even occupancy level is 30%. TA owns 40% of<br />
Cresta Marakanelo (Botswana), which owns and operates eight hotels and<br />
lodges in Botswana mostly in urban areas. Cresta Marakanelo is listed on the<br />
Botswana <strong>Stock</strong> <strong>Exchange</strong>.<br />
<strong>Overview</strong> of FY <strong>2012</strong> results<br />
TA reported an improved operating result to record an attributable profit of<br />
US$ 4.6m from a loss of US$ 6.4m. The turn around was driven by a strong<br />
performance from the external operations and fair value adjustments on<br />
property in <strong>Zimbabwe</strong>. Revenue contribution was evenly split between<br />
<strong>Zimbabwe</strong> and external operations. The external operations recorded a<br />
phenomenal 12.2 times growth in operating profits to US$ 3.8m while the<br />
<strong>Zimbabwe</strong> operations posted a loss of US$ 2.1m, flat on last year. The<br />
investment in PGI was reclassified from associate to a trade investment<br />
following the decision to disinvest and the cancellation of the JV with<br />
BancABC. Sables posted a reduced loss of US$ 0.1m from a loss of US$ 4.2m,<br />
benefiting from a reduced negotiated viable electricity tariff.<br />
TA Shareholding - Jan <strong>2012</strong><br />
Shareholding shares (m) %<br />
1 FMI Investments (Pvt 49.5 30.0%<br />
2 Old Mutual Life Assura 25.6 15.6%<br />
3 Edwards Nominees P/ 17.0 10.3%<br />
4 Remo Nominees P/L 14.7 8.9%<br />
5 L.E.S Nominees (Pvt) 12.7 7.7%<br />
6 Old Mutual <strong>Zimbabwe</strong> 6.4 3.9%<br />
7 Waughco Nominees P 4.3 2.6%<br />
8 Local Authorities Pens 3.5 2.1%<br />
9 Stanbic Nominees P/L 3.0 1.8%<br />
10 Triedward Investment 2.2 1.3%<br />
TA HOLDINGS LIMITED<br />
INSURANCE<br />
Grand<br />
Reinsurance<br />
Zimnat Life Ass.<br />
100% ‐ Life Assurance<br />
Lion Assurance Uganda<br />
58.3% ‐ Life insurance<br />
Zimnat Asset Mgt<br />
100% ‐ Asset Mgt co.<br />
Botswana Insurance<br />
Co<br />
Zimnat Lion Insurance<br />
100% ‐ Short term insurance<br />
AON (Pvt) Ltd<br />
30.0% ‐ Insurance brokers<br />
HOSPITALITY<br />
Cresta Hospitality<br />
100% ‐ Hospitality and Leisure<br />
Cresta Hotels<br />
100% ‐ Hospitality and<br />
Cresta Marakanelo<br />
40% - Hospitality and Leisure<br />
AGRO-INDUSTRIAL<br />
Sable Chemical<br />
industries<br />
51% F tili f<br />
<strong>Zimbabwe</strong> Fertilizer.<br />
Co<br />
INVESTMENT<br />
TA INVESTMENTS &<br />
CONSULTANTS ET AL<br />
Cash generation improved with cash generated from operations turning<br />
66
positive. The gearing ratio was slightly up at 5.5% from<br />
5.1%.<br />
The group was streamlined and restructured.<br />
Approximately US$ 1.6m was used for retrenchment<br />
costs for the <strong>Zimbabwe</strong>an operations. Management<br />
stated that the long term solution for the local<br />
fertilizer industry is coal gasification and in the interim<br />
the company will increase the importation of<br />
ammonia. TA’s Botswana operations remain<br />
profitable and in our view, good investments. Local<br />
hotel and insurance operations performances<br />
continue to improve.<br />
Valuation and Recommendation<br />
We believe that there is limited downside at<br />
current levels. Spec Buy.<br />
TA HOLDINGS - 5 YEAR CGR COMPARISON<br />
31 DECEMBER (US$m) 2006 2007 2008 2009 2010 2011 <strong>2012</strong>F 2013F<br />
Balance sheet<br />
Shareholders' equity 22.1 37.2 27.8 62.6 48.1 51.2 51.3 51.4<br />
Minorities 6.5 11.7 6.3 8.7 10.1 11.4 13.1 15.0<br />
Total shareholders' equity 43.4 70.6 39.2 89.1 77.2 85.5 90.6 96.3<br />
Interest Bearing Debt 4.9 4.5 0.8 3.3 2.4 2.8 2.9 2.9<br />
Current Liabilities 18.5 36.6 40.5 79.2 47.2 50.4 69.6 85.0<br />
Total Liabilities and equity 66.9 111.7 80.5 171.6 126.9 138.8 163.0 184.2<br />
Fixed Assets 8.0 8.9 0.1 15.4 15.4 17.8 20.3 21.8<br />
Investments 45.8 73.0 0.0 75.7 62.1 51.4 56.5 59.3<br />
Cash 5.9 7.9 0.1 13.0 17.1 - - -<br />
Current Assets 13.1 29.8 80.4 80.5 49.4 69.6 86.2 103.1<br />
Total Assets 66.9 111.7 80.5 171.6 126.9 138.8 163.0 184.2<br />
Income Statement<br />
Turnover 37.6 36.9 16.8 41.8 52.2 62.1 77.6 93.1<br />
Pre-interest profit 14.0 15.9 0.9 1.9 0.3 7.3 10.8 11.6<br />
Interest Income (0.7) (0.7) 0.2 (0.3) (0.5) (0.6) (0.4) (0.4)<br />
Associate Profit 0.7 1.1 6.6 (2.1) (4.4) 0.4 (1.8) (1.8)<br />
Pre-tax Profit 14.1 16.4 7.7 (0.5) (4.6) 7.2 8.6 9.4<br />
Taxation 1.9 3.3 2.3 0.9 0.5 0.9 0.9 0.9<br />
Minorities 2.3 2.7 0.0 1.1 1.2 1.7 0.8 0.4<br />
Attributable Income 9.7 10.3 5.3 (2.5) (6.3) 4.6 6.9 8.1<br />
Shares in issue (m)<br />
EPS (USc) 5.9 6.3 3.2 (1.5) (3.8) 2.8 4.2 4.9<br />
DPS (USc) 0.7 0.0 2.9 0.0 0.0 0.0 0.0 0.0<br />
NAV per share (USc) 13.4 22.6 16.9 38.0 29.1 31.0 31.1 31.1<br />
Growth Ratios<br />
Sales growth (%) (34.2) (1.7) (54.6) 149.1 24.8 19.0 25.0 20.0<br />
Pre-interest profit growth (% (12.3) 13.7 (94.4) 107.0 (82.4) 2,145.7 46.9 7.1<br />
Earnings growth (%) 2.5 5.8 (48.4) (147.2) 150.2 (173.7) 48.3 17.1<br />
Margins<br />
Pre-interest margin (%) 37.3 43.2 5.4 4.5 0.6 11.8 13.9 12.4<br />
Interest cover (times) 20.4 22.8 (4.3) 6.8 0.7 12.2 24.9 26.1<br />
Pre-tax profit margin (%) 37.4 44.4 45.8 (1.2) (8.7) 11.6 11.1 10.1<br />
*Note: Historic financials are from Company annual reports<br />
67
EQUITY RESEARCH<br />
ZIMBABWE<br />
A season to re-build<br />
All sharks want a bite of the “value”…<br />
In recent years, we have witnessed Implats going full steam<br />
ahead with its expansion at Zimplats in the face of looming<br />
indigenisation demands. Most analysts (including ourselves)<br />
were of the opinion that Implats was managing this threat<br />
through various agreements that were entered into with<br />
the government of <strong>Zimbabwe</strong> in yester-years. However,<br />
what seemingly began as a threat is now being executed.<br />
Besides demanding a 51.0% stake in foreign owned mines,<br />
<strong>Zimbabwe</strong>an authorities have also raised taxation and<br />
royalty fees. Simply put, <strong>Zimbabwe</strong>’s indigenisation<br />
legislations imply that its shareholders (Implats and other<br />
minorities) must reduce their stakes to a combined 49.0%.<br />
• The share price has suffered<br />
Clearly, Zimplats has been tainted by the country’s<br />
political problems. Of course, political actors and the<br />
media can be held accountable here. The share price<br />
has de-rated to about AUD 10.00 from historic highs of<br />
AUD 13.00.<br />
• Uncertainty persists but the stock remains<br />
fundamentally undervalued<br />
We have valued Zimplats using a DCF approach which<br />
yielded a target price of USD 15.00, indicating 46.1%<br />
potential upside. On the other hand, our comparative<br />
analysis shows that Zimplats is trading on a stand-out<br />
mark to market 5.7x 2013 PER. This represents a<br />
significant discount to peers (average of 20.7x). We<br />
are still convinced that Zimplats has the potential to<br />
create material additional value for shareholders in<br />
the long term. BUY.<br />
MINING<br />
BLOOMBERG:ZIM:AU<br />
BUY<br />
Current price (AUD) 10.27<br />
Current price (USD) 10.41<br />
Target price (USD) 15.0<br />
Upside/Downside 46.1%<br />
Liquidity<br />
Market Cap (USDm) 1,120.4<br />
Shares (m) 107.6<br />
Free float (%) 11%<br />
Ave. daily vol ('000) 14.0<br />
Share Price Performance<br />
6 Months (%) 11.40 -9.9%<br />
Relative change (%)* -6.9%<br />
12 Months (%) 12.45 -17.5%<br />
Relative change (%)* -0.8%<br />
*Relative to MSCI Frontier Market Index<br />
Financials (USDm)-FY 30 June 2011 <strong>2012</strong>F 2013F<br />
Revenue 527.4 515.0 631.5<br />
EBITDA 278.2 253.4 309.0<br />
Attributable earnings 200.4 159.6 197.2<br />
EPS (USD) 1.9 1.5 1.8<br />
DPS (USD) - - -<br />
NAV/share (USD) 6.9 8.7 10.2<br />
Ratios 2011 <strong>2012</strong>F 2013F<br />
Gearing 5.1% 4.1% 3.5%<br />
RoaA 22.4% 14.7% 15.3%<br />
RoaE 31.4% 19.0% 19.3%<br />
EV/EBITDA (x) 3.1 3.1 2.3<br />
EV/4E oz(USD) 2,351.8 2,102.3 1,531.5<br />
PBV (x) 1.5 1.2 1.0<br />
PER (x) 5.6 7.0 5.7<br />
Earnings Yield 18% 14% 18%<br />
Dividend Yield - - -<br />
EBITDA Margin 52.8% 49.2% 48.9%<br />
Zimplats - volume vs price<br />
20.00<br />
16.00<br />
12.00<br />
8.00<br />
4.00<br />
-<br />
Jul-09 Feb-10 Sep-10 Apr-11 Nov-11<br />
Volume-RHS Price-LHS<br />
300,000<br />
250,000<br />
200,000<br />
150,000<br />
100,000<br />
50,000<br />
-<br />
STRENGTHS<br />
WEAKNESSES<br />
Low gearing of 5.4% enables the group to fund Weak PGM prices directly impact revenues- Eurozone<br />
future expansion projects through debt.<br />
Crisis presents a stumbling block.<br />
Defensive - PGMs core business<br />
Low grade ore (3.4g/ tonne of ore)<br />
Technical & strategic support from parent company,<br />
Impala Platinum eg Refining through Impala Refineries<br />
Shallow depth of ore (100-1,500m max-depth)<br />
The underground mines are operating at full capacity<br />
OPPORTUNITIES<br />
THREATS<br />
Ngezi Phase II and III Expansion Projects<br />
Slump in PGM prices as a result of slow global economic<br />
Increased emerging markets demand for automobiles recovery<br />
may drive PGM prices up.<br />
Indigenisation issues leading to weak share price.<br />
Regulatory environment i.e. APT<br />
Mining rights ownership risks<br />
High electricity tariffs could squeeze margins<br />
Skills flight to neighbouring countries.<br />
Source: IES<br />
68
Nature of business<br />
Zimplats Holdings Limited is a mining group which explores for and<br />
produces platinum group metals (PGMs) in <strong>Zimbabwe</strong>. The<br />
company's exploration projects include Ngezi South and North,<br />
Hartley Platinum and Selous. It is a company incorporated in<br />
Guernsey, British Isles and is listed on the Australian <strong>Stock</strong><br />
<strong>Exchange</strong> (ASX). Zimplats is 87% owned by Impala Platinum<br />
Holdings (IMP: SJ) of South Africa. It operates from two main sites<br />
(Ngezi and Selous) and employs underground mining techniques<br />
(board and pillar method) to extract PGMs. We note that six metals<br />
(Platinum, Palladium, Gold, Rhodium, Nickel and Lithium)<br />
contribute c99% of total revenues whilst other metals contribute<br />
1.0%.<br />
Group Structure<br />
Zimplats has a vision to be the leading platinum company in<br />
<strong>Zimbabwe</strong>, producing 1.0m platinum oz per annum. In line with its<br />
vision the company has embarked on a phased expansion drive to<br />
ramp up production levels. For example, the Phase II project which<br />
is currently underway is the second stage in a series of planned<br />
expansions to grow the business.<br />
Zimplats currently has three underground mines<br />
It is worth noting that Zimpats has shifted away from open pit<br />
mining and now employs underground mining through its three<br />
mines (Ngwarati, Rukodzi and Bimha Mine). Ngwarati and Rukodzi<br />
Mine have a combined capacity in the region of 2.2mtpa whereas<br />
the new Bimha Mine has a capacity of around 2.0mtpa. This implies<br />
that the group currently has an estimated capacity of 4.2m tonnes<br />
of ore per annum. However, the Phase II expansion project is<br />
expected to add another 2.0mtpa through the Mupfuti Mine (Portal<br />
3).<br />
Zimplats also operates two concentrators at Ngezi and the Selous<br />
Metallurgical Complex (SMC) with a combined capacity of 4.2mtpa.<br />
The concentrators are currently operating at full capacity.<br />
Furthermore, Zimplats also has a smelter at the SMC with the<br />
capacity to process 6.2mtpa of concentrate.<br />
Refining is done through parent company’s Impala Refinery<br />
Services (IRS). Of the 4.2m tonnes of ore that is mined, c3.0%<br />
(127,000 tonnes) is the concentrate. This gives about 7,500 tonnes<br />
of white matte that is then exported to South Africa to a Base<br />
Metal Refinery (Impala Refinery Services). Zimplats receives<br />
approximately 90% of the value of PGMs and 80% of the value of<br />
base metals from IRS. Management has indicated that the group is<br />
currently evaluating the possibility of commissioning a refinery.<br />
<strong>Overview</strong> of Q3 2011 results<br />
Improved quarterly performance<br />
Zimplats recently issued its Q3 <strong>2012</strong> financial results showing 32%<br />
q-o-q revenue growth to US$ 28.0m. However, revenues were down<br />
2.0% y-o-y. We attribute the surge in quarterly earnings to<br />
improved metal prices compared to Q2 <strong>2012</strong>.<br />
Zimplats: Operational Indicators<br />
1,800<br />
1,600<br />
1,400<br />
1,213<br />
1,200<br />
1,000<br />
878<br />
800<br />
644<br />
600<br />
400<br />
200<br />
1,555<br />
630<br />
1,169<br />
1,432<br />
1,395<br />
3.50<br />
3.45<br />
3.40<br />
3.35<br />
3.30<br />
3.25<br />
3.20<br />
3.15<br />
3.10<br />
Mining production was adversely affected by illegal industrial<br />
actions<br />
An industrial action at Zimplats led to a loss of two and a half<br />
production shifts during Q3 <strong>2012</strong>. As a result, a tonne mined at<br />
1,125,000 was 1.0% below Q2 <strong>2012</strong>, although it was up 6.0% y-o-y.<br />
The head grade at 3.33g/t was satisfactory at 1.0% above Q2 <strong>2012</strong>.<br />
Tonnes of ore milled at 1,069,000 were 4.0% lower than Q2 <strong>2012</strong><br />
-<br />
2005 2006 2007 2008 2009 2010 2011 <strong>2012</strong>F<br />
Gross revenue per 4E oz (USD) Cash cost per 4E oz (USD) Ore head grade (g/t)<br />
Source: IAS/Company Reports<br />
3.05<br />
69
(up 6.0% y-o-y) owing to scheduled major plant<br />
maintenance shutdowns. Overall, production dropped by<br />
2.0% to 90,557oz q-o-q (up 8.0% y-o-y) on the back of<br />
illegal strikes and power outages which affected<br />
operations at the mine's platinum matte furnace.<br />
An increase in cash costs<br />
Operating costs surged 18.0% y-o-y to US$ 76.4m from US$<br />
64.9m in Q3:2011. We note that the cost performance for<br />
Q3 <strong>2012</strong> was worse than the same period last year due to<br />
significant increases in electricity and employment costs.<br />
Furthermore, the company’s local spend (including<br />
payments to government and related institutions)<br />
increased by 6.0% to 69% of total payments in Q3 <strong>2012</strong>.<br />
Consequently, cash cost of production per 4E oz was 1.0%<br />
higher than Q2 <strong>2012</strong> and 12.0% higher that Q3 <strong>2012</strong>,<br />
driven mainly by lower 4E production. Overall, operating<br />
profit for the quarter amounted to US$ 51.9m.<br />
Outlook<br />
Strong commodity prices to boost cash flows<br />
While platinum in particular remains exposed to downside<br />
risks related to economic issues in the euro zone, we<br />
remain bullish on the long term outlook for PGMs as<br />
demand is likely to be dominated by the expected<br />
commodity requirements stemming from projected<br />
economic growth in China, India and importantly the N-11<br />
(Next 11 emerging economies). Furthermore, a rise in<br />
investor appetite for precious metals should support<br />
platinum and palladium prices. We expect platinum prices<br />
to trade in a range of US$ 1,470/ oz ounce to US$<br />
1,770/oz this year, and palladium to trade between US$<br />
575/oz to USD775/oz. This compares with a 2011 trading<br />
range of US$ 1,350/oz to US$ 1,890/oz in platinum and<br />
US$ 549/oz to US$ 858/oz in palladium.<br />
Underlying fundamentals in favor of palladium<br />
In 2011, platinum's surplus eased 12.5% to 735,000z, as a<br />
7.0% increase in global fabrication demand outweighed a<br />
near 5.0% rise in global platinum supply. Meanwhile,<br />
palladium's supply shortfall dropped by almost 50% in<br />
2011, with the market recording a 313,000oz deficit,<br />
compared with a shortfall of 587,000oz the previous year.<br />
We are therefore seeing gross deficits on palladium versus<br />
surpluses and growing stocks of platinum. However, we<br />
think investor sentiment is unlikely to swing dramatically<br />
enough in palladium's favor in <strong>2012</strong> to warrant a closer<br />
proximity between the two metal's prices.<br />
Despite the noise on indigenisation issues, strong<br />
organic growth is likely to continue beyond the<br />
near-term<br />
Zimplats boasts a +200moz (4E) minerals inventory<br />
and is capable of growing to at least 1.0moz Pt pa in<br />
the longer-term. The group is in the midst of its<br />
Phase II expansion project that will see production<br />
move from at least 180koz Pt p.a. to at least 270k oz<br />
p.a.. Nonetheless, we believe that continued<br />
investment in this type of infrastructure requires a<br />
resolution of issues such as indigenisation and<br />
assurance of stability thereafter. Clarity regarding<br />
security of tenure is also a pre-requisite in our view,<br />
to any form of material mining investment, in any<br />
jurisdiction.<br />
In line with the company’s production increase<br />
project, we expect total ore mined in FY 2013 to be<br />
in the region of 4.6m tonnes. Applying a conservative<br />
selling price of US$ 1,409/4E oz on our projected 4E<br />
matte volume of 448,104oz would imply revenues of<br />
US$ 631.5m in FY 2013. Based on these estimates, we<br />
project after tax earnings to be around US$ 197.2m.<br />
out of South Africa is likely to propel PGM prices.<br />
Valuation and Recommendation<br />
We have valued Zimplats using a DCF valuation<br />
approach. Our model assumes that mined tonnage<br />
will increase to about 6.0m tonnes by FY 2015 as the<br />
Phase II expansion project reaches completion. Our<br />
model also assumes that Phase III will kick in soon<br />
after and mined tonnage will increase to c8.4m by FY<br />
2019. We have derived a WACC of 20.0% and applied<br />
a country risk premium of <strong>Zimbabwe</strong> of 15.0%.<br />
Furthermore, our model places a 60.3% weighting on<br />
the terminal value (TV) given the massive minerals<br />
inventory of >200moz (4E).<br />
On the other hand, our comparative analysis shows<br />
that Zimplats is trading on a stand out mark to<br />
market 5.7x 2013 PER (based on our estimates). This<br />
represents a significant discount to peers (average of<br />
20.7x). We think Zimplats has the potential to create<br />
material additional value for shareholders. The<br />
share price has taken a knock on indigenisation<br />
concerns. Our valuation methodology yielded a<br />
target price of US$ 15.00, indicating 46.1% potential<br />
upside. BUY.<br />
70
ZIMPLATS- 5 YEAR CAGR COMPARISON<br />
30 JUNE (USDm) 2006 2007 2008 2009 2010 2011 <strong>2012</strong>F 2013F 5yr CAGR<br />
Income Statement (USDm)<br />
Turnover 162.4 236.0 294.3 120.3 404.0 527.4 515.0 631.5 27%<br />
Platinum 84,755 102,253 153,868 81,807 233,929 284,991 298,217 365,684 27%<br />
Paladium 19,186 23,771 28,690 12,995 53,658 98,347 172,697 211,767 39%<br />
Gold 4,759 6,071 8,159 8,179 19,902 26,636 100,009 122,634 41%<br />
Rhodium 28,774 42,474 63,245 (1,985) 33,385 30,030 57,915 71,017 1%<br />
Nickel 19,559 52,655 31,509 14,835 48,418 66,135 33,539 41,126 28%<br />
Other 5,413 8,743 8,786 4,480 14,661 21,215 19,422 23,816 31%<br />
Gross Profit 73.8 138.2 172.4 14.9 232.0 323.1 293.5 353.6 34%<br />
Profit/(loss) before tax 57.3 117.4 145.5 (26.0) 166.6 236.1 220.2 272.0 33%<br />
Taxation (9.5) (17.8) (21.1) 1.0 (44.5) (35.7) (60.5) (74.8) 30%<br />
Profit/(loss) after tax 47.7 99.6 124.4 (25.0) 122.1 200.4 159.6 197.2 33%<br />
Attributable to minority interests - - - - - - - -<br />
Profit/(loss) attributable to shareholders 47.7 99.6 124.4 (25.0) 122.1 200.4 159.6 197.2 33%<br />
Balance Sheet (USDm)<br />
Assets<br />
Non Current Assets 188.2 228.6 371.6 529.9 592.1 681.9 831.2 926.9 29%<br />
Current assets 108.1 176.8 227.0 120.4 220.7 293.5 366.8 458.5 22%<br />
Total Assets 296.2 405.5 598.5 650.3 812.8 975.4 1,198.1 1,385.4 27%<br />
Capital and reserves 230.6 329.4 442.7 415.2 539.0 739.4 939.8 1,100.7 26%<br />
Non-current liabilities 31.2 34.0 108.3 150.6 183.8 142.8 146.5 150.5 36%<br />
Current liabilities 34.5 42.1 47.5 84.5 90.0 93.2 111.8 134.2 22%<br />
Total Equity and Liabilities 296.2 405.5 598.5 650.3 812.8 975.4 1,198.1 1,385.4 27%<br />
Ratios<br />
EPS (USD) 0.4 0.9 1.2 (0.2) 1.1 1.9 1.5 1.8<br />
NAV (USD) 2.1 3.1 4.1 3.9 5.0 6.9 8.7 10.2<br />
Gearing 1.0% 0.0% 12.9% 23.0% 19.6% 5.1% 4.1% 3.5%<br />
RoaA 18.6% 28.4% 24.8% -4.0% 16.7% 22.4% 14.7% 15.3%<br />
RoaE 23.0% 35.6% 32.2% -5.8% 25.6% 31.4% 19.0% 19.3%<br />
EV/EBITDA 15.5 7.0 5.6 - 5.1 3.1 3.1 2.3<br />
EV/4E oz 5,491 4,848 5,041 5,749 2,873 2,352 2,102 1,531<br />
Current Ratio 3.14 4.20 4.78 1.43 2.45 3.15 3.28 3.42<br />
DPS - - - - - - - -<br />
Dividend Yield - - - - - - - -<br />
Margins<br />
OP Margin 35.1% 48.6% 49.4% -20.7% 42.8% 46.4% 43.2% 43.4%<br />
PBT Margin 35.2% 49.8% 49.5% -21.6% 41.2% 44.8% 42.8% 43.1%<br />
PAT Margin 29.4% 42.2% 42.3% -20.8% 30.2% 38.0% 31.0% 31.2%<br />
EBITDA Margin 40.4% 57.3% 57.6% -3.0% 48.6% 52.8% 49.2% 48.9%<br />
71
Contacts<br />
General<br />
Sean Gammon<br />
Director<br />
Direct +263 4 791 874<br />
Moblie +263 772 205 937<br />
Email<br />
sean.gammon@imara.co<br />
Sales Trading<br />
Tino Kambasha<br />
Head<br />
Direct +263 4 791 593<br />
Mobile +263 772 572 110<br />
Email<br />
tino.kambasha@imara.co<br />
Dealing<br />
Thedias Kasaira<br />
Dave Markham<br />
Director<br />
Dealer<br />
Direct +263 4 792 064 Direct +263 4 792 064<br />
Mobile +263 772 600 562 Mobile +263 772 924 269<br />
Email thedias.kasaira@imara.co Email dave.markham@imara.co<br />
Sebastian Gumbo<br />
Dealer<br />
Direct +263 4 792 064<br />
Mobile +263 772 600 323<br />
Email<br />
sebastian.gumbo@imara.co<br />
Analysts<br />
Tel +263 4 700 000/<br />
+263 4 790 403<br />
Addmore Chakurira +263 772 265 454<br />
Email<br />
addmore.chakurira@imara.co<br />
Batanai Matsika +263 772 889 556<br />
Email<br />
batanai.matsika@imara.co<br />
Nontando Sibanda-Zunga +263 772 772 755<br />
Email<br />
nontando.zunga@imara.co<br />
72
Notes<br />
<strong>Imara</strong> Africa<br />
Securities<br />
(A division of<br />
<strong>Imara</strong> SP Reid)<br />
<strong>Imara</strong> House,<br />
Block 3<br />
257 Oxford<br />
Road<br />
Illovo<br />
Johannesburg<br />
2146<br />
South Africa<br />
Tel:<br />
+27115506200<br />
Fax:<br />
+2711 550<br />
6295<br />
<strong>Imara</strong><br />
Securities<br />
Angola SCVM<br />
Limitada<br />
Rua Rainha<br />
Ginga 74, 13 th<br />
Floor,<br />
Luanda,<br />
Angola<br />
Tel:<br />
+244222372029<br />
/36<br />
Fax:<br />
+244222332340<br />
<strong>Imara</strong> Capital<br />
Securities<br />
Ground Floor<br />
Plot 64511<br />
Showgrounds<br />
Gaborone<br />
Botswana<br />
Tel: +267<br />
3188886<br />
Fax +267<br />
3188887<br />
Members of the<br />
Botswana <strong>Stock</strong><br />
<strong>Exchange</strong><br />
<strong>Imara</strong> Edwards<br />
Securities (Pvt.) Ltd.<br />
Tendeseka Office<br />
Park<br />
1 st Floor Block 2<br />
Samora Machel<br />
Avenue<br />
Harare, <strong>Zimbabwe</strong><br />
Tel: +263 4 790590<br />
Fax: +263 4 791435<br />
4 Fanum House<br />
Cnr. Leopold<br />
Takawira/Josiah<br />
Tongogara Street<br />
Bulawayo<br />
Tel: +263 9 74554<br />
Fax: +263 9 66024<br />
Members of the<br />
<strong>Zimbabwe</strong> <strong>Stock</strong><br />
<strong>Exchange</strong><br />
<strong>Imara</strong> S P Reid<br />
(Pty) Ltd<br />
<strong>Imara</strong> House<br />
257 Oxford Road<br />
Illovo 2146<br />
P.O. Box 969<br />
Johannesburg<br />
2000<br />
South Africa<br />
Tel:<br />
+27 11 550 6200<br />
Fax:<br />
+27 11 550 6295<br />
Members of the<br />
JSE Securities<br />
<strong>Exchange</strong><br />
<strong>Stock</strong>brokers<br />
Malawi Ltd<br />
Able House<br />
Cnr. Hanover<br />
Avenue/<br />
Chilembwe Road<br />
Blantyre<br />
Malawi<br />
Tel:<br />
+265 1822803<br />
Members of the<br />
Malawi <strong>Stock</strong><br />
<strong>Exchange</strong><br />
Namibia<br />
Equity<br />
Brokers (Pty)<br />
Ltd<br />
1st Floor City<br />
Centre<br />
Building, West<br />
Wing<br />
Levinson<br />
Arcade<br />
Windhoek<br />
Namibia<br />
Tel:<br />
+264 61246666<br />
Fax:<br />
+264 61256789<br />
Members of<br />
the<br />
Namibia <strong>Stock</strong><br />
<strong>Exchange</strong><br />
<strong>Stock</strong>brokers<br />
Zambia Ltd<br />
2nd Floor,<br />
Design<br />
House<br />
P O Box 38956<br />
Lusaka<br />
Zambia<br />
Tel:<br />
+260 1227303<br />
Fax:<br />
+2601221055<br />
Members of<br />
the<br />
Lusaka<br />
<strong>Stock</strong> <strong>Exchange</strong><br />
This research report is not an offer to sell or the solicitation of an offer to buy or subscribe for any securities. The securities referred to in this report may not be<br />
eligible for sale in some jurisdictions. The information contained in this report has been compiled by <strong>Imara</strong> Edwards Securities (Pvt.) Ltd. (“<strong>Imara</strong>”) from sources that it<br />
believes to be reliable, but no representation or warranty is made or guarantee given by <strong>Imara</strong> or any other person as to its accuracy or completeness. All opinions and<br />
estimates expressed in this report are (unless otherwise indicated) entirely those of <strong>Imara</strong> as of the date of this report only and are subject to change without notice.<br />
Neither <strong>Imara</strong> nor any other member of the <strong>Imara</strong> group of companies including their respective associated companies (together “Group Companies”), nor any other<br />
person, accepts any liability whatsoever for any loss howsoever arising from any use of this report or its contents or otherwise arising in connection therewith. Each<br />
recipient of this report shall be solely responsible for making its own independent investigation of the business, financial condition and prospects of companies referred<br />
to in this report. Group Companies and their respective affiliates, officers, directors and employees, including persons involved in the preparation or issuance of this<br />
report may, from time to time (i) have positions in, and buy or sell, the securities of companies referred to in this report (or in related investments); (ii) have a<br />
consulting, investment banking or broking relationship with a company referred to in this report; and (iii) to the extent permitted under applicable law, have acted<br />
upon or used the information contained or referred to in this report including effecting transactions for their own account in an investment (or related investment) in<br />
respect of any company referred to in this report, prior to or immediately following its publication. This report may not have been distributed to all recipients at the<br />
same time. This report is issued only for the information of and may only be distributed to professional investors (or, in the case of the United States, major US<br />
institutional investors as defined in Rule 15a-6 of the US Securities <strong>Exchange</strong> Act of 1934) and dealers in securities and must not be copied, published or reproduced or<br />
redistributed (in whole or in part) by any recipient for any purpose.<br />
© <strong>Imara</strong> Edwards Securities <strong>2012</strong><br />
73