Imara Sub Saharan Africa Telecoms Report Riding high on Africa's ...
Imara Sub Saharan Africa Telecoms Report Riding high on Africa's ...
Imara Sub Saharan Africa Telecoms Report Riding high on Africa's ...

You also want an ePaper? Increase the reach of your titles
YUMPU automatically turns print PDFs into web optimized ePapers that Google loves.
<str<strong>on</strong>g>Imara</str<strong>on</strong>g> <str<strong>on</strong>g>Sub</str<strong>on</strong>g> <str<strong>on</strong>g>Saharan</str<strong>on</strong>g> <str<strong>on</strong>g>Africa</str<strong>on</strong>g> <str<strong>on</strong>g>Telecoms</str<strong>on</strong>g> <str<strong>on</strong>g>Report</str<strong>on</strong>g><br />
<str<strong>on</strong>g>Riding</str<strong>on</strong>g> <str<strong>on</strong>g>high</str<strong>on</strong>g> <strong>on</strong> <str<strong>on</strong>g>Africa</str<strong>on</strong>g>'s booming data market...<br />
September 2011<br />
Analyst<br />
Batanai Matsika<br />
+263 772 889 556<br />
batanai.matsika@imara.co<br />
www.imara.co
CONTENTS<br />
PAGE<br />
<str<strong>on</strong>g>Sub</str<strong>on</strong>g> <str<strong>on</strong>g>Saharan</str<strong>on</strong>g> <str<strong>on</strong>g>Africa</str<strong>on</strong>g> <str<strong>on</strong>g>Telecoms</str<strong>on</strong>g>- Fast Facts……………………………………………………………………………………………………………………… 2<br />
Global Teleph<strong>on</strong>y Industry………………………………………………………………………………………………………………………………………………4<br />
Trends in the SSA <str<strong>on</strong>g>Telecoms</str<strong>on</strong>g> Sector…………………………………………………………………………………………………………………………………4<br />
Relative Valuati<strong>on</strong> Matrix for SSA <str<strong>on</strong>g>Telecoms</str<strong>on</strong>g>……………………………………………………………………………………………………………………10<br />
SSA <str<strong>on</strong>g>Telecoms</str<strong>on</strong>g> Comparative Graphs…………………………………………………………………………………………………………………………………11<br />
Company <str<strong>on</strong>g>Report</str<strong>on</strong>g>s<br />
Ec<strong>on</strong>et Wireless Zimbabwe……………………………………………………………………………………………………………………………………….. 12<br />
Nature of Operati<strong>on</strong>s…………………………………………………………………………………………………….…………………………………………………13<br />
Market Dynamics………………………………………………………………………………………………………………………………………………………………13<br />
Operati<strong>on</strong>al Review…………………………………………………………………………………………………………………………………………………………14<br />
Outlook, Valuati<strong>on</strong> and Recommendati<strong>on</strong>………………………………………………………………………………………………………………………14<br />
MTN Group………………………………………………………………………………………………………………………………………………………………………16<br />
Nature of Operati<strong>on</strong>s………………………………………………………………………………………………………………………………………………………17<br />
Market Dynamics………………………………………………………………………………………………………………………………………………………………17<br />
Operati<strong>on</strong>al Review…………………………………………………………………………………………………………………………………………………………17<br />
Outlook and Comment………………………………………………………..………………………………………………………………………………………… 18<br />
ONATEL SA………………………………………………………………………………………………………………………………………………………………………20<br />
Nature of Operati<strong>on</strong>s………………………………………………………………………………………………….……………………………………………………21<br />
Market Dynamics…………………………………………………………………………………………………...………………………………………………………21<br />
Operati<strong>on</strong>al Review……………………………………………………………………………………………...…………………………………………………………22<br />
Outlook, Valuati<strong>on</strong> and Recommendati<strong>on</strong>………………………………………………………………………………………………………………………22<br />
Safaricom…………………………………………………………………………………………………………………………………………………………………………24<br />
Nature of Operati<strong>on</strong>s……………………………………………………………………………………………………………..………………………………………25<br />
Market Dynamics…………………………………………………………………………………………………………………………………..…………………………25<br />
Operati<strong>on</strong>al Review……………………………………………………………………………………………………………………………...…………………………26<br />
Outlook, Valuati<strong>on</strong> and Recommendati<strong>on</strong>…………………………………………………………………………….……………………………………… 26<br />
SONATEL SA……………………………………………………………………………………………………………………...……………………………………………28<br />
Nature of Operati<strong>on</strong>s……………………………………………………………………………………………………………………………………..………………29<br />
Market Dynamics………………………………………………………………………………………………………………………………………...…………………29<br />
Operati<strong>on</strong>al Review…………………………………………………………………………………………………………………………………………….……………30<br />
Outlook, Valuati<strong>on</strong> and Recommendati<strong>on</strong>………………………………………………………………………………………….………………………… 30<br />
TNM Malawi…………………………………………………………………………………………………………………………………………………………………… 32<br />
Nature of Operati<strong>on</strong>s………………………………………………………………………………………………………………………………………………...……33<br />
Market Dynamics…………………………………………………………………………………………………………………………………………………..…………33<br />
Operati<strong>on</strong>al Review…………………………………………………………………………………………………………………………………………….……………34<br />
Outlook, Valuati<strong>on</strong> and Recommendati<strong>on</strong>……………………………………………………………………………………………………..………………34<br />
Vodacom Group………………………………………………………………………………………………………………………………………………………………36<br />
Nature of Operati<strong>on</strong>s………………………………………………………………………………………………………………………………………………..……37<br />
Market Dynamics………………………………………………………………………………………………………………………………………………...…………37<br />
Operati<strong>on</strong>al Review………………………………………………………………………………………………………………………………………...………………38<br />
Outlook and Comment…………………………………………………………………………………………………………………………………………...………38<br />
<str<strong>on</strong>g>Imara</str<strong>on</strong>g> C<strong>on</strong>tact Details…………………………………………………………………………………………………………………………………………………… 40<br />
Appendix to Abbreviati<strong>on</strong>s:<br />
ACE<br />
: <str<strong>on</strong>g>Africa</str<strong>on</strong>g> Coast to Europe<br />
ADSL<br />
: Asymmetric Digital <str<strong>on</strong>g>Sub</str<strong>on</strong>g>scriber Line<br />
ARPU<br />
: Average Revenue Per User<br />
BRVM<br />
: Bourse Régi<strong>on</strong>ale des Valeurs Mobiliѐrs<br />
C<br />
: circa<br />
CCK<br />
: Communicati<strong>on</strong>s Commissi<strong>on</strong> of Kenya<br />
EAC<br />
: East <str<strong>on</strong>g>Africa</str<strong>on</strong>g>n Community<br />
EASSy<br />
: East <str<strong>on</strong>g>Africa</str<strong>on</strong>g>n <str<strong>on</strong>g>Sub</str<strong>on</strong>g>marine Systems<br />
GDP<br />
: Gross Domestic Product<br />
IAS<br />
: <str<strong>on</strong>g>Imara</str<strong>on</strong>g> <str<strong>on</strong>g>Africa</str<strong>on</strong>g> Securities<br />
ICT<br />
: Informati<strong>on</strong> and Communicati<strong>on</strong>s Technology<br />
ISP<br />
: Internet Service Provider<br />
KES<br />
: Kenyan Shilling<br />
LHS<br />
: Left Hand Side<br />
LION<br />
: Lower Indian Ocean Network<br />
LTE<br />
: L<strong>on</strong>g Term Evoluti<strong>on</strong><br />
MoU<br />
: Minutes of Use<br />
MSE<br />
: Malawi Stock Exchange<br />
MVNO<br />
: Mobile Virtual Network Operator<br />
RHS<br />
SADC<br />
SSA<br />
TEAMS<br />
USD<br />
VAS<br />
VOIP<br />
WACS<br />
y-o-y<br />
ZAR<br />
ZSE<br />
: Right Hand Side<br />
: Southern <str<strong>on</strong>g>Africa</str<strong>on</strong>g>n Development Community<br />
: <str<strong>on</strong>g>Sub</str<strong>on</strong>g>-<str<strong>on</strong>g>Saharan</str<strong>on</strong>g> <str<strong>on</strong>g>Africa</str<strong>on</strong>g><br />
: The East <str<strong>on</strong>g>Africa</str<strong>on</strong>g>n Marine System<br />
: United States of America Dollar<br />
: Value Added Services<br />
: Voice Over Internet Protocol<br />
: West <str<strong>on</strong>g>Africa</str<strong>on</strong>g>n Cable Systems<br />
: year <strong>on</strong> year<br />
: South <str<strong>on</strong>g>Africa</str<strong>on</strong>g>n Rand<br />
: Zimbabwe Stock Exchange
<str<strong>on</strong>g>Sub</str<strong>on</strong>g> <str<strong>on</strong>g>Saharan</str<strong>on</strong>g> <str<strong>on</strong>g>Africa</str<strong>on</strong>g> <str<strong>on</strong>g>Telecoms</str<strong>on</strong>g>-Fast Facts<br />
West <str<strong>on</strong>g>Africa</str<strong>on</strong>g><br />
S<strong>on</strong>atel SA - The telco is 42.0% owned by France Telecom (<strong>on</strong>e of the<br />
largest operators worldwide) and is the dominant telecom firm in<br />
Senegal and Mali. It is the largest company by value <strong>on</strong> the BRVM.<br />
Market Cap: USD 2.5bn<br />
Total <str<strong>on</strong>g>Sub</str<strong>on</strong>g>scribers: Approx 13.0m<br />
Onatel SA - Operates in Burkina Faso and is a leader in all its business<br />
segments; fixed, mobile and internet. The mobile business is<br />
operated by the subsidiary Telmob - SA. The main shareholders are<br />
Maroc Telecom (51%) and the State of Burkina Faso (26%).<br />
Market Cap: USD 0.32bn<br />
Total <str<strong>on</strong>g>Sub</str<strong>on</strong>g>scribers: Approx. 2.8m<br />
East <str<strong>on</strong>g>Africa</str<strong>on</strong>g><br />
Safaricom- Is a provider of c<strong>on</strong>verged communicati<strong>on</strong> soluti<strong>on</strong>s in<br />
Kenya. It provides a broad range of first-class products and services<br />
for teleph<strong>on</strong>y, EDGE and broadband internet. The company was<br />
incorporated in Kenya in April 1997 as a state owned company by<br />
virtue of the 60% government ownership. The government’s stake was<br />
later reduced to 35% after floating 25% of its stake to the public in<br />
2008. The c<strong>on</strong>trolling interest moved to Vodaf<strong>on</strong>e Kenya which now<br />
holds 40% stake in the company.<br />
Market Cap: USD 1.4bn<br />
Total <str<strong>on</strong>g>Sub</str<strong>on</strong>g>scribers: Approx 17.2m<br />
2
<str<strong>on</strong>g>Sub</str<strong>on</strong>g> <str<strong>on</strong>g>Saharan</str<strong>on</strong>g> <str<strong>on</strong>g>Africa</str<strong>on</strong>g> <str<strong>on</strong>g>Telecoms</str<strong>on</strong>g>-Fast Facts<br />
Southern <str<strong>on</strong>g>Africa</str<strong>on</strong>g><br />
Ec<strong>on</strong>et Wireless - Is the largest GSM mobile operator in Zimbabwe<br />
with a market share of about 69% and more than 5.0m subscribers and<br />
1,400 base stati<strong>on</strong>s. The company offers a unique blend of branded<br />
subscriber and pre-paid mobile ph<strong>on</strong>e services.<br />
Market Cap: USD 0.68bn<br />
Total <str<strong>on</strong>g>Sub</str<strong>on</strong>g>scribers: Approx.5.6m<br />
MTN Group- Incorporated in 1994, MTN Group Limited is a multinati<strong>on</strong>al<br />
telecommunicati<strong>on</strong>s group offering voice and data<br />
communicati<strong>on</strong>s products and services to individuals and businesses.<br />
MTN has GSM licences in 21 countries and internet service provider<br />
businesses in 13 countries, spanning three c<strong>on</strong>tinents.<br />
Market Cap: USD 35.2bn<br />
Total <str<strong>on</strong>g>Sub</str<strong>on</strong>g>scribers: Approx. 153.0m<br />
Vodacom Group - Is a communicati<strong>on</strong>s group providing mobile<br />
communicati<strong>on</strong>s. Its mobile network covers a total populati<strong>on</strong> of<br />
approximately 179.0m people across five countries: South <str<strong>on</strong>g>Africa</str<strong>on</strong>g>,<br />
Tanzania, the DRC, Lesotho and Mozambique.<br />
Market Cap: USD 18.3bn<br />
Total <str<strong>on</strong>g>Sub</str<strong>on</strong>g>scribers: Approx. 45.0m<br />
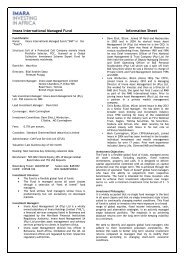
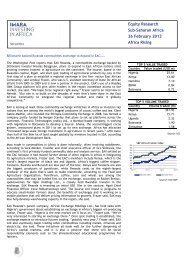
Undersea Cables across <str<strong>on</strong>g>Africa</str<strong>on</strong>g><br />
Large parts of <str<strong>on</strong>g>Africa</str<strong>on</strong>g> have gained access to<br />
internati<strong>on</strong>al fibre bandwidth via submarine cables<br />
(as shown by the map). Fibre optics as a<br />
transmissi<strong>on</strong> medium has a comparatively unlimited<br />
bandwidth, particularly in undersea applicati<strong>on</strong>s.<br />
The development of sub marine cables is likely to<br />
see <str<strong>on</strong>g>Africa</str<strong>on</strong>g>’s internet and broadband sector<br />
benefiting in the l<strong>on</strong>g term. East <str<strong>on</strong>g>Africa</str<strong>on</strong>g>, for<br />
example is already benefiting noticeably from<br />
Seacom, TEAMS and EASSy.<br />
WACS (planned) also forms part of a myriad of<br />
submarine cables telecommunicati<strong>on</strong>s providers<br />
have invested in, in an attempt to bring the muchneeded<br />
broadband capacity to the c<strong>on</strong>tinent. This<br />
is expected to bolster <str<strong>on</strong>g>Africa</str<strong>on</strong>g>’s efforts to achieve<br />
the United Nati<strong>on</strong>s Millennium Development Goals<br />
to bridge the digital divide and provide milli<strong>on</strong>s of<br />
subscribers in <str<strong>on</strong>g>Africa</str<strong>on</strong>g> with the capacity and ability to<br />
use smart soluti<strong>on</strong>s.<br />
3
INTRODUCTION<br />
Global Teleph<strong>on</strong>y Industry<br />
“Mr Wats<strong>on</strong> come here, I want you." With these historic words<br />
Alexander Graham Bell called to his assistant Thomas<br />
Augustus Wats<strong>on</strong> over the so-called teleph<strong>on</strong>e <strong>on</strong> 10 March<br />
1876 in Bost<strong>on</strong>, Massachusetts, and from there an industry<br />
was born. Interestingly, the cost of the first call between New<br />
York and Chicago was around USD 9.0 for five minutes,<br />
which translates to US 3c/sec versus today’s mobile tariffs of<br />
US 0.8c/sec for a call between Zimbabwe and the US.<br />
By definiti<strong>on</strong>, telecommunicati<strong>on</strong> is the transmissi<strong>on</strong> of signals<br />
over l<strong>on</strong>g distance, such as by telegraph, radio, or televisi<strong>on</strong>.<br />
It encompasses the electrical communicati<strong>on</strong> at a distance of<br />
voice, data, and image informati<strong>on</strong>. It is therefore important<br />
to menti<strong>on</strong> that the subject of telecommunicati<strong>on</strong>s is not <strong>on</strong>ly<br />
limited to voice teleph<strong>on</strong>y but is much wider as it includes<br />
data and images.<br />
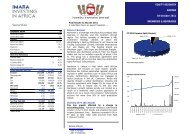
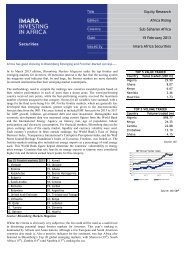
Of course, from a global perspective, we know that voice<br />
teleph<strong>on</strong>y is big business. In fact, TeleGeography estimates<br />
that internati<strong>on</strong>al call volumes have grown at a CAGR of about<br />
13% over the past 20 years. As depicted in Fig 1, traffic<br />
growth surged in the late 1990s, peaking at 25% in 2000,<br />
before returning to levels in line with historical patterns.<br />
With the growth in call volumes (both fixed and mobile)<br />
across the globe, it cannot be doubted therefore that a cell<br />
ph<strong>on</strong>e has become arguably the most ubiquitous gadget in the<br />
world as it is used for just about everything from making<br />
calls, surfing the internet, banking and transacting, and even<br />
organising revoluti<strong>on</strong>s (as was the case in the MENA regi<strong>on</strong>).<br />
Fig 1: Internati<strong>on</strong>al Call Volumes<br />
Growth in <str<strong>on</strong>g>Africa</str<strong>on</strong>g>’s ICT sector has also accelerated in<br />
recent years owing to improvements in infrastructure, the<br />
arrival of wireless access technologies and lower tariffs.<br />
TRENDS IN THE SSA TELECOMS SECTOR<br />
Declining Voice ARPUs as operators reach voice<br />
maturity…<br />
One of the most comm<strong>on</strong> trends that is not <strong>on</strong>ly comm<strong>on</strong><br />
to SSA telcos but naturally occurs as a telecoms company<br />
reaches its maturity stage in terms of subscriber numbers<br />
is that the ARPU levels tend to decline. An analysis of a<br />
sample of telecoms companies <strong>on</strong> the <str<strong>on</strong>g>Africa</str<strong>on</strong>g>n space<br />
including Mobinil (Egypt), Safaricom (Kenya) and Ec<strong>on</strong>et<br />
(Zimbabwe) reveals declining trends in ARPUs over the<br />
past years. Other underlying determinants include<br />
pressures to lower prices by regulating authorities in<br />
various jurisdicti<strong>on</strong>s as well as local competiti<strong>on</strong>.<br />
Moreover, new initiatives such as servicing the n<strong>on</strong>-urban<br />
populati<strong>on</strong> (as in the case of Safaricom in Kenya) have an<br />
effect of diluting ARPUs. Targeting lower value<br />
subscribers such as the rural market in <str<strong>on</strong>g>Africa</str<strong>on</strong>g> will<br />
naturally exert downward pressure <strong>on</strong> ARPUs. The main<br />
c<strong>on</strong>straint therefore is that telcos still have to c<strong>on</strong>tain<br />
costs and grow in relatively saturated voice markets that<br />
are often characterised by new competiti<strong>on</strong>.<br />
Fig 2: ARPU Vs Mobile Penetrati<strong>on</strong><br />
10<br />
9<br />
8<br />
7<br />
6<br />
5<br />
4<br />
3<br />
2<br />
1<br />
0<br />
5.1<br />
5.0<br />
6.8<br />
Uganda Kenya Ghana Zambia Zimbabwe Nigeria<br />
7.2<br />
7.5<br />
9.5<br />
70%<br />
60%<br />
50%<br />
40%<br />
30%<br />
20%<br />
10%<br />
0%<br />
Source:IAS Estimates<br />
Mobile Penetrati<strong>on</strong>-RHS<br />
ARPU (USD)-LHS<br />
Voice competiti<strong>on</strong> intensifying across various<br />
jurisdicti<strong>on</strong>s…<br />
<str<strong>on</strong>g>Africa</str<strong>on</strong>g> <str<strong>on</strong>g>Telecoms</str<strong>on</strong>g> Sector<br />
Arguably <str<strong>on</strong>g>Africa</str<strong>on</strong>g>’s greatest success story to date in<br />
telecommunicati<strong>on</strong>s is the remarkable spread of mobile<br />
teleph<strong>on</strong>y throughout the c<strong>on</strong>tinent. We also note that<br />
positive ec<strong>on</strong>omic reforms, particularly in countries such as<br />
Ghana, Kenya, Rwanda, Zambia and Liberia have greatly<br />
improved the operating envir<strong>on</strong>ment for <str<strong>on</strong>g>Africa</str<strong>on</strong>g>n telecoms.<br />
These ec<strong>on</strong>omic benefits have also been enhanced by regi<strong>on</strong>al<br />
ec<strong>on</strong>omic blocs (COMESA, EAC) that have set the t<strong>on</strong>e for an<br />
integrati<strong>on</strong> of ec<strong>on</strong>omies. The improved growth momentum<br />
has to a large extent improved incomes and accelerated<br />
urbanisati<strong>on</strong> (infrastructural development).<br />
In SSA for example, Nigeria is <strong>on</strong>e of the fastest-growing<br />
telecoms markets, fuelled by several new entrants, the<br />
launch of mobile value-added services (VAS) and broadband.<br />
Telecom industry liberalisati<strong>on</strong> has also pushed market<br />
penetrati<strong>on</strong> of telecom services in Nigeria from just 1.2% in<br />
2002 to an estimated 50% in 2010.<br />
Within an SSA c<strong>on</strong>text, Kenya remains an exciting casestudy<br />
with regards to voice competiti<strong>on</strong>. The East <str<strong>on</strong>g>Africa</str<strong>on</strong>g>n<br />
country remains <strong>on</strong>e of the most competitive markets as we<br />
have witnessed price wars am<strong>on</strong>gst the main operators.<br />
Safaricom is East <str<strong>on</strong>g>Africa</str<strong>on</strong>g>’s biggest mobile ph<strong>on</strong>e company,<br />
c<strong>on</strong>trolling c67% of the market in Kenya, and it has<br />
struggled to maintain its market share due to stiff<br />
competiti<strong>on</strong> from Airtel Kenya and its price based market<br />
share accumulati<strong>on</strong> strategy.<br />
Bharti Airtel, the parent company which is also India's top<br />
cellular carrier, has largely implemented a low-cost, <str<strong>on</strong>g>high</str<strong>on</strong>g>volume<br />
Indian model in <str<strong>on</strong>g>Africa</str<strong>on</strong>g> which involves outsourcing<br />
network, IT and back office operati<strong>on</strong>s in order to reduce<br />
costs. Airtel, for example, cut its tariffs by more than 50%<br />
in August 2010 leading to voice rates tumbling to as little as<br />
KES 1.0 per minute from KES 3.5 per minute.<br />
4
An analysis of mobile tariffs in Kenya since September 2009<br />
shows a drastic decline in pre-paid and post paid tariffs<br />
across networks. The tariff declines were also a result of an<br />
interc<strong>on</strong>necti<strong>on</strong> determinati<strong>on</strong> by the CCK that saw a<br />
reducti<strong>on</strong> in mobile terminati<strong>on</strong> rates. More recently, the<br />
Government of Kenya intervened when Kenya’s president,<br />
Mwai Kibaki “ordered’ an end to further cuts in mobile<br />
ph<strong>on</strong>e terminati<strong>on</strong> charges, thereby giving telecom<br />
operators a reprieve from a looming renewal of tariff wars.<br />
Operators in Kenya such as Safaricom and Essar Telekom had<br />
been lobbying to have the MTR frozen to prevent a price war<br />
escalating.<br />
On a more positive note however, Kenyan mobile ph<strong>on</strong>es<br />
subscriber numbers have risen from about 17.9m in 2009 to<br />
25.0m <strong>on</strong> the back of the cheaper calling rates, which is a<br />
direct benefit of competiti<strong>on</strong> (for c<strong>on</strong>sumers).<br />
Fig 3:Average Mobile Tariffs per Minute (KES)<br />
16.0<br />
14.0<br />
14.5 14.5 14.5<br />
Fig 4: Percentage of Internet Users<br />
Latin<br />
America, 10.3%<br />
North<br />
America, 13.0%<br />
<str<strong>on</strong>g>Africa</str<strong>on</strong>g>, 5.7%<br />
Source: Internet World Stats<br />
Middle East, 3.3%<br />
Australia, 1.0%<br />
Europe, 22.7%<br />
Fig 5: Global Analysis of Internet Penetrati<strong>on</strong> Levels<br />
90.0%<br />
80.0%<br />
70.0%<br />
60.0%<br />
Asia, 44.0%<br />
12.0<br />
10.0<br />
11.4<br />
10.6<br />
10.6<br />
12.3<br />
50.0%<br />
40.0%<br />
8.0<br />
6.0<br />
4.0<br />
2.0<br />
8.2<br />
6.8<br />
5.6<br />
6.2<br />
5.6<br />
6.2<br />
5.6 5.6<br />
3.9<br />
3.5<br />
2.6<br />
2.5<br />
30.0%<br />
20.0%<br />
10.0%<br />
0.0%<br />
North<br />
America<br />
Australia Europe Latin<br />
America<br />
Middle<br />
East<br />
World<br />
Average<br />
Asia<br />
<str<strong>on</strong>g>Africa</str<strong>on</strong>g><br />
-<br />
Source: Internet World Stats<br />
Sep-09<br />
Oct-09<br />
Nov-09<br />
Dec-09<br />
Jan-10<br />
Feb-10<br />
Same network (pre-paid)<br />
To another mobile (pre-paid)<br />
Mar-10<br />
Apr-10<br />
May-10<br />
Jun-10<br />
Jul-10<br />
Aug-10<br />
Same network (post-paid)<br />
To another mobile (post-paid)<br />
Sep-10<br />
Fig 6: SSA Internet Penetrati<strong>on</strong><br />
45.00%<br />
Source:CCK<br />
40.00%<br />
35.00%<br />
Another positive development that has come as result of<br />
competiti<strong>on</strong> is that operators such as Safaricom and Telkom<br />
Kenya are planning joint projects so as to cut operating costs.<br />
The projects include am<strong>on</strong>gst other things, sharing costs of<br />
setting up telecommunicati<strong>on</strong> towers. The project is expected<br />
to be modelled al<strong>on</strong>g the lines of internati<strong>on</strong>al tower<br />
companies like India’s Indus Towers, a c<strong>on</strong>sortium of telecoms<br />
operators in that country.<br />
The Data Revoluti<strong>on</strong>…<br />
As discussed earlier, voice penetrati<strong>on</strong> levels in <str<strong>on</strong>g>Africa</str<strong>on</strong>g> have<br />
increased and in some cases reached maturity. The main<br />
predicament however, is that telcos c<strong>on</strong>tinue to face the<br />
daunting task of staying “relevant” bey<strong>on</strong>d their existing<br />
business models of just being airtime factories. Therefore, the<br />
next big questi<strong>on</strong> is, ‘What is the next growth avenue?’ The<br />
answer to the questi<strong>on</strong> seems to lie in data as opposed to<br />
voice.<br />
Low internet penetrati<strong>on</strong> levels in SSA point to massive<br />
growth prospects…<br />
Generally, internet penetrati<strong>on</strong> levels of 10.9% for <str<strong>on</strong>g>Africa</str<strong>on</strong>g> are<br />
well below developed world standards. Most countries in SSA<br />
for example have penetrati<strong>on</strong> levels below 10%, with the likes<br />
of Uganda at 9.6%, Zambia 6.8%, Botswana 5.9%, Kenya 10%,<br />
Malawi 4.6% and Tanzania 1.6%. In fact, broad band<br />
subscripti<strong>on</strong>s in <str<strong>on</strong>g>Africa</str<strong>on</strong>g> are expected to reach 265.0m by 2015.<br />
In additi<strong>on</strong>, services such as cloud computing, next generati<strong>on</strong><br />
analytics, virtualisati<strong>on</strong> and hosted services are positi<strong>on</strong>ed to<br />
become critical elements to making such growth a reality.<br />
30.00%<br />
25.00%<br />
20.00%<br />
15.00%<br />
10.00%<br />
5.00%<br />
0.00%<br />
Morocco<br />
Reuni<strong>on</strong> (FR)<br />
Cape Verde<br />
Egypt<br />
Sao Tome & …<br />
Algeria<br />
Saint Helena (UK)<br />
Sudan<br />
Djibouti<br />
Gambia<br />
Gab<strong>on</strong><br />
Namibia<br />
C<strong>on</strong>go<br />
Togo<br />
Mayotte (FR)<br />
Cote d'Ivoire<br />
Eritrea<br />
Rwanda<br />
Comoros<br />
Guinea-Bissau<br />
Equatorial Guinea<br />
Central <str<strong>on</strong>g>Africa</str<strong>on</strong>g>n Rep.<br />
Chad<br />
Burundi<br />
Burkina Faso<br />
C<strong>on</strong>go, Dem. Rep.<br />
Sierra Le<strong>on</strong>e<br />
Ethiopia<br />
Source: Internet World Stats<br />
Mobile broad band growing faster than fixed broad<br />
band…<br />
Generally, we are predicting a boom in <str<strong>on</strong>g>Africa</str<strong>on</strong>g>’s data<br />
market over the next five years, propelled by an<br />
“igniting” mobile broadband market.<br />
The underlying fact is that fixed broadband services in<br />
emerging markets are far more expensive than in mature<br />
markets and bey<strong>on</strong>d the reach of the majority of<br />
c<strong>on</strong>sumers. In South <str<strong>on</strong>g>Africa</str<strong>on</strong>g>, for example prices range from<br />
USD 600/year for entry level DSL services to USD<br />
1,500/year for the <str<strong>on</strong>g>high</str<strong>on</strong>g> end opti<strong>on</strong>s and in Nigeria, entry<br />
level broadband services cost about USD 1,200/year. In<br />
fact, a close analysis reveals that in some emerging<br />
markets, broadband pricing is double or triple the price of<br />
an equivalent service in a more developed market.<br />
5
An important <str<strong>on</strong>g>high</str<strong>on</strong>g>light is that most <str<strong>on</strong>g>Africa</str<strong>on</strong>g>n countries,<br />
particularly in SSA excluding South <str<strong>on</strong>g>Africa</str<strong>on</strong>g>, are often<br />
characterised by limited fixed line infrastructure, which has<br />
created enormous opportunities for wireless and mobile<br />
communicati<strong>on</strong>s soluti<strong>on</strong>s. Mobile broadband is generally the<br />
cheapest opti<strong>on</strong> for data-hungry c<strong>on</strong>sumers in emerging<br />
markets, although the performance limitati<strong>on</strong>s make for a<br />
compromise <strong>on</strong> customer experience.<br />
Increased Mobile broadband across <str<strong>on</strong>g>Africa</str<strong>on</strong>g>…<br />
According to a June 2011 Opera <str<strong>on</strong>g>Report</str<strong>on</strong>g>, entitled, “State of<br />
the Mobile Web, the Opera Mini browser saw increases in all<br />
three categories of growth: unique users, pages viewed and<br />
data c<strong>on</strong>sumed in June 2011. Overall, a total of 115.0m<br />
people used the Opera Mini browser in June 2011. While<br />
global numbers appear to be <strong>on</strong> the up, above-average growth<br />
rates are mostly comm<strong>on</strong> in <str<strong>on</strong>g>Africa</str<strong>on</strong>g>.<br />
The top 10 countries by usage of the Opera Mini browser in<br />
<str<strong>on</strong>g>Africa</str<strong>on</strong>g> were Nigeria, South <str<strong>on</strong>g>Africa</str<strong>on</strong>g>, Kenya, Ghana, Sudan,<br />
Zimbabwe, Tanzania, Ethiopia, Zambia and Morocco.<br />
From June 2010 to June 2011, page views in the top 10<br />
countries of <str<strong>on</strong>g>Africa</str<strong>on</strong>g> increased by 187%, unique users<br />
increased by 184% and data transferred increased by<br />
199%. Zimbabwe and Morocco led the top 10 countries of<br />
the regi<strong>on</strong> in terms of page view growth (4,965% and<br />
1,598%, respectively). The two countries also led the top<br />
10 countries of the regi<strong>on</strong> in the growth of data<br />
transferred (3,449.7% and 1,385.9%, respectively). In<br />
additi<strong>on</strong>, Zimbabwe and Ethiopia were in the top spot in<br />
terms of the growth of unique users (4,483.3% and<br />
989.5%, respectively). Zimbabwe was also leader in the<br />
regi<strong>on</strong> in terms of the page views per user, with each<br />
user browsing 713 pages <strong>on</strong> average each m<strong>on</strong>th.<br />
Generally, Zimbabwe is credited for its relatively <str<strong>on</strong>g>high</str<strong>on</strong>g><br />
internet penetrati<strong>on</strong> levels of 11.8% versus 4.5% for<br />
countries such as Malawi as a result of <str<strong>on</strong>g>high</str<strong>on</strong>g> literacy rates.<br />
We believe the growth statistics are reflective of the<br />
underlying growth prospects in mobile broad band across<br />
the <str<strong>on</strong>g>Africa</str<strong>on</strong>g>n c<strong>on</strong>tinent.<br />
Fig 7: Mobile Web Statistics<br />
Nigeria<br />
South <str<strong>on</strong>g>Africa</str<strong>on</strong>g><br />
Kenya<br />
Ghana<br />
Page-view growth* 465% 93% 41% 211% 343% 4965% 448% 1042% 523% 1598% 94%<br />
Unique-user growth* 437% 68% 73% 200% 294% 4483% 195% 990% 540% 787% 5%<br />
Data transfer growth* 425% 87% 91% 252% 221% 3450% 455% 889% 616% 1386% 81%<br />
Page views per user/m<strong>on</strong>th 338 454 522 509 567 713 672 418 515 427 510<br />
Data transferred per user (MB) 4 5 7 7 8 7 8 8 6 9 12<br />
Data transferred per page view (KB) 13 12 14 13 14 10 12 19 11 23 23<br />
* growth since June 2010<br />
Source:Opera Software<br />
Sudan<br />
Zimbabwe<br />
Tanzania<br />
Ethiopia<br />
Zambia<br />
Morrocco<br />
USA<br />
Web-based applicati<strong>on</strong>s also driving data growth...<br />
Messaging applicati<strong>on</strong>s such as Google, Facebook and<br />
Twitter have been <strong>on</strong>e of the most important drivers of<br />
data growth. As shown in Fig 7a, c88% of all people in<br />
world are aware of Facebook. In fact, <str<strong>on</strong>g>Africa</str<strong>on</strong>g> is Facebook’s<br />
fastest growing market, promising robust growth. Another<br />
important trend worth menti<strong>on</strong>ing is that Facebook is not<br />
<strong>on</strong>ly driving mobile data c<strong>on</strong>sumpti<strong>on</strong>, but MVNOs have<br />
identified it as a value-add c<strong>on</strong>tent platform to drive<br />
ARPUs. The fastest growing <str<strong>on</strong>g>Africa</str<strong>on</strong>g>n countries in 2010 were<br />
Nigeria (1.4m new users), Egypt (1.6m new users), and<br />
South <str<strong>on</strong>g>Africa</str<strong>on</strong>g> (750,000 new users).<br />
Fig 7a: Facebook 2010 Social Demographics<br />
A focus <strong>on</strong> Data as opposed to Voice...<br />
A comm<strong>on</strong> trend am<strong>on</strong>gst SSA telcos, as alluded to<br />
earlier, given falling ARPUs, is a shift in focus towards<br />
data services. For companies such as Safaricom in<br />
Kenya, data (including VAS) c<strong>on</strong>tributes approximately<br />
20% to total revenues.<br />
However, in more developed markets such Japan, data<br />
c<strong>on</strong>tributes about 80%. Of course, the issue of<br />
competiti<strong>on</strong> within the data space cannot be completely<br />
ruled out. In Kenya, Safaricom has the country's sole<br />
third-generati<strong>on</strong> (3G) licence but Airtel is also planning<br />
to roll out its 3G service. In Zimbabwe, Ec<strong>on</strong>et’s<br />
c<strong>on</strong>tenders such as TelOne and NetOne have indicated<br />
plans to rollout broadband internet. The key set back,<br />
however is that internet access, data and devices are still<br />
expensive for most <str<strong>on</strong>g>Africa</str<strong>on</strong>g>n users.<br />
Source: Facebook<br />
However, low-cost Android handsets are “doing the trick”.<br />
Overall, <str<strong>on</strong>g>Africa</str<strong>on</strong>g> remains largely a prepaid market and the<br />
winning soluti<strong>on</strong> is to offer mobile data bundles as prepaid<br />
top-ups. Safaricom in Kenya and Ec<strong>on</strong>et in Zimbabwe are<br />
already seeing the benefit of such pricing strategies.<br />
6
The Role of Undersea Cables...<br />
Large parts of <str<strong>on</strong>g>Africa</str<strong>on</strong>g> have gained access to internati<strong>on</strong>al<br />
fibre bandwidth via submarine cables. The underlying<br />
rati<strong>on</strong>ale is that fibre optics as a transmissi<strong>on</strong> medium has<br />
a comparatively unlimited bandwidth. A major advantage<br />
fibre has when compared with coaxial cable is that no<br />
equalisati<strong>on</strong> is necessary. All transoceanic cables<br />
currently being installed and planned for the future are<br />
based <strong>on</strong> fibre optics. It is the favoured transmissi<strong>on</strong><br />
medium for very wideband terrestrial links, including<br />
undersea applicati<strong>on</strong>s.<br />
The development of sub marine cables is likely to see<br />
<str<strong>on</strong>g>Africa</str<strong>on</strong>g>’s internet and broadband sector benefiting in the<br />
l<strong>on</strong>g term. As indicated in Fig 8, between 2006 and 2010,<br />
internati<strong>on</strong>al bandwidth usage increased nearly seven-fold<br />
in <str<strong>on</strong>g>Africa</str<strong>on</strong>g>.<br />
Fig 8: Used Internati<strong>on</strong>al Bandwidth: CAGR (2006-2010)<br />
100%<br />
90%<br />
80%<br />
70%<br />
60%<br />
50%<br />
40%<br />
30%<br />
20%<br />
10%<br />
Seacom also plans to extend the cable into Somalia,<br />
Burundi and Southern Sudan through various partners as<br />
a result of the growing demand for internet services.<br />
Seacom currently has fibre-optic links in Rwanda,<br />
Uganda, Tanzania, Ethiopia, Djibouti and Kenya.<br />
Generally, we expect wholesale prices for internet<br />
bandwidth to come down from previous levels. The<br />
wholesale prices <strong>on</strong> internati<strong>on</strong>al fibre optic cables have<br />
come down to USD 400 from previous charges of as <str<strong>on</strong>g>high</str<strong>on</strong>g><br />
as USD 4,500.<br />
Furthermore, as the cost of internati<strong>on</strong>al bandwidth<br />
comes down, we should see more operators rolling out<br />
nati<strong>on</strong>al fibre backb<strong>on</strong>e networks to take bandwidth<br />
bey<strong>on</strong>d the capital cities as is the case in Kenya.<br />
Indicati<strong>on</strong>s are that the government is set to lay fibre<br />
optic cable in Kenya’s 47 counties at a cost of KES 5.6bn<br />
in an effort to boost access and lower the cost of<br />
internet. The government is also keen to take internet<br />
access to rural Kenya to allow it to offer services such as<br />
registrati<strong>on</strong> of births and deaths, passport issuance and<br />
tax collecti<strong>on</strong> under the e-Government plan. This, in our<br />
view, should further boost the rate of the country’s<br />
ec<strong>on</strong>omic development.<br />
Fig 9: Falling Bandwidth Prices<br />
0%<br />
<str<strong>on</strong>g>Africa</str<strong>on</strong>g> Asia Europe Caribbean Middle East Oceania US and Canada<br />
Source:IAS/Telegeography<br />
Internati<strong>on</strong>al submarine fibre optic cables have indeed<br />
reached several <str<strong>on</strong>g>Africa</str<strong>on</strong>g>n countries for the first time in 2009<br />
and 2010, with more cables expected to go <strong>on</strong>line in 2011<br />
and 2012. In East <str<strong>on</strong>g>Africa</str<strong>on</strong>g>, for example Seacom fibre-optic<br />
link started operating in July 2009, while the East <str<strong>on</strong>g>Africa</str<strong>on</strong>g>n<br />
Marine System (Teams), a cable linking 20 <str<strong>on</strong>g>Africa</str<strong>on</strong>g>n<br />
countries started in October 2009. As a result, Kenya’s<br />
internet users more than doubled over the past year. The<br />
country now has approximately 7.5m internet users<br />
compared to about 3.0m in 2010.<br />
<str<strong>on</strong>g>Sub</str<strong>on</strong>g>marine Cables in <str<strong>on</strong>g>Africa</str<strong>on</strong>g><br />
SAT-3/WASC (In Service)<br />
<str<strong>on</strong>g>Africa</str<strong>on</strong>g> Coast to Europe (ACE) (Planned) West <str<strong>on</strong>g>Africa</str<strong>on</strong>g>n Cable System (WACS) (Planned) Eastern <str<strong>on</strong>g>Africa</str<strong>on</strong>g> <str<strong>on</strong>g>Sub</str<strong>on</strong>g>marine System (EASSy) (In Service)<br />
• Abidjan, Côte d'Ivoire • Abidjan, Côte d'Ivoire • Abidjan, Côte d'Ivoire • Dar Es Salaam, Tanzania<br />
• Accra, Ghana • Accra, Ghana • Accra, Ghana • Djibouti City, Djibouti<br />
• Alta Vista, Canary Islands, Spain • Banjul, Gambia • Alta Vista, Canary Islands, Spain • Maputo, Mozambique<br />
• Cacuaco, Angola • Bata, Equatorial Guinea • Highbridge, United Kingdom • Mombasa, Kenya<br />
• Cot<strong>on</strong>ou, Benin • Cape Town, South <str<strong>on</strong>g>Africa</str<strong>on</strong>g> • Lagos, Nigeria • Mor<strong>on</strong>i, Comoros<br />
• Dakar, Senegal • C<strong>on</strong>akry, Guinea • Limbe, Camero<strong>on</strong> • Mtunzini, South <str<strong>on</strong>g>Africa</str<strong>on</strong>g><br />
• Douala, Camero<strong>on</strong> • Cot<strong>on</strong>ou, Benin • Lome, Togo • Port Sudan, Sudan<br />
• Lagos, Nigeria • Dakar, Senegal • Luanda, Angola • Toliary, Madagascar<br />
• Libreville, Gab<strong>on</strong> • Freetown, Sierra Le<strong>on</strong>e • Muanda, C<strong>on</strong>go, Dem. Rep. SAT-2 (In Service)<br />
• Melkbosstrand, South <str<strong>on</strong>g>Africa</str<strong>on</strong>g> • Kribi, Camero<strong>on</strong> • Point Noire, C<strong>on</strong>go, Rep. • El Médano, Canary Islands, Spain<br />
• Sesimbra, Portugal • Lagos, Nigeria • Praia, Cape Verde • Funchal, Portugal<br />
• Libreville, Gab<strong>on</strong> • Seixal, Portugal • Melkbosstrand, South <str<strong>on</strong>g>Africa</str<strong>on</strong>g><br />
• Lisb<strong>on</strong>, Portugal • Swakopmund, Namibia The East <str<strong>on</strong>g>Africa</str<strong>on</strong>g>n Marine System (TEAMS) (In Service)<br />
Source: TeleGeography<br />
• Luanda, Angola • Yzerf<strong>on</strong>tein, South <str<strong>on</strong>g>Africa</str<strong>on</strong>g> • Fujairah, United Arab Emirates<br />
• M<strong>on</strong>rovia, Liberia SEACOM/Tata TGN-Eurasia (In Service) • Mombasa, Kenya<br />
• Muanda, C<strong>on</strong>go, Dem. Rep. • Dar Es Salaam, Tanzania<br />
• Nouakchott, Mauritania • Djibouti City, Djibouti<br />
• Penmarch, France • Maputo, Mozambique<br />
• Santana, Sao Tome and Principe • Mombasa, Kenya<br />
• Swakopmund, Namibia • Mtunzini, South <str<strong>on</strong>g>Africa</str<strong>on</strong>g><br />
• Tenerife, Canary Islands, Spain • Mumbai, India<br />
• Zafarana, Egypt<br />
7
Fig 10: <str<strong>on</strong>g>Sub</str<strong>on</strong>g>marine Cable Capacity in East <str<strong>on</strong>g>Africa</str<strong>on</strong>g><br />
Fig 11: <str<strong>on</strong>g>Sub</str<strong>on</strong>g>marine Cable Capacity in West <str<strong>on</strong>g>Africa</str<strong>on</strong>g><br />
A focus <strong>on</strong> Value Added Services (VAS)<br />
Most Telcos in SSA are now focussing more <strong>on</strong> Value<br />
Added Services (VAS), not <strong>on</strong>ly as a strategy of<br />
diversifying income streams but also as a way of ensuring<br />
the stickiness of subscribers. Examples include services<br />
such mobile m<strong>on</strong>ey and insurance.<br />
Specific examples would include the M-PESA payment<br />
system. Safaricom first launched M-PESA in Kenya in 2007.<br />
M-PESA has since been taken up by Vodaf<strong>on</strong>e to other<br />
markets. As at March 2011, Vodaf<strong>on</strong>e claimed 10.0m users<br />
in Kenya and 7.0m in Tanzania. Since launching in SA in<br />
2010, Vodacom has signed up about 100,000 customers.<br />
On the other hand, MTN initially launched Mobile M<strong>on</strong>ey<br />
in SA in partnership with Standard Bank in 2005 (1.8m<br />
customers by December 2010) and started rolling-out<br />
internati<strong>on</strong>ally in 2009. As at 31 March 2011, MTN claimed<br />
a total of 4.6m users across 12 countries. Mobile M<strong>on</strong>ey<br />
generated about USD 10.0m in revenue to December<br />
2010, and it now c<strong>on</strong>tributes over 3.5% of quarterly<br />
revenue in Uganda.<br />
Other operators in East <str<strong>on</strong>g>Africa</str<strong>on</strong>g> such as Telkom Kenya and<br />
Essar <str<strong>on</strong>g>Telecoms</str<strong>on</strong>g> have also introduced mobile m<strong>on</strong>ey<br />
services such as ZAP and Yu-cash. In Francoph<strong>on</strong>e West<br />
<str<strong>on</strong>g>Africa</str<strong>on</strong>g>, S<strong>on</strong>atel has also introduced Orange M<strong>on</strong>ey. While<br />
Zimbabwe’s Ec<strong>on</strong>et Wireless has made limited progress<br />
with its Eco-Cash offering, it has introduced other VAS<br />
such as Ecolife and Ec<strong>on</strong>et mail so as to maintain a<br />
leadership positi<strong>on</strong>.<br />
However, we expect competiti<strong>on</strong> to intensify across the<br />
c<strong>on</strong>tinent in the next few years. MCommerce providers<br />
will in the future include MVNOs, banks, retailers, social<br />
networks and other independent providers.<br />
The C<strong>on</strong>vergence of voice and data…<br />
Comparing telcos in SSA with other mature data market<br />
operators such as Japan’s NTT Docomo shows that <str<strong>on</strong>g>Africa</str<strong>on</strong>g> is<br />
lagging far behind. NTT Docomo’s data and voice ARPUs<br />
have now c<strong>on</strong>verged, implying that NTT’s average<br />
subscriber now spends as much <strong>on</strong> data as <strong>on</strong> voice<br />
services. In developed markets such as Japan and the UK,<br />
the abundant use of mobile media has been the main<br />
c<strong>on</strong>tributor to data revenues whereas the lack of<br />
adequate data speeds and <str<strong>on</strong>g>high</str<strong>on</strong>g> latencies has stifled<br />
mobile video usage in SSA. However, the general trend is<br />
that telcos in SSA are moving towards voice and data ARPU<br />
c<strong>on</strong>vergence, though it is likely to occur in the l<strong>on</strong>g term.<br />
VoIP also c<strong>on</strong>tributing to the c<strong>on</strong>vergence …<br />
Voice over Internet Protocol (VoIP) has been largely made<br />
possible through new technologies such as multiplexing.<br />
This makes is possible to transmit a plurality of<br />
informati<strong>on</strong> channels over a single transmissi<strong>on</strong> medium.<br />
For example, an informati<strong>on</strong> channel may be a teleph<strong>on</strong>e<br />
voice channel, data channel, or a channel carrying image<br />
informati<strong>on</strong>. Some applicati<strong>on</strong>s of VoIP are Click to talk<br />
web sites for e-commerce, Digital whiteboard<br />
c<strong>on</strong>ferencing, broadcast audio and video, unified<br />
messaging and Fax over IP. This effectively means that<br />
voice is a form of data and therefore ICT companies such<br />
as Neotel in South <str<strong>on</strong>g>Africa</str<strong>on</strong>g>, Africom in Zimbabwe and Access<br />
Kenya in East <str<strong>on</strong>g>Africa</str<strong>on</strong>g> can compete with traditi<strong>on</strong>al telcos in<br />
the respective markets by making use of VoIP. The fact<br />
that voice can be compressed up to 4 to 8 kbps means<br />
that silence periods can be removed. In additi<strong>on</strong>, billing<br />
can be made independent of distance and advanced<br />
teleph<strong>on</strong>y features are also possible.<br />
Increased Multinati<strong>on</strong>al Interest in SSA…<br />
Multinati<strong>on</strong>al interest across the telecoms sector in SSA is<br />
a clear indicati<strong>on</strong> of the investment case that lies in<br />
<str<strong>on</strong>g>Africa</str<strong>on</strong>g>n telcos. Generally, investors into <str<strong>on</strong>g>Africa</str<strong>on</strong>g> have<br />
largely been attracted by the sector's <str<strong>on</strong>g>high</str<strong>on</strong>g> profit margins,<br />
low penetrati<strong>on</strong> and bottom-heavy demographic<br />
populati<strong>on</strong> profile which guarantee a massive pool of<br />
c<strong>on</strong>sumers.<br />
India- remains a bullish investor in SSA<br />
Generally, India is taking a lead in <str<strong>on</strong>g>Africa</str<strong>on</strong>g> telco investments.<br />
Bharti Airtel, India’s biggest mobile ph<strong>on</strong>e company, for<br />
example is planning to invest about USD 1.0bn this year in<br />
order to expand its network across the c<strong>on</strong>tinent. The<br />
group has already invested USD 11.0bn in <str<strong>on</strong>g>Africa</str<strong>on</strong>g>. Essar, <strong>on</strong><br />
the other hand, a company that owns 33% of Vodaf<strong>on</strong>e’s<br />
Indian operati<strong>on</strong> is also planning to invest USD 2.0bn in up<br />
to seven <str<strong>on</strong>g>Africa</str<strong>on</strong>g>n mobile businesses. Essar is already a<br />
significant investor in telecoms operati<strong>on</strong>s in <str<strong>on</strong>g>Africa</str<strong>on</strong>g> through<br />
a number of relati<strong>on</strong>ships with other companies. The<br />
company also owns a majority stake in Dhabi Group’s Warid<br />
Telecom operati<strong>on</strong>s in Uganda and C<strong>on</strong>go.<br />
State-run Mahanagar Teleph<strong>on</strong>e Nigam Limited (MTNL) has<br />
reportedly been eyeing a 51% stake in Zimbabwe's stateowned<br />
landline operator, TelOne. MTNL provides basic<br />
ph<strong>on</strong>e, internet and cellular mobile teleph<strong>on</strong>y services in<br />
Delhi and Mumbai. The company already operates <strong>on</strong> the<br />
<str<strong>on</strong>g>Africa</str<strong>on</strong>g>n c<strong>on</strong>tinent through its Mauritius arm, Mahanagar<br />
Teleph<strong>on</strong>e Mauritius Ltd (MTML).<br />
8
Libya, losing its grip…<br />
Quite clearly, the UN-backed ec<strong>on</strong>omic sancti<strong>on</strong>s that came<br />
through in the wake of the political unrest in Libya largely<br />
caused the Libyan government to lose its grip <strong>on</strong> the <str<strong>on</strong>g>Africa</str<strong>on</strong>g><br />
telecoms market. The Libyan government primarily invested<br />
in the telecoms sector through its investment arm, known as<br />
the LAP Green network. It is worth noting that its<br />
investments in Zambia, South <str<strong>on</strong>g>Africa</str<strong>on</strong>g>, Uganda and Rwanda<br />
have remained frozen. The Zambian government, for example<br />
froze Libya’s 75% stake in Zamtel. In Uganda and Rwanda,<br />
however, the governments have not <strong>on</strong>ly frozen Libya’s assets<br />
but taken over the management of the telecom companies.<br />
Over the past few years, however, LAP Green network had<br />
pushed to invest in the <str<strong>on</strong>g>Africa</str<strong>on</strong>g>n telecom market. Two years<br />
ago, it signed a USD 300.0m financing agreement with the<br />
Industrial and Commercial Bank of China to fuel its expansi<strong>on</strong><br />
program in <str<strong>on</strong>g>Africa</str<strong>on</strong>g> through the acquisiti<strong>on</strong> of financially<br />
distressed operators.<br />
However, it is interesting to see what will happen now with<br />
the new transiti<strong>on</strong>al council in place.<br />
China, broadly focusing more <strong>on</strong> ICT…<br />
Broadly speaking, China has stepped up its investment drive<br />
across the <str<strong>on</strong>g>Africa</str<strong>on</strong>g>n c<strong>on</strong>tinent. China is also pushing into<br />
sectors such as telecoms and firms such as Huawei and ZTE<br />
Technologies have been gaining steam in the infrastructure<br />
arena and are now establishing a foothold in the retail<br />
segment with low cost mobile ph<strong>on</strong>es and internet<br />
modems. As a result, they are gaining market share in the<br />
retail segment that has traditi<strong>on</strong>ally been the domain of<br />
European based brands such as Nokia, Motorola and<br />
Samsung. China’s interest in telecoms also stretches out to<br />
Zimbabwe, where Ec<strong>on</strong>et has partnered with ZTE<br />
Technologies. The Chinese company is supplying technical<br />
equipment for commissi<strong>on</strong>ing various switches across the<br />
country. The switches are earmarked at boosting network<br />
capacity. In additi<strong>on</strong>, Ec<strong>on</strong>et has also been working with<br />
Huawei in the implementati<strong>on</strong> of a fibre optic network<br />
project that will also boost its capacity.<br />
South <str<strong>on</strong>g>Africa</str<strong>on</strong>g>, taking a lead in tapping into<br />
<str<strong>on</strong>g>Africa</str<strong>on</strong>g>’s fast growing Telecomms Industry…<br />
Multinati<strong>on</strong>al group MTN has positi<strong>on</strong>ed itself as <str<strong>on</strong>g>Africa</str<strong>on</strong>g>’s<br />
biggest wireless operator, active in 21 countries across<br />
<str<strong>on</strong>g>Africa</str<strong>on</strong>g> and the Middle East. MTN is also c<strong>on</strong>solidating its<br />
positi<strong>on</strong> to take advantage of other opportunities that lie in<br />
<str<strong>on</strong>g>Africa</str<strong>on</strong>g>’s telecoms sector.<br />
We believe that the company has competitive aspirati<strong>on</strong>s in<br />
most <str<strong>on</strong>g>Africa</str<strong>on</strong>g>n countries that it does not have a presence in<br />
such as Zimbabwe, for example. Early this year, the<br />
company was in talks with state- owned mobile operator<br />
NetOne (Zimbabwe) about buying a 49% stake. NetOne is<br />
the smallest mobile operator by subscribers in Zimbabwe<br />
(market share of 12%), lagging behind Ec<strong>on</strong>et Wireless and<br />
Telecel (owned by Orascom Telecom). Indicati<strong>on</strong>s were<br />
that NetOne has been valued at between USD 500.0m and<br />
USD 800.0m.<br />
South <str<strong>on</strong>g>Africa</str<strong>on</strong>g>n communicati<strong>on</strong>s group Telkom is also<br />
c<strong>on</strong>sidering <str<strong>on</strong>g>Africa</str<strong>on</strong>g> as its next growth regi<strong>on</strong> and is looking<br />
at acquisiti<strong>on</strong>s after two to three years. According to<br />
management, the recent sale of its struggling Nigerian<br />
business Multi-Links to Visaf<strong>on</strong>e Communicati<strong>on</strong>s for USD<br />
52.0m was not a complete pullout from <str<strong>on</strong>g>Africa</str<strong>on</strong>g>'s most<br />
populous country.<br />
Canada and the USA<br />
Organisati<strong>on</strong>s such as Research in Moti<strong>on</strong> (RIM) and Google<br />
(USA) are looking to <str<strong>on</strong>g>Africa</str<strong>on</strong>g> for new growth opportunities.<br />
<str<strong>on</strong>g>Africa</str<strong>on</strong>g> is a strategic priority for RIM and the company is<br />
moving aggressively into the market to make the BlackBerry<br />
soluti<strong>on</strong> (smart ph<strong>on</strong>es, tablets and services such as the<br />
BlackBerry Internet Service) available to c<strong>on</strong>sumers.<br />
BlackBerry devices are now available in over 35 <str<strong>on</strong>g>Africa</str<strong>on</strong>g>n<br />
countries in partnership with over 80 mobile operators.<br />
Interestingly, <str<strong>on</strong>g>Africa</str<strong>on</strong>g> has also seen an evoluti<strong>on</strong> in mobile<br />
media. In additi<strong>on</strong>, mobile internet c<strong>on</strong>tinues to see str<strong>on</strong>g<br />
growth across <str<strong>on</strong>g>Africa</str<strong>on</strong>g>. AdMob, the mobile advertising<br />
company that is owned by Google, reported that is had seen<br />
an 81% growth in traffic in <str<strong>on</strong>g>Africa</str<strong>on</strong>g> in 2010 al<strong>on</strong>e, with three<br />
countries – Nigeria (21%), South <str<strong>on</strong>g>Africa</str<strong>on</strong>g> (21%) and Egypt (12%)<br />
– accounting for more than 50% of AdMob’s ad requests from<br />
<str<strong>on</strong>g>Africa</str<strong>on</strong>g> in December 2010. This growth has also been driven<br />
by low cost Android smart ph<strong>on</strong>es entering the market, such<br />
as the Ideos from Huawei which retails at about USD 100 in<br />
Kenya, DRC, Uganda, and other countries.<br />
According to Google, <str<strong>on</strong>g>Africa</str<strong>on</strong>g> has <strong>on</strong>ly <strong>on</strong>e web domain for<br />
every 10,000 people, versus a global average of 94 domains<br />
for every 10,000 people. As a result, Google has stepped up<br />
its efforts to create and enable more <str<strong>on</strong>g>Africa</str<strong>on</strong>g>n c<strong>on</strong>tent <strong>on</strong>line<br />
by providing Google products in many <str<strong>on</strong>g>Africa</str<strong>on</strong>g>n languages,<br />
including Swahili, Sh<strong>on</strong>a, Ndebele, Zulu and Afrikaans.<br />
France, also stepping up its investments...<br />
France Telecom, which is the world’s fifth largest mobile<br />
operator by subscribers has been <strong>on</strong> the c<strong>on</strong>tinent for over<br />
20 years and is a c<strong>on</strong>verged communicati<strong>on</strong>s player in<br />
<str<strong>on</strong>g>Africa</str<strong>on</strong>g> through mobile subsidiaries, fixed line businesses,<br />
internet service providers, and an investment in the <str<strong>on</strong>g>Africa</str<strong>on</strong>g><br />
Coast to Europe (ACE) fibre optic cable that stretches from<br />
France, runs al<strong>on</strong>g <str<strong>on</strong>g>Africa</str<strong>on</strong>g>’s western boundaries and extends<br />
from South <str<strong>on</strong>g>Africa</str<strong>on</strong>g> to the East <str<strong>on</strong>g>Africa</str<strong>on</strong>g>n coast through the<br />
LION and LION2 cables. France Telecom is currently the<br />
biggest internati<strong>on</strong>al investor in <str<strong>on</strong>g>Africa</str<strong>on</strong>g>’s bandwidth<br />
backb<strong>on</strong>e as it has c<strong>on</strong>tributed towards EASSy, SAT3WS,<br />
TEAMS, ACE, LION 1 and LION 2.<br />
France Telecom has set a target to earn EUR 7.0bn revenue<br />
from its emerging markets (<str<strong>on</strong>g>Africa</str<strong>on</strong>g>, the Middle East, and<br />
Asia) by 2015. The company has also earmarked SSA as <strong>on</strong>e<br />
of its priority prospect markets. It has also invested in<br />
Telkom Kenya and has managed to modernise and<br />
streamline the business into a c<strong>on</strong>verged ICT services<br />
provider.<br />
9
SSA TELECOMS COMPARATIVE ANALYSIS<br />
Company Name Country Market Cap (USDm) PER PER (T+1) PBV EV/EBITDA Div Yield ROE PBT Margin Net Margin EV/<str<strong>on</strong>g>Sub</str<strong>on</strong>g>(USD) ARPU (USD)<br />
Ec<strong>on</strong>et Wireless Zimbabwe 677.7 4.8 4.2 3.2 2.8 3.0% 62.4% 39.8% 28.5% 124.6 7.5<br />
MTN Group South <str<strong>on</strong>g>Africa</str<strong>on</strong>g> 35,224.5 17.9 12.9 3.6 5.5 2.5% 19.9% 24.5% 12.5% 248.1 9.1<br />
TNM Malawi Malawi 115.2 17.9 13.4 2.6 5.7 2.8% 15.0% 16.2% 10.7% 221.2 6.0<br />
Safaricom Limited Kenya 1,351.6 9.7 8.7 1.9 3.9 6.3% 20.3% 19.4% 13.9% 84.7 4.9<br />
Onatel Burkina Faso 319.4 13.7 13.6 2.0 3.2 5.8% 16.0% 19.1% 10.9% 146.6 7.0<br />
S<strong>on</strong>atel Senegal 2,546.7 7.6 7.7 2.3 3.7 11.5% 31.2% 35.5% 25.7% 218.8 9.6<br />
Vodacom Group Limited South <str<strong>on</strong>g>Africa</str<strong>on</strong>g> 18,343.3 16.3 14.2 8.6 7.6 3.9% 56.2% 20.7% 13.5% 451.2 15.8<br />
SSA Average 12.6 10.7 3.5 4.6 5.1% 31.6% 25.0% 16.5% 213.6 8.5<br />
MENA<br />
Company Name Country Market Cap (USDm) PER PER (T+1) PBV EV/EBITDA Div Yield ROE PBT Margin Net Margin<br />
Etisalat UAE 24,666 9.7 9.2 2.3 7.2 5.3% 22.1% 24.1% 24.9%<br />
Mobinil Egypt 1,751 8.6 29.1 2.5 4.0 11.8% 29.1% 15.0% 11.6%<br />
Orascom Telecom Holding S.A.E Egypt 3,890 11.6 4.1 2.0 4.1 0.0% 26.0% 23.1% 5.4%<br />
Pakistan Telecomms Pakistan 1,156 8.4 8.1 0.9 5.8 8.9% 9.9% 16.5% 11.1%<br />
Qatar Telecom Qatar 7,198 9.4 8.6 1.5 4.6 1.8% 19.4% 21.5% 10.8%<br />
Saudi Telecom Company Saudi Arabia 22,718 7.8 7.8 1.9 5.3 7.1% 24.9% 20.6% 19.7%<br />
Telecom Egypt Egypt 5,316 9.6 9.9 1.1 6.0 0.0% 11.6% 20.8% 32.0%<br />
MENA Average 9.3 11.0 1.7 5.3 5.0% 20.4% 20.2% 16.5%<br />
Emerging Markets<br />
Company Name Country Market Cap (USDm) PER PER (T+1) PBV EV/EBITDA Div Yield ROE PBT Margin Net Margin<br />
Bahrain <str<strong>on</strong>g>Telecoms</str<strong>on</strong>g>s Company Bahrain 1,948 7.0 7.8 1.5 4.5 10.1% 19.5% 31.5% 26.4%<br />
Bharti Airtel Ltd India 30,488 15.0 14.9 3.0 12.5 0.6% 23.6% 20.3% 16.7%<br />
Telekom Malaysia Bhd Malaysia 4,064 21.7 19.0 1.7 5.7 5.5% 16.1% 12.0% 11.2%<br />
Maroc Telecom S.A. Morocco 15,799 13.2 13.9 10.2 7.4 6.4% 60.0% 44.7% 29.6%<br />
Mobile Telesystems Russia 15,545 11.3 9.6 2.9 2.0 6.6% 28.3% 18.3% 12.2%<br />
Taiwan Mobile Co Taiwan 6,236 14.4 15.1 4.1 7.3 7.7% 29.9% 28.1% 20.5%<br />
Total Access Communicati<strong>on</strong>s Thailand 3,297 17.8 14.6 2.5 6.6 5.2% 15.8% 19.8% 15.1%<br />
SK Telecom Korea 11,627 10.2 6.3 1.8 1.6 5.4% 11.5% 16.3% 11.3%<br />
Emerging Markets Average 13.8 12.7 3.4 6.0 6.0% 25.6% 23.8% 17.9%<br />
Developed Markets<br />
Company Name Country Market Cap (USDm) PER PER (T+1) EV/EBITDA<br />
Deutsche Telecom Germany 60,195 13.1 12.7 4.6<br />
France Telecom France 58,807 8.6 9.1 4.8<br />
Swisscom Switzerland 21,460 11.2 10.8 6.4<br />
Telecom Italia Italia 26,576 8.6 8.1 4.7<br />
Telef<strong>on</strong>ica Spain 120,453 10.6 10.1 6.0<br />
NTT DoComo Japan 72,614 13.7 11.9 4.2<br />
Vodaph<strong>on</strong>e UK 134,828 11.0 10.2 8.7<br />
Millicom Sweden 10,731 16.8 14.6 6.8<br />
Developed Markets Average 11.7 10.9 5.8<br />
Mean 11.8 11.3 5.4<br />
Source: Bloomberg/URAL SIB <str<strong>on</strong>g>Report</str<strong>on</strong>g>/IAS Estimates/Reuters<br />
10
SSA <str<strong>on</strong>g>Telecoms</str<strong>on</strong>g>- Comparative Graphs<br />
Fig 12: PER & PBV Multiples<br />
20.0<br />
18.0<br />
16.0<br />
14.0<br />
Fig 13: EV/EBITDA vs EBITDA Margin<br />
9.00<br />
8.00<br />
7.00<br />
6.00<br />
60.0%<br />
50.0%<br />
40.0%<br />
12.0<br />
10.0<br />
5.00<br />
4.00<br />
30.0%<br />
8.0<br />
3.00<br />
20.0%<br />
6.0<br />
4.0<br />
2.0<br />
-<br />
Ec<strong>on</strong>et<br />
Wireless<br />
MTN Group TNM Malawi Safaricom<br />
Limited<br />
PER<br />
PBV<br />
Onatel S<strong>on</strong>atel Vodacom<br />
Group Limited<br />
2.00<br />
1.00<br />
0.00<br />
Ec<strong>on</strong>et<br />
Wireless<br />
Source: IAS Estimates<br />
MTN Group TNM Malawi Safaricom<br />
Limited<br />
EV/EBITDA-LHS<br />
Onatel S<strong>on</strong>atel Vodacom<br />
Group Limited<br />
EBITDA Margin-RHS<br />
10.0%<br />
0.0%<br />
Source: IAS Estimates<br />
Fig 14: EV/<str<strong>on</strong>g>Sub</str<strong>on</strong>g>scriber Vs Sales Growth<br />
Fig 15: ROE Vs Dividend Yield<br />
500<br />
40.0%<br />
14.0%<br />
70.0%<br />
450<br />
400<br />
350<br />
35.0%<br />
30.0%<br />
12.0%<br />
10.0%<br />
11.5%<br />
60.0%<br />
50.0%<br />
300<br />
25.0%<br />
8.0%<br />
40.0%<br />
250<br />
20.0%<br />
200<br />
15.0%<br />
6.0%<br />
6.3%<br />
5.8%<br />
30.0%<br />
150<br />
100<br />
50<br />
10.0%<br />
5.0%<br />
4.0%<br />
2.0%<br />
3.0%<br />
2.5%<br />
2.8%<br />
3.9%<br />
20.0%<br />
10.0%<br />
-<br />
Ec<strong>on</strong>et<br />
Wireless<br />
MTN Group TNM Malawi Safaricom<br />
Limited<br />
Onatel S<strong>on</strong>atel Vodacom<br />
Group Limited<br />
0.0%<br />
0.0%<br />
Ec<strong>on</strong>et<br />
Wireless<br />
MTN Group TNM Malawi Safaricom Onatel S<strong>on</strong>atel Vodacom<br />
Group<br />
0.0%<br />
Source: IAS Estimates<br />
EV/<str<strong>on</strong>g>Sub</str<strong>on</strong>g>(USD)-LHS<br />
Sales Growth_RHS<br />
Source: IAS Estimates<br />
Div Yield-LHS<br />
ROE-RHS<br />
Methodology<br />
Our research covers seven <str<strong>on</strong>g>Sub</str<strong>on</strong>g> <str<strong>on</strong>g>Saharan</str<strong>on</strong>g> <str<strong>on</strong>g>Africa</str<strong>on</strong>g>n telcos ; Ec<strong>on</strong>et Wireless Zimbabwe, MTN Group (SA), Onatel (BRVM),<br />
Safaricom (Kenya), S<strong>on</strong>atel (BRVM), TNM (Malawi) and Vodacom Group (SA). We have included MTN Group (SA) and<br />
Vodacom Group (SA) in the report. Since the two do not fall under our coverage universe they have been included for<br />
comparis<strong>on</strong> purposes. Financial forecasts for the two companies are based <strong>on</strong> Analyst c<strong>on</strong>sensus estimates compiled by<br />
Thoms<strong>on</strong> Reuters. We valued the companies through a comparative valuati<strong>on</strong> technique based <strong>on</strong> multiples such as PER,<br />
PBV, EV/<str<strong>on</strong>g>Sub</str<strong>on</strong>g> (USD) and EV/EBITDA given the similar nature of company operati<strong>on</strong>s. However, we have complemented<br />
this with Discounted Cash Flow (DCF) valuati<strong>on</strong>s, applying different assumpti<strong>on</strong>s <strong>on</strong> the companies depending <strong>on</strong> the<br />
company specific issues and geographical locati<strong>on</strong>.<br />
Recommendati<strong>on</strong> and C<strong>on</strong>clusi<strong>on</strong><br />
Broadly speaking, the phenomenal growth in <str<strong>on</strong>g>Africa</str<strong>on</strong>g>’s ICT sector has to a large extent driven GDP growth across the<br />
c<strong>on</strong>tinent. It is interesting to note that in 2008, the World Bank c<strong>on</strong>ducted an ec<strong>on</strong>ometric analysis across 120 countries<br />
to investigate the impact of <str<strong>on</strong>g>high</str<strong>on</strong>g>er penetrati<strong>on</strong> of broadband and other ICTs <strong>on</strong> ec<strong>on</strong>omic growth (the average growth<br />
rate of per capita GDP). The study c<strong>on</strong>cluded that impacts were somewhat greater in developing countries than in<br />
developed countries. For developing countries, every 10 percentage point increase in the penetrati<strong>on</strong> of broadband<br />
services was associated with an increase in per capita GDP of 1.38 percentage points; Internet and mobile ph<strong>on</strong>e<br />
penetrati<strong>on</strong> were associated with a 1.12 and 0.81 percentage point increase, respectively.<br />
Our findings are that SSA telcos exhibit a str<strong>on</strong>g investment case. While voice has reached saturati<strong>on</strong> levels in various<br />
jurisdicti<strong>on</strong>s, data appears to be the next growth avenue for SSA telcos. On the back of the data potential and str<strong>on</strong>g<br />
macro-ec<strong>on</strong>omic improvements, the development of under-sea cables, liberalisati<strong>on</strong> of the telecoms sector and<br />
infrastructural developments, we think exposure in this space is indeed a potent source of alpha. We would recommend<br />
investors to play this growth theme through Ec<strong>on</strong>et Wireless in Zimbabwe and S<strong>on</strong>atel (BRVM) from a l<strong>on</strong>g-term<br />
perspective, given their operati<strong>on</strong>al scale and market dominance. However, we think there are still competitive and<br />
regulatory pressures in Kenya and Burkina Faso. Therefore, we assign a HOLD recommendati<strong>on</strong> <strong>on</strong> Safaricom and Onatel.<br />
We see a speculative opportunity in Malawi’s TNM given the reports that it could be in talks with South <str<strong>on</strong>g>Africa</str<strong>on</strong>g>’s Vodacom<br />
Group.<br />
11
EQUITY RESEARCH<br />
ZIMBABWE<br />
September 2011<br />
TELECOMS<br />
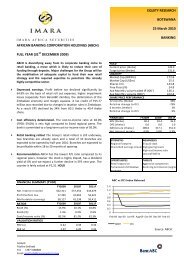
ECONET WIRELESS ZIMBABWE LIMITED<br />
Catch it when you can...<br />
Ec<strong>on</strong>et remains the undisputed leader in Zimbabwe’s<br />
domestic telecoms sector, commanding c70% of the<br />
mobile telecoms market, with a subscriber base of<br />
5.6m. A key <str<strong>on</strong>g>high</str<strong>on</strong>g>light is that competitors in the market<br />
such as Telecel and NetOne tend to lack the<br />
operati<strong>on</strong>al and financial strength to c<strong>on</strong>tend with<br />
Ec<strong>on</strong>et <strong>on</strong> an equal footing. This, in our view places<br />
Ec<strong>on</strong>et in a str<strong>on</strong>g positi<strong>on</strong>.<br />
• Leading the pack in terms of innovati<strong>on</strong>.<br />
Ec<strong>on</strong>et has maintained its positi<strong>on</strong> as a leader in<br />
terms of innovati<strong>on</strong> having already rolled out<br />
3G/EDGE. We expect the introducti<strong>on</strong> of new<br />
products to attract even more revenues for the<br />
company as well as increase its subscriber base.<br />
The company has also introduced loyalty<br />
programmes such as Ecolife and Eco-Cash (the<br />
company’s mobile m<strong>on</strong>ey transfer service which<br />
is similar to Safaricom’s M-PESA).<br />
• Broadband presents a new opportunity. We<br />
believe data presents significant opportunities<br />
for the company given that it has a head start<br />
over other players, in terms of penetrati<strong>on</strong>.<br />
Broad band penetrati<strong>on</strong> in Zimbabwe is still low<br />
and demand for Ec<strong>on</strong>et’s 3G services is likely to<br />
increase.<br />
• Compelling valuati<strong>on</strong>. On a mark to market basis<br />
Ec<strong>on</strong>et remains the cheapest SSA telco <strong>on</strong> a<br />
standout 4.2x PER 2012. We are surprised market<br />
players are still hesitant. H1 2012 results show a<br />
solid growth in subscriber numbers and robust<br />
growth <strong>on</strong> the bottom line. We believe now is an<br />
opportune moment to gain exposure. BUY<br />
BLOOMBERG: ECWH:ZH<br />
BUY<br />
Current price (USc) 405.0<br />
Target price (USc) 610.0<br />
Upside/Downside 51%<br />
Liquidity<br />
Market Cap (USDm) 677.7<br />
Shares (m) 167.3<br />
Free float (%) 27.0<br />
Ave. daily vol ('000) 175.0<br />
Share price performance<br />
6 M<strong>on</strong>ths (%) 481 -15.8%<br />
Relative change (%)* -7.6%<br />
12 M<strong>on</strong>ths (%) 471 -14.0%<br />
Relative change (%)* -16.4%<br />
*Relative to MSCI Index<br />
Financials (USDm) - FY 28 Feb 2011 2012F 2013F<br />
Turnover 493.5 589.7 693.2<br />
EBITDA 242.7 277.8 306.8<br />
Net finance income (7.2) (18.1) (10.7)<br />
Attributable earnings 140.4 162.8 187.7<br />
EPS (USc) 83.9 97.3 112.2<br />
NAV/share (USc) 127.7 225.0 304.7<br />
DPS (USc) 12.2 32.4 37.4<br />
Valuati<strong>on</strong> Ratios 2011 2012F 2013F<br />
<str<strong>on</strong>g>Sub</str<strong>on</strong>g>scribers' 000 5,510.0 5,789.9 6,034.6<br />
PER (x) 4.8 4.2 3.6<br />
PBV (x) 3.2 1.8 1.3<br />
EV/EBITDA (x) 2.8 2.5 2.2<br />
Gross ARPU (USD) 7.5 8.5 9.6<br />
EV/<str<strong>on</strong>g>Sub</str<strong>on</strong>g>scriber (USD) 124.6 118.6 113.8<br />
EBITDA Margin (%) 49% 47% 44%<br />
Earnings Yield (%) 21% 24% 28%<br />
Dividend Yield (%) 3.0% 8.0% 9.2%<br />
Gearing (%) 71.9% 34.8% 10.4%<br />
RoaA (%) 27.3% 23.9% 24.6%<br />
RoaE (%) 62.4% 46.4% 38.9%<br />
Ec<strong>on</strong>et: Price Vs Volume<br />
6.00<br />
5.00<br />
4.00<br />
3.00<br />
3,000,000<br />
2,500,000<br />
2,000,000<br />
1,500,000<br />
STRENGTHS<br />
Str<strong>on</strong>g brand name and market leader<br />
First mover advantage eg Ecolife/Ecocash<br />
Str<strong>on</strong>g management team<br />
Ec<strong>on</strong>omies of scale advantages<br />
3G Network in place<br />
WEAKNESSES<br />
Associated with litigati<strong>on</strong> issues and intercompany<br />
c<strong>on</strong>flicts that may present a negative image<br />
Demand for data services may be c<strong>on</strong>strained by<br />
a lack of corporate demand<br />
Gearing remains <str<strong>on</strong>g>high</str<strong>on</strong>g><br />
Energy disrupti<strong>on</strong>s ie ZESA power cuts<br />
2.00<br />
1.00<br />
-<br />
25-Feb-09<br />
25-Apr-09<br />
25-Jun-09<br />
25-Aug-09<br />
25-Oct-09<br />
25-Dec-09<br />
25-Feb-10<br />
25-Apr-10<br />
25-Jun-10<br />
25-Aug-10<br />
25-Oct-10<br />
25-Dec-10<br />
25-Feb-11<br />
25-Apr-11<br />
25-Jun-11<br />
25-Aug-11<br />
1,000,000<br />
500,000<br />
-<br />
OPPORTUNITIES<br />
Str<strong>on</strong>g ec<strong>on</strong>omic recovery to drive incomes<br />
Increase network coverage as a result of<br />
investments in fibre optic terrestial links<br />
Low broad band penetrati<strong>on</strong> in Zimbabwe<br />
presents a solid growth opportunity<br />
New products/services<br />
THREATS<br />
Increased competi<strong>on</strong>- recap of existing players<br />
Falling calling rates eg per sec billing<br />
Political instability in Zimbabwe<br />
Deteriorati<strong>on</strong> of the competitive envir<strong>on</strong>ment<br />
Reputati<strong>on</strong>al risks associated with external<br />
partners such as banks, insurance companies and<br />
software companies ( eg TrustCo issue)<br />
Volume Traded-RHS<br />
Price (USD)-LHS<br />
12
Nature of Operati<strong>on</strong>s<br />
Ec<strong>on</strong>et Wireless Zimbabwe Limited is the largest GSM<br />
mobile operator in Zimbabwe with a market share of c70%<br />
and more than 5.0m subscribers and 1,400 base stati<strong>on</strong>s.<br />
The company offers a unique blend of branded subscriber<br />
and pre-paid mobile ph<strong>on</strong>e services.<br />
Ec<strong>on</strong>et owns Ecoweb (51%), <strong>on</strong>e of the largest ISPs in<br />
Zimbabwe. This is supported by Ec<strong>on</strong>et’s wireless<br />
infrastructure and earth stati<strong>on</strong>, which also provides<br />
direct internati<strong>on</strong>al dial access to more than 244 countries<br />
and territories worldwide. The company also has 84.3%<br />
stake in Transacti<strong>on</strong> Processing Systems, a provider of<br />
financial transacti<strong>on</strong> switching, point of sale and other<br />
value added services that look to exploit the c<strong>on</strong>vergence<br />
of banking, IT and telecoms.<br />
Market Dynamics<br />
Generally, the Zimbabwean mobile teleph<strong>on</strong>y market is<br />
approaching saturati<strong>on</strong> with an estimated potential<br />
market of 7.0m users including fixed line subscribers<br />
(estimated total populati<strong>on</strong> of 13.0m people). Nati<strong>on</strong>al<br />
teleph<strong>on</strong>e penetrati<strong>on</strong> is estimated at 70% with mobile<br />
teleph<strong>on</strong>e penetrati<strong>on</strong> at 68%. Ec<strong>on</strong>et currently competes<br />
with two main rivals, Telecel (60% owned by Orascom) and<br />
Net-One (government owned). While the two remain<br />
relatively weaker than Ec<strong>on</strong>et, an aggressive network roll<br />
out by any of the competitors could potentially harm<br />
Ec<strong>on</strong>et’s market positi<strong>on</strong>, sales and margins. However,<br />
Ec<strong>on</strong>et has over the years, embarked <strong>on</strong> wide scale<br />
expansi<strong>on</strong> programs and aggressive marketing initiatives<br />
and this has given the company an edge over its<br />
competiti<strong>on</strong>.<br />
Overview of H1 2012 Financial Performance<br />
Attractive revenue and earnings growth. Ec<strong>on</strong>et<br />
released it H1 2012 financial results, which were broadly<br />
in line with our expectati<strong>on</strong>s. The mobile ph<strong>on</strong>e operator<br />
reported a 16% growth in earnings, mainly driven by<br />
growth in subscribers to about 5.6m. Revenues jumped<br />
24% to USD 290.9m from USD 235.5m and EBITDA<br />
increased 14% to USD 131.2m. Overall, eps rose to US 44c,<br />
up from US 38c in the same period last year. An interim<br />
dividend of US 11.8c per share was declared implying an<br />
annualised dividend yield of 6.0% and 4.0x cover.<br />
A decline in Data & SMS c<strong>on</strong>tributi<strong>on</strong> to revenue. Voice<br />
c<strong>on</strong>tributed 75.9% to total revenue, up from 62.9% the<br />
prior period (<strong>on</strong> improved network optimisati<strong>on</strong>) while<br />
data and SMS c<strong>on</strong>tributed 13%, down from 15%.<br />
Management attributed the decline in data c<strong>on</strong>tributi<strong>on</strong> to<br />
the introducti<strong>on</strong> of per sec<strong>on</strong>d billing which resulted in<br />
subscribers migrating from txt to voice. A total of 1.5m<br />
subscribers were c<strong>on</strong>nected to broadband whilst 590,000<br />
were <strong>on</strong> eTXT.<br />
Shareholder Structure<br />
% Shareholding<br />
Ec<strong>on</strong>et Wireless Global 44.18%<br />
Stanbic Nominees 9.33%<br />
Baclays Zimbabwe Nominees 7.67%<br />
Old Mutual Life Assurance 4.96%<br />
Austin Eco Holdings Limited 4.21%<br />
Old Mutual Zimbabwe Limited 2.31%<br />
Free Float 27.30%<br />
Source: IAS<br />
Fig 16: <str<strong>on</strong>g>Sub</str<strong>on</strong>g>scriber Growth Vs Market Share<br />
7,000<br />
6,000<br />
5,000<br />
4,000<br />
3,000<br />
2,000<br />
1,000<br />
-<br />
Source: IAS/Company <str<strong>on</strong>g>Report</str<strong>on</strong>g>s<br />
2006* 2007 2008 2009 2010 2011 2012F 2013F<br />
Ec<strong>on</strong>et ave. subs ('000)-LHS <str<strong>on</strong>g>Sub</str<strong>on</strong>g>sciber growth-RHS Market share %-RHS<br />
Income Statement (USDm) H1 2011 H1 2012 % Δ<br />
Revenue 235.5 290.9 24%<br />
EBITDA 114.9 131.2 14%<br />
D&A (22.5) (21.2) -6%<br />
Operating proft 92.4 110.1 19%<br />
Net finance costs (2.3) (11.7) 406%<br />
Profit before tax 90.1 102.6 14%<br />
Tax (25.8) (28.6) 11%<br />
Profit after tax 64.3 74.0 15%<br />
EPS (USD) 0.38 0.44 16%<br />
EBITDA Margin 48.8% 45.1%<br />
PBT Margin 38.3% 35.3%<br />
Earnings Margin 27.3% 25.4%<br />
Balance Sheet FY 2011 H1 2012 % Δ<br />
Total Assets 637.51 667.14 5%<br />
NAV 287.64 329.22 14%<br />
Current Assets 101.07 178.18 76%<br />
Current Liabilities 103.00 164.47 60%<br />
Current Ratio 0.98 1.08<br />
Cash Flow Statement H1 2011 H1 2012 % Δ<br />
Operating Activities 107.05 127.61<br />
Investing Activities (127.83) (57.15)<br />
Financing Activities 27.60 (31.07)<br />
Fig 17: Revenue C<strong>on</strong>tributi<strong>on</strong><br />
Other, 11.0%<br />
250%<br />
200%<br />
150%<br />
100%<br />
50%<br />
0%<br />
A drop in margins. EBITDA margins eased 370bps to 45%,<br />
negatively impacted fuel costs to power base stati<strong>on</strong>s and<br />
the increased cost of the network. Going forward, our<br />
main c<strong>on</strong>cerns relate to the likely squeeze <strong>on</strong> margins and<br />
ARPUs, exacerbated by the <str<strong>on</strong>g>high</str<strong>on</strong>g> base the company is<br />
coming from. In additi<strong>on</strong>, the move to retail (of<br />
accessories) is likely to impact margins. However,<br />
management has indicated that the company will focus <strong>on</strong><br />
maintaining the EBITDA margin at c49%.<br />
Data, 13.0%<br />
Source: IAS/Company <str<strong>on</strong>g>Report</str<strong>on</strong>g>s<br />
Voice, 76.0%<br />
13
It is worth menti<strong>on</strong>ing that the main investment attracti<strong>on</strong>s<br />
in Ec<strong>on</strong>et have been its healthy EBITDA margins. However,<br />
margins have eased from a peak of 58% (recorded in Jan to<br />
Feb 2009) largely due to network roll out and cost<br />
adjustments. Marketing costs are also likely to increase as<br />
the company revitalises its brands and opens new service<br />
centres across the country.<br />
Capex trending downwards but still remains a priority.<br />
Capex for H1 2012 amounted to USD 38.7m versus USD<br />
122.1m in H1 2011. It is likely that capex will c<strong>on</strong>tinue<br />
trending down as the capex burden eases. Ec<strong>on</strong>et has<br />
already spent about USD 470.0m <strong>on</strong> network expansi<strong>on</strong> since<br />
2009, when Zimbabwe adopted a multi-currency regime.<br />
Declining debt levels. Net gearing in H1 2012 improved to<br />
68% from 86% at year end and EBITDA interest coverage was<br />
<str<strong>on</strong>g>high</str<strong>on</strong>g> at 11.3x, although finance charges increased 406% as<br />
the company reached peak funding. Management has<br />
indicated that future expansi<strong>on</strong> shall be funded from<br />
internally generated cash flows. Cash generati<strong>on</strong> remains<br />
str<strong>on</strong>g with USD 127.6m being generated from operati<strong>on</strong>s.<br />
Operati<strong>on</strong>al Review<br />
Defending ARPUs. According to management, APRUs<br />
increased to USD 10.70 from USD 10.05 in FY 2011,<br />
supported by data, broadband and VAS such as Ecolife and<br />
eTXT. Generally, Ec<strong>on</strong>et enjoys <str<strong>on</strong>g>high</str<strong>on</strong>g>er ARPUs than local<br />
peers due to the <str<strong>on</strong>g>high</str<strong>on</strong>g> value subscriber base, mainly<br />
corporate who are <strong>on</strong> post-paid. The <str<strong>on</strong>g>high</str<strong>on</strong>g> value subscribers<br />
tend to reduce the incremental cost of adding low value<br />
subscribers.<br />
Fig 18: Ec<strong>on</strong>et ARPU Trend (USD)<br />
16.00<br />
14.00<br />
12.00<br />
10.00<br />
8.00<br />
6.00<br />
4.00<br />
2.00<br />
-<br />
2004 2005 2006 2007 2008 2009 2010F 2011F<br />
Source: IAS/Company <str<strong>on</strong>g>Report</str<strong>on</strong>g>s<br />
Fig 19: <str<strong>on</strong>g>Sub</str<strong>on</strong>g>scribers Vs Mobile Penetrati<strong>on</strong> Levels<br />
7,000.0<br />
6,000.0<br />
5,000.0<br />
4,000.0<br />
3,000.0<br />
2,000.0<br />
1,000.0<br />
-<br />
2006* 2007 2008 2009 2010 2011 2012F 2013F<br />
Ec<strong>on</strong>et <str<strong>on</strong>g>Sub</str<strong>on</strong>g>s ('000)-LHS<br />
Nati<strong>on</strong>al Cellular Penetrati<strong>on</strong>-RHS<br />
Addressable pop penetrati<strong>on</strong>-RHS<br />
Source: IAS/Company <str<strong>on</strong>g>Report</str<strong>on</strong>g>s<br />
300%<br />
250%<br />
200%<br />
150%<br />
100%<br />
50%<br />
0%<br />
<str<strong>on</strong>g>Sub</str<strong>on</strong>g>scriber numbers...Still a positive trend. In H1 2012,<br />
total subscribers increased 25% y-o-y to 5.6m, of which 99%<br />
of the subscriber base is pre-paid. While pre-paid users are<br />
naturally lower revenue users, they offer the advantage of<br />
being significantly cash generative with trade debtors<br />
limited to 1.0% of subscribers and bad debt to turnover low<br />
at approximately 6.0%.<br />
Cost c<strong>on</strong>tainment strategies to ease pressure <strong>on</strong> margins.<br />
Ec<strong>on</strong>et distributes circa 50% of airtime through electr<strong>on</strong>ic<br />
platforms, reducing costs and facilitating smoother<br />
distributi<strong>on</strong>. In additi<strong>on</strong>, the telco has VSAT equipment,<br />
which allows it to handle its own internati<strong>on</strong>al traffic,<br />
further reducing cost and aiding service delivery. The<br />
company has also entered the handset retail market,<br />
offering branded handset in partnership with ZTE.<br />
Outlook<br />
A positive outlook <strong>on</strong> dividends. As menti<strong>on</strong>ed above,<br />
Ec<strong>on</strong>et is past its peak funding cycle, implying significant<br />
“free cash flows” that enable the telco to return values to<br />
shareholders in the form of dividends.<br />
Valuati<strong>on</strong> and Recommendati<strong>on</strong><br />
We believe that a negative corporate governance percepti<strong>on</strong><br />
<strong>on</strong> Ec<strong>on</strong>et may have been weighing <strong>on</strong> the share price.<br />
However, we think it has been overd<strong>on</strong>e. The telco is cheap<br />
at an EV/<str<strong>on</strong>g>Sub</str<strong>on</strong>g> of USD 125 versus an SSA average of USD 214.<br />
Our two valuati<strong>on</strong> methods (EV/subscriber and DCF) yield a<br />
fair value of USD 6.10 per share, implying 51% potential<br />
upside. BUY<br />
Fig 20: Disaggregati<strong>on</strong> of <str<strong>on</strong>g>Sub</str<strong>on</strong>g>scriber Types<br />
100%<br />
90%<br />
80%<br />
70%<br />
60%<br />
50%<br />
40%<br />
30%<br />
20%<br />
10%<br />
0%<br />
2006* 2007 2008 2009 2010 2011 2012F 2013F<br />
Ave c<strong>on</strong>tact subscibers ('000) Ave pre-paid subscribers ('000)<br />
Source: IAS/Company <str<strong>on</strong>g>Report</str<strong>on</strong>g>s<br />
Fig 21: Ec<strong>on</strong>et Financial Analysis<br />
800.0<br />
700.0%<br />
700.0<br />
600.0%<br />
600.0<br />
500.0%<br />
500.0<br />
400.0%<br />
400.0<br />
300.0%<br />
300.0<br />
200.0%<br />
200.0<br />
100.0%<br />
100.0<br />
0.0%<br />
0.0<br />
-100.0%<br />
2010 2011 2012F 2013F<br />
Turnover-LHS EBITDA-LHS Sales growth -RHS EBITDA growth-RHS<br />
Source: IAS/Company <str<strong>on</strong>g>Report</str<strong>on</strong>g>s<br />
14
ECONET - 5 YEAR CGR COMPARISON<br />
28 FEBRUARY (USDm) 2006* 2007 2008 2009 2010 2011 2012F 2013F 5yr CAGR<br />
Balance Sheet<br />
Shareholders' equity 4.1 49.2 61.3 81.2 163.2 286.7 414.5 549.4 133%<br />
Minority interests 0.0 0.0 0.2 5.7 2.3 2.8 3.4 4.1 220%<br />
Total shareholders' equity 4.4 69.7 81.1 127.2 201.2 335.1 463.4 599.1 138%<br />
Interest Bearing Debt 0.0 0.6 0.0 9.1 138.7 240.9 192.7 123.3<br />
Trade creditors 5.0 1.3 1.7 40.0 14.4 53.9 61.9 72.7 61%<br />
Current Liabilities 10.9 3.1 1.8 40.1 52.8 60.7 68.5 80.4 41%<br />
Total Liabilities and equity 15.3 73.4 82.9 176.4 392.7 636.6 724.6 802.8 111%<br />
Fixed Assets 2.8 54.2 38.5 134.4 267.5 498.9 534.9 574.9 182%<br />
Investments 1.1 15.7 42.8 13.3 0.0 31.1 31.1 32.6 94%<br />
Stock - Trade net 0.2 0.1 0.2 25.3 8.7 33.6 44.2 67.5 181%<br />
Debtors 4.8 1.2 1.2 0.1 30.5 0.5 0.8 1.2 -36%<br />
Cash at bank 0.3 0.2 0.1 0.1 13.9 34.7 48.5 66.1 161%<br />
Current Assets 10.4 3.0 1.5 25.6 53.2 68.9 93.8 135.4 46%<br />
Total Assets 15.3 73.4 82.9 176.4 392.7 636.6 724.6 802.8 111%<br />
Income Statement<br />
Turnover 31.8 34.6 21.4 87.9 362.8 493.5 589.7 693.2 73%<br />
EBITDA 16.1 16.1 6.1 26.6 179.3 242.7 277.8 306.8 72%<br />
Associate income 0.5 2.5 8.4 -1.1 1.9 0.0 0.0 0.0 -100%<br />
Profit before tax 18.2 22.3 58.3 3.1 148.1 196.5 217.9 251.1 61%<br />
Taxati<strong>on</strong> 5.9 5.9 11.7 5.1 34.9 55.5 54.5 62.8 57%<br />
Profit after tax 12.3 16.4 46.6 -2.1 113.2 141.0 163.4 188.4 63%<br />
Minorities 0.0 0.0 0.0 0.1 -1.4 0.5 0.6 0.7 102%<br />
Attributable Income 12.3 16.4 46.6 -2.2 114.6 140.4 162.8 187.7 63%<br />
Ratios<br />
Weighted shares (m) 163.8 163.8 163.8<br />
EPS (USc) 7.4 9.8 27.8 - 1.3 68.5 83.9 97.3 112.2<br />
Cash EPS (USc) 6.7 10.3 28.1 9.7 79.3 107.3 122.3 139.0<br />
DPS (USc) 2.5 3.3 0.8 - 22.8 12.2 32.4 37.4<br />
NAV per share (USc) 2.5 1.0 3.0 (1.3) 74.9 127.7 225.0 304.7<br />
Growth Ratios<br />
Sales growth 8.7% -38.1% 310.4% 312.5% 36.0% 19.5% 17.6%<br />
EBITDA growth -0.1% -62.4% 338.9% 575.1% 35.4% 14.5% 10.4%<br />
Earnings growth 32.8% 184.5% -104.7% -5282.6% 22.5% 15.9% 15.2%<br />
Margins<br />
Gross Margin 75% 76.6% 84.0% 78.6% 80.0% 80.0% 80.0% 80.0%<br />
EBITDA Margin 50.5% 46.5% 28.2% 30.2% 49.4% 49.2% 47.1% 44.3%<br />
PBT Margin 57.3% 64.5% 272.0% 3.5% 40.8% 39.8% 37.0% 36.2%<br />
Interest cover (times) n/a n/a 1.2 9.1 35.7 28.1 13.1 24.5<br />
Earnings Margin 38.7% 47.3% 217.4% -2.5% 31.6% 28.5% 27.6% 27.1%<br />
* 8 m<strong>on</strong>ths<br />
*Note: Financial figures for 2006 to 2008 were derived using the Old Mutual Implied Rate (OMIR), which may not reflect a true<br />
account due to variability of exchange rates during that period.<br />
15
EQUITY RESEARCH<br />
SOUTH AFRICA<br />
September 2011<br />
TELECOMS<br />
MTN GROUP LIMITED<br />
Employing an “omnipresence” strategy in <str<strong>on</strong>g>Africa</str<strong>on</strong>g>...<br />
MTN, which is already active across 21 countries in<br />
<str<strong>on</strong>g>Africa</str<strong>on</strong>g> and the Middle East, has been looking to increase<br />
its data revenue as the mobile industry matures in<br />
several of its key markets. Given fewer opportunities<br />
for acquisiti<strong>on</strong>s in emerging markets, we believe the<br />
company will be focusing more <strong>on</strong> increasing its payouts<br />
to shareholders and therefore view the company<br />
as a dividend play.<br />
• Room for data and VAS growth. MTN believes<br />
that it can leverage data service opportunities.<br />
Currently, data c<strong>on</strong>tributes 12.3% of total<br />
revenues. MTN’s business model is evolving.<br />
Although there is still c<strong>on</strong>siderable untapped<br />
demand for voice services in many markets, MTN<br />
is also investing in and expanding its<br />
infrastructure to enable more use of data<br />
services. As smart ph<strong>on</strong>es become more<br />
accessible to more people, demand for internet<br />
services grows and so MTN’s opportunity expands.<br />
• VAS is also being applied across various<br />
countries. MTN Liberia, for example has formally<br />
launched a ‘Mobile M<strong>on</strong>ey’ service in the country<br />
in partnership with Ecobank-Liberia. The new<br />
service enables MTN subscribers to access m<strong>on</strong>ey<br />
via their mobile ph<strong>on</strong>es. MTN is also looking to<br />
facilitate an increase in the availability of smart<br />
ph<strong>on</strong>es in various markets.<br />
• Ratings look demanding. At a PER of 17.9x and<br />
EV/<str<strong>on</strong>g>Sub</str<strong>on</strong>g>scriber of USD 248, MTN is not cheap<br />
relative to SSA and emerging market peers.<br />
However, we think that MTN’s rating is pricing in<br />
its massive subscriber numbers and the attractive<br />
dividend outlook as indicati<strong>on</strong>s are that cash will<br />
be returned to shareholders in the event that new<br />
acquisiti<strong>on</strong>s are not c<strong>on</strong>cluded.<br />
BLOOMBERG: MTN:SJ<br />
NOT RATED<br />
Current price (ZAR) 138.6<br />
Current price (USD) 18.7<br />
Target price (ZAR)<br />
Target price (USD)<br />
Upside/Downside (%)<br />
Liquidity<br />
Market Cap (ZARm) 261,272.1<br />
Market Cap (USDm) 35,224.5<br />
Shares (m) 1,884.7<br />
Free float (%)<br />
Ave. daily vol ('000) 6,826<br />
Share price performance<br />
6 M<strong>on</strong>ths (%) 125.75 10.2%<br />
Relative change (%)* 18.4%<br />
12 M<strong>on</strong>ths (%) 123.2 12.5%<br />
Relative change (%)* 10.1%<br />
*Relative to MSCI Index<br />
Financials (ZARm) - FY 31 Dec 2010 2011F 2012F<br />
Turnover 114,684 119,558 129,600<br />
EBITDA 47,306 50,413 56,028<br />
Profit before tax 28,095 30,767 36,397<br />
Profit after tax 16,827 23,682 27,475<br />
EPS (ZAR) 7.76 10.74 12.46<br />
NAV/share (ZAR) 39.00 38.46 38.57<br />
DPS (ZAR) 3.43 6.57 8.49<br />
Valuati<strong>on</strong> Ratios 2010 2011F 2012F<br />
<str<strong>on</strong>g>Sub</str<strong>on</strong>g>scribers' 000 141,600 153,000 160,000<br />
PER (x) 17.9 12.9 11.1<br />
PBV (x) 3.6 3.6 3.6<br />
EV/EBITDA (x) 5.5 5.2 4.6<br />
Gross ARPU (USD) 9.1 8.8 9.1<br />
EV/<str<strong>on</strong>g>Sub</str<strong>on</strong>g>scriber (USD) 248.1 229.6 219.5<br />
EBITDA Margin 41.2% 42.2% 43.2%<br />
Earnings Yield 5.6% 7.7% 9.0%<br />
Dividend Yield 2.5% 4.7% 6.1%<br />
Gearing 49.1% 50.8% 52.9%<br />
RoaA 9.2% 12.9% 14.4%<br />
RoaE 19.9% 27.9% 32.3%<br />
MTN: Price Vs Volume<br />
18,000<br />
16,000<br />
14,000<br />
12,000<br />
160,000,000<br />
140,000,000<br />
120,000,000<br />
100,000,000<br />
STRENGTHS<br />
Str<strong>on</strong>g brand name <strong>on</strong> the <str<strong>on</strong>g>Africa</str<strong>on</strong>g>n c<strong>on</strong>tinent<br />
Financial strength and operati<strong>on</strong>al expertise<br />
enables the group to take advantage of acquisiti<strong>on</strong>s<br />
Strategic partnerships across various sectors and<br />
regi<strong>on</strong>s e.g Banks, Medical Companies and Educati<strong>on</strong><br />
WEAKNESSES<br />
Exposure to <str<strong>on</strong>g>high</str<strong>on</strong>g> risk countries eg Ivory Coast<br />
and the MENA regi<strong>on</strong><br />
Exposure to currencies other than reporting<br />
currency creates translati<strong>on</strong>-related risks<br />
10,000<br />
8,000<br />
6,000<br />
4,000<br />
2,000<br />
-<br />
02-Jan-08<br />
02-Mar-08<br />
02-May-08<br />
02-Jul-08<br />
02-Sep-08<br />
02-Nov-08<br />
02-Jan-09<br />
02-Mar-09<br />
02-May-09<br />
02-Jul-09<br />
02-Sep-09<br />
02-Nov-09<br />
02-Jan-10<br />
02-Mar-10<br />
02-May-10<br />
02-Jul-10<br />
02-Sep-10<br />
02-Nov-10<br />
02-Jan-11<br />
02-Mar-11<br />
02-May-11<br />
02-Jul-11<br />
02-Sep-11<br />
80,000,000<br />
60,000,000<br />
40,000,000<br />
20,000,000<br />
-<br />
OPPORTUNITIES<br />
Low mobile penetrati<strong>on</strong> in SSA markets<br />
C<strong>on</strong>siderable scope for growth in data services<br />
Further diversificati<strong>on</strong> of operating portfolio can<br />
reduce the c<strong>on</strong>centrati<strong>on</strong> of risk<br />
Support to local banks can foster the development<br />
of bankable strategic alliances<br />
THREATS<br />
Increased regulati<strong>on</strong>s in various countries<br />
Slowing revenue growth in some of the<br />
markets as a result of maturity<br />
Shortages of skilled human resources<br />
Volume Traded-RHS<br />
Price (ZAR)-LHS<br />
16
Nature of Operati<strong>on</strong>s<br />
Incorporated in 1994, MTN is a multi-nati<strong>on</strong>al telecoms<br />
group offering voice and data communicati<strong>on</strong>s products<br />
and services to individuals and businesses. MTN has GSM<br />
licences in 21 countries and ISP businesses in 13 countries,<br />
spanning three c<strong>on</strong>tinents. MTN has also made<br />
investments in fibre optic cables such as the USD 90.0m<br />
investment in the West <str<strong>on</strong>g>Africa</str<strong>on</strong>g> Cable System (WACS) so as<br />
to increase access to broadband capacity.<br />
MTN operates in three regi<strong>on</strong>s: South and East <str<strong>on</strong>g>Africa</str<strong>on</strong>g><br />
(SEA), West and Central <str<strong>on</strong>g>Africa</str<strong>on</strong>g> (WECA), and the Middle<br />
East and North <str<strong>on</strong>g>Africa</str<strong>on</strong>g> (MENA). MTN SEA is made up of GSM<br />
licences in MTN South <str<strong>on</strong>g>Africa</str<strong>on</strong>g>, MTN Swaziland, MTN<br />
Zambia, MTN Uganda, MTN Rwanda and Mascom Botswana<br />
and ISP businesses in South <str<strong>on</strong>g>Africa</str<strong>on</strong>g>, Uganda, Rwanda,<br />
Zambia, Namibia, Kenya and Botswana. MTN WECA<br />
comprises GSM licences in MTN Nigeria, MTN Ghana, MTN<br />
Camero<strong>on</strong>, MTN C<strong>on</strong>go-Brazzaville, MTN Côte d’Ivoire,<br />
MTN Benin, MTN Guinea-Bissau, MTN Guinea C<strong>on</strong>akry and<br />
MTN Liberia and ISP businesses in Nigeria, Camero<strong>on</strong>, Côte<br />
d’Ivoire and Ghana. MTN MENA c<strong>on</strong>sists of GSM licences in<br />
MTN Irancell, MTN Syria, MTN Sudan, MTN Afghanistan,<br />
MTN Yemen and MTN Cyprus and ISP businesses in Syria<br />
and Cyprus.<br />
Shareholder Structure<br />
% Shareholding<br />
Public 67.9%<br />
N<strong>on</strong>-public 32.1%<br />
GEPF 17.6%<br />
Lombard Odier Darier 9.8%<br />
Empowerment entities 4.5%<br />
Directors of MTN Group 0.2%<br />
Source: IAS<br />
Fig 22: MTN Group Structure<br />
Market Dynamics in South <str<strong>on</strong>g>Africa</str<strong>on</strong>g><br />
Competiti<strong>on</strong> in the South <str<strong>on</strong>g>Africa</str<strong>on</strong>g>n mobile<br />
telecommunicati<strong>on</strong>s industry has intensified over the last<br />
few years, most recently due to the entry of SA’s fourth<br />
operator, 8ta, as well as the aggressive targeting of data<br />
services. The data space is currently experiencing<br />
aggressive price competiti<strong>on</strong>, a feature we expect to<br />
c<strong>on</strong>tinue for some time as operators vie for market share.<br />
Overview of H1 2011 Financial Performance<br />
Narrow growth in revenues. The company reported a<br />
1.0% growth in H1 2011 revenues to ZAR 55.9bn (USD<br />
7.9bn). The low growth was largely due to currency swings<br />
and slower growth in some of its major markets.<br />
Firm margins in most markets. The good news was that<br />
the EBITDA margin was propped up by the profit <strong>on</strong> the<br />
sale of towers in Ghana. EBITDA rose by 3.9% due to<br />
increases <strong>on</strong> a local currency basis of 9.4% in SA, 16.8% in<br />
Nigeria and 30.8% in Iran.<br />
Hefty dividend increase. Overall, the group closed in a<br />
net positive cash positi<strong>on</strong> (ZAR 2.67bn) largely due to<br />
lower capex and improved EBITDA margins. Capex was<br />
32.4% lower at ZAR 5.71bn following delays in the rollout<br />
of certain capex projects and a ZAR 603.0m forex<br />
impact. An interim dividend of 273cps (H1 2010: 151cps)<br />
was declared, increasing the dividend payout to 65%.<br />
Operati<strong>on</strong>al Review<br />
Solid subscriber growth. Total subscribers rose by 7.5%<br />
since December 2010 to 152.3m. MTN South<br />
<str<strong>on</strong>g>Africa</str<strong>on</strong>g> increased its subscriber base by 5.1% to 19.8m. The<br />
rise in subscribers was mainly due to growth in the<br />
prepaid segment which increased its subscriber base by 5%<br />
to 16.2m. The group expects net additi<strong>on</strong>s of 16.9m<br />
subscribers in 2011, led by growth in Nigeria, Iran and<br />
South <str<strong>on</strong>g>Africa</str<strong>on</strong>g>.<br />
Source: Company <str<strong>on</strong>g>Report</str<strong>on</strong>g>s<br />
Income Statement (ZARm) H1 2010 H1 2011 % Δ<br />
Revenue 55,989 56,542 1%<br />
EBITDA 24,249 25,202 4%<br />
Operating Profit 16,906 17,767 5%<br />
Net Finance costs 2,198 587 -73%<br />
Profit before tax 14,767 17,166 16%<br />
Profit after tax 9,337 10,823 16%<br />
Attributable profit 8,094 9,450 17%<br />
EBITDA Margin 43.3% 44.6% 3%<br />
PBT Margin 26.4% 30.4% 15%<br />
PAT Margin 16.7% 19.1% 15%<br />
17
KEY MARKETS<br />
Nigeria grew its subscriber base by 4.8% to 40.5m. However,<br />
Nigerian ARPU declined by 6.7% to USD 9.8/user.<br />
Fig 23: MTN Revenue C<strong>on</strong>tributi<strong>on</strong><br />
Ghana<br />
3%<br />
Syria<br />
3%<br />
Iran<br />
5%<br />
SEA<br />
21%<br />
Irancell maintained its market share at 44% and recorded an<br />
8.2% rise in subscribers to 32.2m. The third operator has not<br />
yet been launched commercially. Populati<strong>on</strong> and geographic<br />
coverage increased to 79% and 22%, respectively.<br />
RSA<br />
17%<br />
MTN Ghana had registered 90% of its subscribers. ARPUs<br />
declined by 3.9% to USD 7.0/user.<br />
Nigeria<br />
16%<br />
WECA<br />
24%<br />
Direct network operating costs rose by 51.9% due to <str<strong>on</strong>g>high</str<strong>on</strong>g>er<br />
electricity and diesel costs. Data growth was still primarily<br />
driven by South <str<strong>on</strong>g>Africa</str<strong>on</strong>g>. Data revenue (excluding SMS)<br />
overtook SMS revenue for the first time and c<strong>on</strong>tributed 6.3%<br />
and 6% respectively to total revenue. Airtime and<br />
subscripti<strong>on</strong> revenue remain the key c<strong>on</strong>tributors to revenue<br />
comprising 66.1% of the group’s total revenue despite<br />
decreasing by 2.8%. Mobile M<strong>on</strong>ey had been implemented in<br />
12 countries and Nigeria is expected to introduce this product<br />
using a partnership model.<br />
Outlook<br />
Network investment and rollout remains priority. The<br />
group will c<strong>on</strong>tinue to upgrade and optimise networks to<br />
meet increased demand for data services and has approved<br />
capital expenditure of ZAR 22.1bn for 2011. Network quality<br />
is <strong>on</strong>e of MTN’s key competitive advantages.<br />
Source: IAS/Company <str<strong>on</strong>g>Report</str<strong>on</strong>g>s<br />
MENA<br />
11%<br />
Acquisiti<strong>on</strong> opportunities <strong>on</strong> the cards. Management has<br />
indicated that the company is looking for opti<strong>on</strong>s to increase<br />
dividend payouts to shareholders but are also assessing an<br />
acquisiti<strong>on</strong> in North <str<strong>on</strong>g>Africa</str<strong>on</strong>g>, where MTN could buy anything<br />
worth up to USD 5.0bn in enterprise value. Political<br />
instability in countries such as Yemen and Syria has however<br />
created an exigent business envir<strong>on</strong>ment in recent times.<br />
Cost benefits expect to boost competitiveness. MTN<br />
expects to leverage <strong>on</strong> a new structural framework that it<br />
has formed for key projects that includes cost-effective<br />
platforms for delivery of data and services; <strong>on</strong>going<br />
standardisati<strong>on</strong> of systems and processes; increased<br />
centralisati<strong>on</strong> of procurement activities and rati<strong>on</strong>alisati<strong>on</strong> of<br />
suppliers; and shared services and outsourcing. Rather than<br />
follow a “big bang” approach, the group plans to establish<br />
successful shared services and outsourcing models in certain<br />
markets, before extending them to other operati<strong>on</strong>s.<br />
More of a dividend play. MTN will c<strong>on</strong>tinue to investigate<br />
opti<strong>on</strong>s to improve sustainable returns to shareholders now<br />
that a <str<strong>on</strong>g>high</str<strong>on</strong>g>er dividend payout policy has been adopted. It will<br />
also engage with authorities to sustain the social and<br />
commercial success of the telecommunicati<strong>on</strong>s sector.<br />
Comment<br />
At a PER of 17.9x and EV/<str<strong>on</strong>g>Sub</str<strong>on</strong>g>scriber of USD 248, MTN is not<br />
cheap relative to SSA and other emerging market telcos.<br />
However, we think that MTN’s rating is pricing in its massive<br />
subscriber numbers and an attractive dividend outlook as<br />
indicati<strong>on</strong>s are that cash will be returned to shareholders in<br />
the event that new acquisiti<strong>on</strong>s are not c<strong>on</strong>cluded.<br />
Fig 25: MTN Financial Analysis<br />
140,000<br />
120,000<br />
100,000<br />
80,000<br />
60,000<br />
40,000<br />
20,000<br />
-<br />
2009 2010 2011F 2012F<br />
Turnover (ZARm)-LHS<br />
Operating Profit (ZARm)-LHS<br />
Sales growth -RHS<br />
EBITDA growth-RHS<br />
Source: IAS/Company <str<strong>on</strong>g>Report</str<strong>on</strong>g>s<br />
12.0%<br />
10.0%<br />
8.0%<br />
6.0%<br />
4.0%<br />
2.0%<br />
0.0%<br />
18
MTN GROUP - 5 YEAR CGR COMPARISON<br />
31 DEC (ZARm) 2005 2006 2007 2008 2009 2010 2011F 2012F 5yr CAGR<br />
Balance Sheet<br />
Shareholders' equity 19,716 38,696 47,315 76,386 70,011 71,855 72,493 72,689 30%<br />
Minority interests 3,380 4,033 4,187 4,156 2,855 2,219 2,263 2,309 -8%<br />
Total shareholders' equity 23,096 42,729 51,502 80,542 72,866 74,074 74,756 74,997 26%<br />
Current Liabilities 11,951 19,985 34,970 54,591 54,945 46,717 49,112 52,883 31%<br />
Total Liabilities and equity 44,812 96,917 115,586 170,106 156,237 154,786 159,765 165,805 28%<br />
PPE 20,676 30,647 39,463 64,193 67,541 63,361 64,311 65,340 25%<br />
Current Assets 13,676 20,635 33,501 54,787 46,024 55,059 57,276 60,384 32%<br />
Total Assets 44,812 96,917 115,586 170,106 156,237 154,786 159,765 165,805 28%<br />
Income Statement<br />
Revenue 27,212 51,595 73,145 102,526 111,947 114,684 119,558 129,600 33%<br />
Selling & distributi<strong>on</strong> expenses (4,736) (7,949) (9,071) (13,274) (14,649) (14,741) (15,773) (16,877) 25%<br />
Other operating expenses (1,490) (2,839) (4,592) (7,743) (7,837) (10,446) (10,885) (11,342) 48%<br />
Impairment of PPE - - (212) (225) (167) 231 (169) (170)<br />
Depreciati<strong>on</strong> of PPE (2,497) (5,030) (6,774) (9,939) (11,807) (13,280) (13,944) (14,641) 40%<br />
Amortisati<strong>on</strong> of intangible assets (256) (1,289) (2,199) (2,820) (2,668) (2,120) (2,226) (2,337) 53%<br />
Operating Profit 8,478 16,094 22,872 30,407 31,588 32,137 34,074 38,880 31%<br />
Finance income 422 1,880 1,780 6,727 6,420 2,077 3,116 4,673 38%<br />
Finance costs (795) (3,307) (4,953) (8,644) (12,230) (6,171) (6,480) (7,218) 51%<br />
Profit before tax 8,115 14,690 19,707 28,490 25,773 28,095 30,767 36,397 28%<br />
Income tax expense (1,411) (2,591) (7,791) (11,355) (8,612) (11,268) (7,084) (8,922) 52%<br />
Profit after tax 6,704 12,099 11,916 17,135 17,161 16,827 23,682 27,475 20%<br />
Ratios<br />
Weighted shares (m) 1,663.17 1,752.56 1,861.38 1,865.41 1,851.15 1,842.31 1,884.67 1,884.67<br />
EPS (ZAR) 3.53 6.05 5.70 8.21 7.91 7.76 10.74 12.46<br />
DPS (ZAR) 0.65 0.65 0.90 1.36 1.81 3.43 6.57 8.49<br />
NAV/Share 11.85 22.08 25.42 40.95 37.82 39.00 38.46 38.57<br />
Dividend Cover 5.43 9.31 6.33 6.04 4.37 2.26 1.63 1.47<br />
Dividend Yield 0.5% 0.5% 0.6% 1.0% 1.3% 2.5% 4.7% 6.1%<br />
Growth Ratios<br />
Sales growth 89.6% 41.8% 40.2% 9.2% 2.4% 4.3% 8.4%<br />
EBITDA growth 99.6% 43.0% 35.4% 6.5% 2.3% 6.6% 11.1%<br />
Op Profit growth 89.8% 42.1% 32.9% 3.9% 1.7% 6.0% 14.1%<br />
PBT growth 81.0% 34.2% 44.6% -9.5% 9.0% 9.5% 18.3%<br />
Earnings growth 80.9% 0.0% 44.4% -4.3% -2.4% 41.5% 16.0%<br />
Margins<br />
EBITDA Margin 41.3% 43.4% 43.8% 42.3% 41.3% 41.2% 42.2% 43.2%<br />
OP Margin 31.2% 31.2% 31.3% 29.7% 28.2% 28.0% 28.5% 30.0%<br />
PBT Margin 29.8% 28.5% 26.9% 27.8% 23.0% 24.5% 25.7% 28.1%<br />
Earnings Margin 21.6% 20.6% 14.5% 14.9% 13.1% 12.5% 16.9% 18.1%<br />
Effective Tax Rate 17.4% 17.6% 39.5% 39.9% 33.4% 40.1% 23.0% 24.5%<br />
Note: Given that our focus is mainly <strong>on</strong> SSA Excluding South <str<strong>on</strong>g>Africa</str<strong>on</strong>g> this secti<strong>on</strong> has been compiled strictly for comparative<br />
purposes. Also note that our forecasts are based <strong>on</strong> Thomps<strong>on</strong> Reuters c<strong>on</strong>sensus estimates.<br />
19
EQUITY RESEARCH<br />
BRVM<br />
September 2011<br />
TELECOMS<br />
ONATEL<br />
Office Nati<strong>on</strong>al des Telecommunicati<strong>on</strong>s du Burkina Faso<br />
Competitive forces looming in the market…<br />
As part of a privatisati<strong>on</strong> program, the Government of<br />
Burundi appointed Projet de Development des Secteurs<br />
Financier et Prive (PDSFP), a World Bank funded project,<br />
to handle the privatisati<strong>on</strong> of ONATEL. The move was<br />
largely aimed at providing government with an avenue to<br />
sell-off a stake in the operator, which was facing intense<br />
competiti<strong>on</strong> in its home market. The company is now 51%<br />
owned by Maroc Telecom.<br />
• Competiti<strong>on</strong> intensifying. The telecoms industry in<br />
Burkina Faso has been marked by competiti<strong>on</strong> and<br />
this has resulted in an erosi<strong>on</strong> of prices. In<br />
additi<strong>on</strong>, the adopti<strong>on</strong> of per sec<strong>on</strong>d billing has also<br />
slowed down revenue growth. Onatel’s H1 2011<br />
bottom-line performance was disappointing as the<br />
profit figure was significantly below our<br />
expectati<strong>on</strong>s. On the top-line, c<strong>on</strong>solidated<br />
revenues amounted to XOF 46.8bn, representing an<br />
11% decrease <strong>on</strong> H1 2010.<br />
• Comparative Valuati<strong>on</strong> looks good. On an<br />
EV/EBITDA basis, ONATEL lags its peers, with an<br />
EV/EBITDA of <strong>on</strong>ly 3.2x, significantly lower than the<br />
SSA and MENA averages of 4.6x and 5.3x,<br />
respectively. We believe ONATEL’s point of<br />
strength in terms of valuati<strong>on</strong> is that it is tightly<br />
held and downside risk is limited. While prospects<br />
for FY 2011 are not exciting given the stiff<br />
competiti<strong>on</strong> (with the share price having resp<strong>on</strong>ded<br />
by de-rating from a peak of XOF 50,000), we<br />
believe the problems are fixable. We would<br />
recommend investors HOLD for the l<strong>on</strong>g term given<br />
the undemanding ratings.<br />
BLOOMBERG: ONTBF:BC<br />
HOLD<br />
Current price (XOF) 45,000<br />
Current price (USD) 93.9<br />
Target price (XOF) 49,409.3<br />
Target price (USD) 103.1<br />
Upside/Downside (%) 10%<br />
Liquidity<br />
Market Cap (XOFm) 153,000<br />
Market Cap (USDm) 319.4<br />
Shares (m) 3.4<br />
Free float (%) 20.0<br />
Ave. daily vol 131.0<br />
Share price performance<br />
6 M<strong>on</strong>ths (%) 49,000 -8.2%<br />
Relative change (%)* 0.03%<br />
12 M<strong>on</strong>ths (%) 45,000 0.0%<br />
Relative change (%)* -2.4%<br />
*Relative to MSCI Index<br />
Financials (XOFm) - FY 31 Dec 2010 2011F 2012F<br />
Turnover 102,930 93,660 107,709<br />
EBITDA 55,690 51,407 59,118<br />
Profit before tax 19,690 17,306 20,043<br />
Attributable earnings 11,176 11,249 13,028<br />
EPS (XOF) 3,287 3,309 3,832<br />
NAV/share (XOF) 22,151 24,366 26,803<br />
DPS (XOF) 2,625 2,680 3,104<br />
Valuati<strong>on</strong> Ratios 2010 2011F 2012F<br />
<str<strong>on</strong>g>Sub</str<strong>on</strong>g>scribers' 000 2,569.1 3,374.7 3,459.1<br />
PER (X) 13.7 13.6 11.7<br />
PBV (X) 2.0 1.8 1.7<br />
EV/EBITDA (x) 3.2 3.7 3.3<br />
Gross ARPU (USD) 7.0 4.8 5.4<br />
EV/<str<strong>on</strong>g>Sub</str<strong>on</strong>g>scriber (USD) 146.6 118.8 116.9<br />
EBITDA Margin 54.1% 54.9% 54.9%<br />
Earnings Yield 7.3% 7.4% 8.5%<br />
Dividend Yield 5.8% 6.0% 6.9%<br />
Gearing 49.7% 47.1% 44.7%<br />
RoaA 5.1% 4.7% 4.9%<br />
RoaE 16.0% 14.2% 15.0%<br />
Onatel: Price Vs Volume<br />
52,000<br />
50,000<br />
48,000<br />
46,000<br />
44,000<br />
42,000<br />
40,000<br />
04-May-09<br />
04-Jul-09<br />
04-Sep-09<br />
04-Nov-09<br />
04-Jan-10<br />
04-Mar-10<br />
04-May-10<br />
04-Jul-10<br />
04-Sep-10<br />
04-Nov-10<br />
04-Jan-11<br />
04-Mar-11<br />
04-May-11<br />
04-Jul-11<br />
04-Sep-11<br />
10,000<br />
9,000<br />
8,000<br />
7,000<br />
6,000<br />
5,000<br />
4,000<br />
3,000<br />
2,000<br />
1,000<br />
-<br />
STRENGTHS<br />
Str<strong>on</strong>g brand name<br />
Strategic relati<strong>on</strong>ship with Maroc Telecom<br />
ensures support in terms of technical and<br />
financial support<br />
First mover advantages in Burkina Faso<br />
Str<strong>on</strong>g management team<br />
Tightly held scrip limits downside<br />
OPPORTUNITIES<br />
Low mobile penetrati<strong>on</strong> in Burkina Faso<br />
C<strong>on</strong>siderable scope for growth in <str<strong>on</strong>g>high</str<strong>on</strong>g> bandwidth<br />
applicati<strong>on</strong>s as a result of new innovati<strong>on</strong>s<br />
Increase network coverage<br />
Increased ec<strong>on</strong>omic activity<br />
WEAKNESSES<br />
Demand for data services may be<br />
c<strong>on</strong>strained by a lack of corporate<br />
Limited float <strong>on</strong> the BRVM limits exposure<br />
THREATS<br />
Increased competi<strong>on</strong> in Burkina Faso<br />
Ec<strong>on</strong>omic slowdown<br />
Plolitical instability in Franco ph<strong>on</strong>e <str<strong>on</strong>g>Africa</str<strong>on</strong>g><br />
Regulatory threats<br />
Increased interc<strong>on</strong>nnecti<strong>on</strong> costs<br />
Volume Traded-RHS<br />
Price (XOF)-LHS<br />
20
Nature of Operati<strong>on</strong>s<br />
ONATEL SA is a telecoms operator in Burkina Faso. It is a<br />
leader in all its business segments, fixed, mobile and<br />
internet. The mobile business is operated by the<br />
subsidiary Telmob - SA. The main shareholders are Maroc<br />
Telecom (51%) and the State of Burkina Faso (26%). The<br />
company provides switched teleph<strong>on</strong>e service between<br />
fixed points and the telex service <strong>on</strong> these networks,<br />
mobile services and other related value-added services<br />
(VAS).<br />
Shareholder Structure<br />
% Shareholding<br />
Maroc Telecom 51%<br />
Etat Burkinabe' 26%<br />
Societe Financiere Internatinale 3%<br />
Free float 20%<br />
Source: IAS<br />
Market Dynamics in Burkina Faso<br />
The telecoms market in Burkina Faso is divided into<br />
several sectors, namely fixed, mobile and internet. The<br />
fixed teleph<strong>on</strong>y sector was fully liberalised in December<br />
2005, marking the end of the ONATEL m<strong>on</strong>opoly.<br />
ONATEL however, is the <strong>on</strong>ly operator that offers fixed<br />
telecommunicati<strong>on</strong> services in the country.<br />
ONATEL’s internet business, marketed under the brand<br />
Fas<strong>on</strong>et, occupies a dominant positi<strong>on</strong> in this segment.<br />
The market for mobile teleph<strong>on</strong>y was opened to<br />
competiti<strong>on</strong> in 2000 when the Burkina Faso government<br />
granted two licenses to Telecel and Celtel Burkina Faso.<br />
Since 2004, the business of Onatel Mobile was<br />
transferred to its 100% subsidiary, Telmob. Currently,<br />
three operators share the mobile teleph<strong>on</strong>y market in<br />
Burkina Faso. These are Telmob, Telecel and Celtel<br />
Burkina Faso. The mobile teleph<strong>on</strong>y market in Burkina<br />
Faso has been growing, with ONATEL having increased its<br />
client base by 44.0% <strong>on</strong> the year to approx 2.8m<br />
subscribers.<br />
Overview of H1 2011 Financial Performance<br />
ONATEL’s H1 2011 bottom-line performance was<br />
disappointing. Net profit came in significantly below our<br />
expectati<strong>on</strong>s, due to price reducti<strong>on</strong>s that were<br />
precipitated by intensifying competiti<strong>on</strong> in the key home<br />
market. ONATEL’s c<strong>on</strong>solidated revenues amounted to<br />
XOF 46.8bn, representing an 11% decrease <strong>on</strong> H1 2010.<br />
The decline was largely a result of significant price<br />
reducti<strong>on</strong>s in the mobile segment. The fixed segment<br />
also underperformed <strong>on</strong> the back of mobile competiti<strong>on</strong><br />
and vandalism of installati<strong>on</strong>s.<br />
Fig 27:<str<strong>on</strong>g>Sub</str<strong>on</strong>g>scriber Growth<br />
3,000,000<br />
52.7%<br />
2,500,000<br />
2,000,000<br />
1,500,000<br />
24.3%<br />
1,000,000<br />
500,000<br />
-5.6%<br />
-<br />
Parc Mobile Parc Internet Parc Fixed<br />
Source: IAS/Company <str<strong>on</strong>g>Report</str<strong>on</strong>g>s 2009-LHS 2010-LHS Growth-RHS<br />
60.0%<br />
50.0%<br />
40.0%<br />
30.0%<br />
20.0%<br />
10.0%<br />
0.0%<br />
-10.0%<br />
Q1 2011 financial performance was dire. It is worth<br />
noting that ONATEL had reported a 77.21% fall in net<br />
profit for Q1 2011 <strong>on</strong> the back of lower tariffs charged<br />
to clients compared with the same period last year.<br />
Sales were also 8.2% lower at XOF 24.0bn. The company<br />
has had to cut fixed line charges due to stiffer<br />
competiti<strong>on</strong> from the mobile sector.<br />
Margins under pressure. H1 2011 EBIT c<strong>on</strong>tracted 71%<br />
to settle at XOF 4.4bn <strong>on</strong> the joint effect of lower<br />
revenues and <str<strong>on</strong>g>high</str<strong>on</strong>g>er interc<strong>on</strong>necti<strong>on</strong> costs to other<br />
carriers. The EBIT margin declined to 9.5% from 29% in<br />
H1 2010. Furthermore, net income for the period stood<br />
at XOF 2.6bn, a 67% decline, implying a net margin of<br />
5.6% (compared with a margin of 14.9% in H1 2010).<br />
Operati<strong>on</strong>al Data H1 2010 H1 2011 % ∆<br />
<str<strong>on</strong>g>Sub</str<strong>on</strong>g>scribers (000)<br />
Fixed 154.0 142.6 -7.4%<br />
Internet 24.6 29.4 19.5%<br />
Active Mobile Park 1,993.9 2,795.5 40.2%<br />
Income Statement (XOFm) H1 2010 H1 2011 % Δ<br />
Revenue 52,605 46,830 -11%<br />
EBIT 15,226 4,445 -71%<br />
Net finance costs (1,340) (1,024) -24%<br />
Profit after tax 7,819 2,609 -67%<br />
EBIT Margin 28.9% 9.5%<br />
Earnings Margin 14.9% 5.6%<br />
21
Operati<strong>on</strong>al Review<br />
Operati<strong>on</strong>al numbers showing improvements. Total<br />
subscribers grew 40% ahead of H1 2010, reaching 2.8m<br />
active customers in H1 2011. The fixed segment, however<br />
registered a downward trend, losing 6.3% compared to H1<br />
2010. As expected, the internet segment registered a<br />
19.5% growth in subscripti<strong>on</strong>s, with approximately 29,000<br />
customers at the end of June 2011. Estimates from<br />
Trading Ec<strong>on</strong>omics show that there is 1 internet user for<br />
every 100 people in Burkina Faso and that literacy levels<br />
are at 47%.<br />
Fixed segment suffering from vandalism. Another set<br />
back for the company has been an increase in acts of<br />
violence and vandalism <strong>on</strong> the teleph<strong>on</strong>e network. This has<br />
led to interrupti<strong>on</strong>s of services thereby causing customers’<br />
disc<strong>on</strong>tent. In the future, Onatel SA will have to<br />
c<strong>on</strong>solidate its achievements and safeguard its quality of<br />
services so as to maintain a leading positi<strong>on</strong> <strong>on</strong> the<br />
market.<br />
Outlook<br />
Plans earmarked at growing network coverage. ONATEL<br />
is looking to extend its mobile coverage to the remaining<br />
cities in the country as well as relieve c<strong>on</strong>gesti<strong>on</strong> in large<br />
urban areas by offering better network quality.<br />
Moving into rural areas. ONATEL is looking at targeting<br />
lower value subscribers outside the main urban areas.<br />
However, the main set back is that this move tends to<br />
dilute ARPUs as the operator focuses <strong>on</strong> low ARPU<br />
customers.<br />
Defending ARPU levels. Management has set a target of<br />
improving ARPUs through innovative offers and<br />
promoti<strong>on</strong>s. New products will also help to cushi<strong>on</strong> against<br />
the adverse effects of price competiti<strong>on</strong>.<br />
The internet growth trajectory to c<strong>on</strong>tinue. Plans have<br />
also been put in place to extend internet access through<br />
ADSL and BLR networks, which are c<strong>on</strong>sistent with the<br />
evoluti<strong>on</strong> of the internet market. The target is to add<br />
8,300 new fixed subscribers, 12,000 new internet<br />
subscribers and 785,307 new mobile customers.<br />
Fig 29: Revenue C<strong>on</strong>tributi<strong>on</strong><br />
Fixed, 33.9%<br />
Source: IAS/Company <str<strong>on</strong>g>Report</str<strong>on</strong>g>s<br />
Fig 30: Net Profit C<strong>on</strong>tributi<strong>on</strong><br />
Fixed &<br />
Internet, 17.2%<br />
Fussi<strong>on</strong>ne, 30.2%<br />
Source: IAS/Company <str<strong>on</strong>g>Report</str<strong>on</strong>g>s<br />
Internet, 3.9%<br />
Mobile, 60.6%<br />
Mobile, 52.5%<br />
Bullish revenue target for FY 2011. Management has set<br />
an objective to achieve a turnover of more than XOF<br />
130.0bn for FY 2011, split into XOF 46.0bn for fixed<br />
internet and XOF 84.7bn for mobile.<br />
Valuati<strong>on</strong> and Recommendati<strong>on</strong><br />
Valuati<strong>on</strong> looks good. On an EV/EBITDA basis, ONATEL<br />
lags its peers, with an EV/EBITDA of <strong>on</strong>ly 3.3x, significantly<br />
lower than the SSA and MENA averages of 4.6x and 5.3x,<br />
respectively. We believe ONATEL’s point of strength in<br />
terms of valuati<strong>on</strong> is that it is tightly held and downside<br />
risk in limited. However, prospects for FY 2012 are not<br />
exciting given the stiff competiti<strong>on</strong>. We would recommend<br />
investors hold for the l<strong>on</strong>g term given the undemanding<br />
EV/<str<strong>on</strong>g>Sub</str<strong>on</strong>g> of USD 147 (SSA average of USD 214/<str<strong>on</strong>g>Sub</str<strong>on</strong>g>), PBV of<br />
2.0x (SSA average of 3.5x). Our valuati<strong>on</strong> methods point to<br />
a 10% potential upside. HOLD<br />
Fig 31: Onatel Financial Analysis<br />
120,000<br />
100,000<br />
80,000<br />
60,000<br />
40,000<br />
20,000<br />
-<br />
2009 2010 2011F 2012F<br />
Sales (XOFm)-LHS EBITDA (XOFm)-LHS PAT (XOFm)-LHS<br />
EBITDA Growth -RHS<br />
Earnings Growth-RHS<br />
Source: IAS/Company <str<strong>on</strong>g>Report</str<strong>on</strong>g>s<br />
160.0%<br />
140.0%<br />
120.0%<br />
100.0%<br />
80.0%<br />
60.0%<br />
40.0%<br />
20.0%<br />
0.0%<br />
-20.0%<br />
22
ONATEL - 5 YEAR CGR COMPARISON<br />
31 DEC (XOFm) 2005 2006 2007 2008 2009 2010 2011F 2012F 5yr CAGR<br />
Balance Sheet<br />
Shareholders' equity 60,340 27,373 33,016 74,280 64,718 75,313 82,844 91,129 25%<br />
Minority interests - 26,299 31,721 130 - 137 143 150 -65%<br />
Total shareholders' equity 60,340 53,672 64,737 74,410 64,718 75,450 82,988 91,279 9%<br />
Current Liabilities 44,669 42,418 61,410 67,350 85,126 103,132 46,247 48,560 2%<br />
Total Liabilities and equity 152,643 147,321 178,590 201,340 205,402 229,182 254,206 282,244 12%<br />
Fixed Assets 108,760 104,780 126,825 136,930 132,353 150,244 165,268 181,795 10%<br />
Current Assets 36,785 36,436 39,792 52,670 61,312 68,850 78,489 89,477 17%<br />
Total Assets 152,643 147,321 178,590 201,340 205,402 229,045 254,206 282,244 12%<br />
Income Statement<br />
Sales 67,358 71,922 78,024 82,350 95,725 102,930 93,660 107,709 5%<br />
Value added 42,332 35,563 41,286 45,419 53,496 57,902 52,450 60,317 8%<br />
Staff costs (9,710) (11,128) (10,436) (11,565) (11,831) (12,103) (12,381) (12,666) 2%<br />
EBITDA 34,803 27,480 33,737 35,715 51,695 55,690 51,407 59,118 13%<br />
Finance income 165 880 289 140 154 169 186 205 -27%<br />
Finance expenses (2,651) (4,548) (3,101) (3,429) (3,200) (2,378) (3,567) (3,995) -5%<br />
Profit before Tax 14,554 1,414 7,314 8,589 15,203 19,690 17,306 20,043 65%<br />
Taxati<strong>on</strong> (3,994) (173) (349) (229) (4,290) (8,514) (6,057) (7,015) 104%<br />
Profit after Tax 10,803 1,334 6,629 8,890 10,913 11,176 11,249 13,028 53%<br />
Attributable Income 10,803 1,334 6,629 8,890 10,913 11,176 11,249 13,028 53%<br />
Ratios<br />
Weighted shares (m) 3.4 3.4 3.4 3.4 3.4 3.4 3.4 3.4<br />
EPS (XOF) 3,177 151 994 1,334 3,210 3,287 3,309 3,832<br />
DPS (XOF) 1,906 90 597 800 1,926 2,625 2,680 3,104<br />
NAV/Share 17,747 8,051 9,711 21,847 19,035 22,151 24,366 26,803<br />
Dividend Cover 1.67 1.67 1.67 1.67 1.67 1.25 1.23 1.23<br />
Dividend Yield 4.2% 0.2% 1.3% 1.8% 4.3% 5.8% 6.0% 6.9%<br />
Growth Ratios<br />
Sales growth (%) 6.8% 8.5% 5.5% 16.2% 7.5% -9.0% 15.0%<br />
EBITDA growth (%) -21.0% 22.8% 5.9% 44.7% 7.7% -7.7% 15.0%<br />
Op Profit growth (%) -68.6% 87.0% 15.2% 102.9% 1.6% -5.0% 15.0%<br />
PBT growth (%) -90.3% 417.3% 17.4% 77.0% 29.5% -12.1% 15.8%<br />
Earnings growth (%) -95.3% 560.4% 34.1% 140.7% 2.4% 0.7% 15.8%<br />
Margins<br />
EBITDA Margin 51.7% 38.2% 43.2% 43.4% 54.0% 54.1% 54.9% 54.9%<br />
OP Margin 24.1% 7.1% 12.2% 13.4% 23.3% 22.0% 23.0% 23.0%<br />
PBT Margin 21.6% 2.0% 9.4% 10.4% 15.9% 19.1% 18.5% 18.6%<br />
Earnings Margin 16.0% 0.7% 4.3% 5.5% 11.4% 10.9% 12.0% 12.1%<br />
Effective Tax Rate 27.4% 12.2% 4.8% 2.7% 28.2% 43.2% 35.0% 35.0%<br />
23
EQUITY RESEARCH<br />
KENYA<br />
September 2011<br />
TELECOMS<br />
SAFARICOM<br />
Voice still bringing home the bac<strong>on</strong>...<br />
<str<strong>on</strong>g>Report</str<strong>on</strong>g>s out of East <str<strong>on</strong>g>Africa</str<strong>on</strong>g> indicate that the Lower<br />
Indian Ocean Network 2 (LION2) submarine cable has<br />
docked in Mombasa, and is set to be c<strong>on</strong>nected to its<br />
sister cable, LION, in internati<strong>on</strong>al waters ahead of<br />
testing. Safaricom has invested heavily in data which is<br />
viewed as the next fr<strong>on</strong>tier of growth for the industry,<br />
and already dominates the market with a 92% market<br />
share. As the most liquid and the largest capitalised<br />
counter <strong>on</strong> the NSE, the stock provides an avenue into<br />
tapping the data growth story in East <str<strong>on</strong>g>Africa</str<strong>on</strong>g>.<br />
• Regulatory inefficiencies. Safaricom has taken<br />
telecoms regulator the CCK to court in an effort<br />
to reclaim KES 1.4bn (USD 14.9m) in excess<br />
licence fees from the telecoms watchdog. In June<br />
2010, the CCK slashed the cost of a 3G permit by<br />
60% from USD 25.0m to USD 10.0m in a bid to<br />
stimulate interest, and later the same m<strong>on</strong>th<br />
Airtel Kenya paid the lower amount for a<br />
c<strong>on</strong>cessi<strong>on</strong>, with Telkom Kenya (Orange) going <strong>on</strong><br />
to acquire a cut-price c<strong>on</strong>cessi<strong>on</strong> in November<br />
2010. Following the price cut, Safaricom is<br />
seeking a rebate from the CCK as it believes that<br />
the huge disparity between the licence fees has<br />
created unfair competiti<strong>on</strong> in the sector, forcing<br />
it to operate at significantly <str<strong>on</strong>g>high</str<strong>on</strong>g>er initial costs<br />
than its rivals.<br />
• Threats of competiti<strong>on</strong> remain elevated but<br />
stock is fundamentally undervalued.<br />
Safaricom’s PER (historic) of 9.4x is at a premium<br />
to S<strong>on</strong>atel’s 7.6x PER and Ec<strong>on</strong>et’s 4.8x, but<br />
below the SSA average of 12.6x. In additi<strong>on</strong>, an<br />
EV/EBITDA of 3.9x and EV/<str<strong>on</strong>g>Sub</str<strong>on</strong>g> of USD 85 lags<br />
behind SSA, MENA, emerging market and<br />
developed world averages. While the company is<br />
likely to benefit from margin expansi<strong>on</strong> <strong>on</strong> data<br />
and n<strong>on</strong> voice income streams, competiti<strong>on</strong> and<br />
regulatory threats remain elevated in the market.<br />
HOLD.<br />
BLOOMBERG: SAFCOM:KN<br />
HOLD<br />
Current price (KES) 3.2<br />
Current price (USD) 0.03<br />
Target price (KES) 3.5<br />
Target price (USD) 0.04<br />
Upside/Downside (%) 9%<br />
Liquidity<br />
Market Cap (KESm) 128,000<br />
Market Cap (USDm) 1,351.6<br />
Shares (m) 40,000<br />
Free float (%) 25<br />
Ave. daily vol ('000) 11,680<br />
Share price performance<br />
6 M<strong>on</strong>ths (%) 3.85 -17%<br />
Relative change (%)* -9%<br />
12 M<strong>on</strong>ths (%) 4.95 -35%<br />
Relative change (%)* -38%<br />
*Relative to MSCI Index<br />
Financials (KESm) - FY 31 Mar 2011 2012F 2013F<br />
Turnover 94,832 102,419 111,636<br />
EBITDA 35,723 35,847 37,956<br />
Profit before tax 18,361 20,484 23,444<br />
Profit after tax 13,159 14,748 16,879<br />
EPS (KES) 0.33 0.37 0.42<br />
NAV/share (KES) 1.69 1.77 1.86<br />
DPS (KES) 0.20 0.30 0.35<br />
Valuati<strong>on</strong> Ratios 2011 2012F 2013F<br />
<str<strong>on</strong>g>Sub</str<strong>on</strong>g>scribers' 000 17,183 18,000 18,200<br />
PER (x) 9.7 8.7 7.6<br />
PBV (x) 1.9 1.8 1.7<br />
EV/EBITDA (x) 3.9 3.9 3.8<br />
Gross ARPU (USD) 4.9 5.0 5.4<br />
EV/<str<strong>on</strong>g>Sub</str<strong>on</strong>g>scriber (USD) 84.7 82.6 82.9<br />
EBITDA Margin 38% 35% 34%<br />
Earnings Yield 10% 12% 13%<br />
Dividend Yield 6% 9% 11%<br />
Gearing 22% 26% 28%<br />
RoaA 12% 13% 14%<br />
RoaE 20% 21% 23%<br />
Safaricom: Price Vs Volume<br />
9<br />
8<br />
7<br />
6<br />
5<br />
450,000,000<br />
400,000,000<br />
350,000,000<br />
300,000,000<br />
250,000,000<br />
STRENGTHS<br />
Str<strong>on</strong>g brand name in East <str<strong>on</strong>g>Africa</str<strong>on</strong>g><br />
Strategic and technical support from Vodaf<strong>on</strong>e<br />
Good management team<br />
Strategic partners in various sectors such as<br />
financial services, educati<strong>on</strong> & health<br />
WEAKNESSES<br />
Demand for data services may be<br />
c<strong>on</strong>strained by a lack of corporate demand<br />
Declining voice and SMS ARPUs<br />
4<br />
200,000,000<br />
3<br />
2<br />
1<br />
0<br />
09-Jun-08<br />
09-Aug-08<br />
09-Oct-08<br />
09-Dec-08<br />
09-Feb-09<br />
09-Apr-09<br />
09-Jun-09<br />
09-Aug-09<br />
09-Oct-09<br />
09-Dec-09<br />
Volume Traded-RHS<br />
09-Feb-10<br />
09-Apr-10<br />
09-Jun-10<br />
09-Aug-10<br />
09-Oct-10<br />
09-Dec-10<br />
09-Feb-11<br />
Price (KES)-LHS<br />
09-Apr-11<br />
09-Jun-11<br />
09-Aug-11<br />
150,000,000<br />
100,000,000<br />
50,000,000<br />
-<br />
OPPORTUNITIES<br />
M-PESA to drive revenue growth in future<br />
C<strong>on</strong>siderable scope for growth in VAS<br />
High bandwidth applicati<strong>on</strong> due to the<br />
launch of undersea cables<br />
Increased 3G coverage to increase<br />
internet access<br />
THREATS<br />
Increased competiti<strong>on</strong> in East <str<strong>on</strong>g>Africa</str<strong>on</strong>g> from<br />
the likes of Airtel Kenya<br />
Ec<strong>on</strong>omic slowdown<br />
Inflati<strong>on</strong>ary threats<br />
Strict regulatory envir<strong>on</strong>ment eg CCK<br />
24
Nature of Operati<strong>on</strong>s<br />
Safaricom is a provider of c<strong>on</strong>verged communicati<strong>on</strong> soluti<strong>on</strong>s<br />
in Kenya. It provides a broad range of first-class products and<br />
services for teleph<strong>on</strong>y, broadband internet and mobile<br />
transfer services. The company was incorporated in Kenya in<br />
April 1997 as a state owned company by virtue of the 60%<br />
government ownership. The government’s stake was later<br />
reduced to 35% after floating 25% of its stake to the public in<br />
2008. The c<strong>on</strong>trolling interest moved to Vodaf<strong>on</strong>e Kenya<br />
which now holds a 40% stake in the company. Safaricom has<br />
an estimated market share of about 67%. Operating mainly as<br />
a teleph<strong>on</strong>y company, voice accounts for c67% of its top line.<br />
However, the <str<strong>on</strong>g>high</str<strong>on</strong>g>ly successful M-PESA M<strong>on</strong>ey transfer<br />
service, launched in 2007, has attracted 13.5m users and<br />
accounts for c12% of total revenue. Data (fixed and mobile)<br />
represents 5.0% of the firm’s revenue while SMS accounts for<br />
about 8.0%.<br />
Shareholder Structure<br />
% Shareholding<br />
Vodaf<strong>on</strong>e Kenya 40.0%<br />
Permanent Secretary-Treasury 35.0%<br />
Free Float 25.0%<br />
Source: IAS<br />
Fig 32: Market Share Statistics<br />
Essar Telecom<br />
7%<br />
Airtel<br />
15%<br />
Orange<br />
4%<br />
Market Dynamics in Kenya<br />
The Kenyan market has in recent times been characterised by<br />
competiti<strong>on</strong> especially in the voice segment. Generally, the<br />
adopti<strong>on</strong> of a low cost strategy by Airtel Kenya is believed to<br />
have ignited price wars in the voice market. To defend<br />
market share, the other operators were forced to follow suit.<br />
The reducti<strong>on</strong> of interc<strong>on</strong>necti<strong>on</strong> rates (as regulated by CCK)<br />
by the operators also fuelled the competiti<strong>on</strong>.<br />
Source: IAS/CCK Estimates<br />
Safaricom<br />
67%<br />
We opine that Safaricom will maintain its dominant positi<strong>on</strong>,<br />
despite the stiff competiti<strong>on</strong> especially in the tariffs<br />
structure. Its promising prospects in the data market will give<br />
it a str<strong>on</strong>g grip in the market. In additi<strong>on</strong>, value-added<br />
products such as M-PESA will also significantly boost its<br />
revenues.<br />
Overview of FY 2011 Financial Performance<br />
Turnover driven by data growth. In FY 2011, revenue growth<br />
of 12.9% was <str<strong>on</strong>g>high</str<strong>on</strong>g>er than subscriber growth. MOU per<br />
subscriber also increased significantly from 60.6 minutes to<br />
96.0 minutes. It appears that data revenues are providing a<br />
str<strong>on</strong>g cushi<strong>on</strong> against declining voice revenue. Safaricom<br />
registered a 12.9% growth in turnover to KES 94.8bn, <strong>on</strong> the<br />
back of a 57% growth in data.<br />
Voice revenues were <strong>on</strong>ly down a marginal 1.7%. Despite<br />
the declining voice ARPUs, voice remains the biggest revenue<br />
stream with KES 63.5bn generated in FY 2011. This was<br />
largely a result of a 58% increase in minutes of use (MOU) per<br />
customer to 96 minutes. The company has managed to firm up<br />
voice revenues through a c<strong>on</strong>tinued focus <strong>on</strong> the customer,<br />
attractive pricing, easy access through wide distributi<strong>on</strong><br />
channels, promoti<strong>on</strong>al activities aimed at stimulating usage<br />
and spending. In additi<strong>on</strong>, the group has also invested in the<br />
network so as to guarantee quality and reach.<br />
Margins were lower. EBITDA was KES 35.7bn and pretax profit<br />
declined by 12.4% to KES 18.4bn. Similarly, net profit dropped<br />
13% to KES 13.16bn. The EBITDA margin declined from 44% in<br />
FY 2010 to 38%, whilst the PAT margin declined from 18% in<br />
FY 2010 to 13.9% in FY 2011. The increase in operating<br />
expenses was attributed to the intensifying customer<br />
acquisiti<strong>on</strong> initiatives and increase in the cost of licences.<br />
Selling and administrative expenses also grew in line with the<br />
company’s revamped customer focus.<br />
Fig 33: Evoluti<strong>on</strong> of <str<strong>on</strong>g>Sub</str<strong>on</strong>g>scribers (Milli<strong>on</strong>s)<br />
20.0<br />
18.0<br />
16.0<br />
14.0<br />
12.0<br />
10.0<br />
8.0<br />
6.0<br />
4.0<br />
2.0<br />
-<br />
2004 2005 2006 2007 2008 2009 2010 2011 2012 2013<br />
Source: IAS/Company <str<strong>on</strong>g>Report</str<strong>on</strong>g>s<br />
Income Statement (KESbn) FY 2010 FY 2011 % Δ<br />
Revenue 83.961 94.832 12.9%<br />
Voice 64.576 63.501 -1.7%<br />
Total Data 15.724 24.696 57.1%<br />
SMS 5.191 7.544 45.3%<br />
M-PESA 7.556 11.784 56.0%<br />
Data 2.977 5.368 80.3%<br />
EBITDA 36.604 35.723 -2.4%<br />
Operating Profit 22.611 19.390 -14.2%<br />
Profit before tax 20.967 18.361 -12.4%<br />
Profit after tax 15.148 13.159 -13.1%<br />
Customers (m) 15.793 17.183 8.8%<br />
Mobile Service ARPU (KES) 458.5 436.6 -4.8%<br />
EBITDA Margin 43.6% 37.7% -13.6%<br />
PAT Margin 18.0% 13.9% -23.1%<br />
25
Operati<strong>on</strong>al Review<br />
Maintaining its market leadership positi<strong>on</strong>. Safaricom<br />
c<strong>on</strong>tinues to lead the pack <strong>on</strong> the innovati<strong>on</strong> fr<strong>on</strong>t. M-PESA<br />
remains a key achievement by Safaricom and is expected<br />
to c<strong>on</strong>tinue boosting its revenues significantly. The service<br />
is now being applied in other markets and will remain a<br />
key driver to the company’s revenues. Its modificati<strong>on</strong> and<br />
upgrades to enable mobile banking and settlement of<br />
payments c<strong>on</strong>tinues to be a major boost to the company.<br />
Another dem<strong>on</strong>strati<strong>on</strong> of c<strong>on</strong>tinued innovati<strong>on</strong> is the<br />
upgrading of its 3G network. As a l<strong>on</strong>g term project, the<br />
operator is now carrying out trials for the 4G network to<br />
make data delivery even faster.<br />
Fig 34: ARPU Analysis<br />
500<br />
450<br />
400<br />
350<br />
300<br />
250<br />
200<br />
150<br />
100<br />
50<br />
0<br />
MPESA SMS Data Voice Blended ARPU<br />
2010 2011<br />
Source: IAS/Company <str<strong>on</strong>g>Report</str<strong>on</strong>g>s<br />
Safaricom has “distinguished” itself in the market and has<br />
invested in a 3G network (with over 50% of the base<br />
stati<strong>on</strong>s 3G enabled). Currently, it is the <strong>on</strong>ly company<br />
with a countrywide coverage of the technology. The<br />
company has so far c<strong>on</strong>nected 5,000 subscribers via fixed<br />
lines making it <strong>on</strong>e of the biggest providers in the segment.<br />
Calling rates expected to increase. Kenyan mobile<br />
teleph<strong>on</strong>e operators are expected to raise calling rates for<br />
customers <strong>on</strong> the back of a weak KES against the USD and<br />
<str<strong>on</strong>g>high</str<strong>on</strong>g> inflati<strong>on</strong> of about 16%. Generally, call rates have been<br />
falling for a year after India's Bharti Airtel, slashed prices<br />
by more than 50% in a bid to lure subscribers from the<br />
biggest operator, Safaricom. Operators will need to adjust<br />
call rates so as to recover from the shocks. It is worth<br />
noting that Safaricom is the <strong>on</strong>ly telco in Kenya making<br />
profits at the current subdued rates.<br />
Outlook<br />
Bundling to add flavour to a saturated market. We<br />
foresee bundling to be the key stimulus for the Kenyan<br />
market’s growth going forward, given the saturati<strong>on</strong> in the<br />
mobile market and voice competiti<strong>on</strong>. With an EBITDA of<br />
c50% compared to voice’s 38%, the data segment is <str<strong>on</strong>g>high</str<strong>on</strong>g>ly<br />
profitable. Currently, data has a penetrati<strong>on</strong> of 25.1%<br />
compared to that of voice which is over 60%. This is our<br />
view dem<strong>on</strong>strates the massive growth potential within the<br />
data space.<br />
A focus <strong>on</strong> the corporate market. Safaricom’s outlook<br />
remains positive given its aggressive move to data. A focus<br />
<strong>on</strong> the corporate market will also boost data growth. The<br />
development of digital villages such as in Athi River and e-<br />
government initiatives n the country present exciting<br />
growth prospects for Safaricom.<br />
Valuati<strong>on</strong> and Recommendati<strong>on</strong><br />
Still looking cheap. The significant potential in broadband<br />
and the notable opportunity that could arise from VAS and<br />
M-PESA. It worth noting however that Safaricom’s PER<br />
(historic) of 9.7x is at a premium to S<strong>on</strong>atel’s 7.6x PER and<br />
Ec<strong>on</strong>et’s 4.8x, but below the SSA average of 12.6x. In<br />
additi<strong>on</strong>, an EV/EBITDA of 3.9x and EV/<str<strong>on</strong>g>Sub</str<strong>on</strong>g> of USD 85 lags<br />
behind SSA, MENA, emerging market and developed world<br />
averages. However, our view is that competiti<strong>on</strong> and<br />
regulatory threats remain elevated in the market. Our<br />
valuati<strong>on</strong> points to a target price of KES 3.5, implying 9.0%<br />
potential upside. HOLD<br />
Fig 35: Revenue Analysis<br />
100.00<br />
90.00<br />
80.00<br />
24.70<br />
70.00<br />
15.70<br />
60.00<br />
9.10<br />
4.90<br />
50.00<br />
40.00<br />
30.00<br />
64.60<br />
54.60<br />
58.80<br />
63.50<br />
20.00<br />
10.00<br />
0.00<br />
2008 2009 2010 2011<br />
Data/SMS/MPESA-KES (bn)-LHS Voice-KES (bn)-LHS<br />
Sales Growth-RHS<br />
Source: IAS/Company <str<strong>on</strong>g>Report</str<strong>on</strong>g>s<br />
Fig 36: Analysis of Debt Levels<br />
40%<br />
35%<br />
36%<br />
30%<br />
25%<br />
28% 28%<br />
20%<br />
25%<br />
15%<br />
16%<br />
10% 13%<br />
5%<br />
0%<br />
2008 2009 2010 2011 2012F 2013F<br />
Net Debt/EBITDA<br />
Gearing<br />
Source: IAS/Company <str<strong>on</strong>g>Report</str<strong>on</strong>g>s<br />
Fig 37: Safaricom Financial Analysis<br />
120,000<br />
100,000<br />
80,000<br />
60,000<br />
40,000<br />
20,000<br />
-<br />
2009 2010 2011 2012F 2013F<br />
Revenue (KESm)-LHS<br />
EBITDA(KESm)-LHS<br />
Net Income (KESm)-LHS<br />
EBITDA Margin-RHS<br />
Source: IAS/Company <str<strong>on</strong>g>Report</str<strong>on</strong>g>s<br />
Net Margin-RHS<br />
35%<br />
30%<br />
25%<br />
20%<br />
15%<br />
10%<br />
5%<br />
0%<br />
50%<br />
45%<br />
40%<br />
35%<br />
30%<br />
25%<br />
20%<br />
15%<br />
10%<br />
5%<br />
0%<br />
26
SAFARICOM - 5 YEAR CGR COMPARISON<br />
31 MAR (KESm) 2006 2007 2008 2009 2010 2011 2012F 2013F 5yr CAGR<br />
Balance Sheet<br />
Shareholders funds 23,771 32,789 42,643 51,147 62,295 67,454 70,827 74,368 23%<br />
Bank borrowings 5,000 6,200 6,480 4,775 7,610 12,105 13,315 14,913 19%<br />
Shareholders loans 4,235 4,235 - - 395 178 267 401 -47%<br />
Total Liabilities and equity 43,945 56,408 77,085 91,682 70,301 79,737 84,409 89,682 13%<br />
PPE 32,791 42,732 56,480 69,035 73,090 83,023 88,004 93,284 20%<br />
Current Assets 7,534 10,150 12,887 17,402 22,567 21,590 22,920 24,354 23%<br />
Total Assets 43,945 56,408 74,364 91,582 101,065 109,978 116,344 123,114<br />
Income Statement<br />
Total Revenues 34,972 47,447 61,369 70,480 83,961 94,832 102,419 111,636 22%<br />
Cost of Sales (12,916) (18,155) (26,066) (32,788) (36,554) (45,795) (50,185) (53,586) 29%<br />
Gross Profit 22,056 29,292 35,303 37,691 47,406 49,038 52,234 58,051 17%<br />
Other operating income 11 17 5 16 15 36 55 82 28%<br />
Total Operating Expenses (9,280) (11,504) (16,946) (21,516) (24,796) (29,648) (31,079) (32,573) 26%<br />
EBITDA 18,570 24,149 28,041 27,951 36,604 35,723 35,847 37,956 14%<br />
Profit before Tax 12,211 18,384 19,945 15,304 20,967 18,361 20,484 23,444 9%<br />
Taxati<strong>on</strong> (3,785) (5,182) (5,385) (4,767) (5,819) (5,202) (5,735) (6,564) 7%<br />
Profit after Tax 8,425 13,202 14,560 10,537 15,148 13,159 14,748 16,879 9%<br />
Ratios<br />
Weighted shares (m) 40,000 40,000 40,000 40,000 40,000 40,000 40,000 40,000<br />
EPS (KES) 0.21 0.33 0.36 0.26 0.38 0.33 0.37 0.42<br />
DPS (KES) 0.07 0.10 0.05 0.10 0.20 0.20 0.30 0.35<br />
NAV/Share 0.59 0.82 1.07 1.28 1.56 1.69 1.77 1.86<br />
Dividend Cover 2.82 3.30 7.28 2.63 1.89 1.64 1.23 1.21<br />
Dividend Yield 2.3% 3.1% 1.6% 3.1% 6.3% 6.3% 9.4% 10.9%<br />
Growth Ratios<br />
Sales growth (%) 35.7% 29.3% 14.8% 19.1% 12.9% 8.0% 9.0%<br />
EBITDA growth (%) 30.0% 16.1% -0.3% 31.0% -2.4% 0.3% 5.9%<br />
Op Profit growth (%) 39.2% 3.2% -11.9% 39.8% -14.2% 9.1% 20.4%<br />
PBT growth (%) 50.6% 8.5% -23.3% 37.0% -12.4% 11.6% 14.5%<br />
Earnings growth (%) 56.7% 10.3% -27.6% 43.8% -13.1% 12.1% 14.5%<br />
Margins<br />
Gross Margin 63.1% 61.7% 57.5% 53.5% 56.5% 51.7% 51.0% 52.0%<br />
EBITDA margin 53.1% 50.9% 45.7% 39.7% 43.6% 37.7% 35.0% 34.0%<br />
OP margin 36.5% 37.5% 29.9% 23.0% 26.9% 20.4% 20.7% 22.8%<br />
PBT margin 34.9% 38.7% 32.5% 21.7% 25.0% 19.4% 20.0% 21.0%<br />
Earnings Margin 24.1% 27.8% 23.7% 15.0% 18.0% 13.9% 14.4% 15.1%<br />
Effective Tax Rate 31.0% 28.2% 27.0% 31.2% 27.8% 28.3% 28.0% 28.0%<br />
27
EQUITY RESEARCH<br />
BRVM<br />
September 2011<br />
TELECOMS<br />
SONATEL SA<br />
Winds of change dampening prospects…<br />
S<strong>on</strong>atel is now actively looking for acquisiti<strong>on</strong>s in West<br />
<str<strong>on</strong>g>Africa</str<strong>on</strong>g>, meaning that existing mobile operators in West<br />
<str<strong>on</strong>g>Africa</str<strong>on</strong>g> could be a potential target for S<strong>on</strong>atel. In<br />
additi<strong>on</strong>, there appears to be untapped potential in the<br />
company’s core markets of Senegal, Mali and Guinea for<br />
mobile teleph<strong>on</strong>y and internet.<br />
• Regulatory threats looming in the key market.<br />
New regulatory charges in Senegal may affect the<br />
company’s bottom line in FY 2011. The<br />
government’s c<strong>on</strong>troversial tax <strong>on</strong> internati<strong>on</strong>al<br />
incoming calls will likely result in a 10% decline in<br />
FY 2011 revenues. The new tax would also lead to<br />
many more Senegalese living overseas to use<br />
VoIP-based alternatives so as to circumvent<br />
paying the <str<strong>on</strong>g>high</str<strong>on</strong>g>er rates S<strong>on</strong>atel will have to<br />
charge. The proposed tax adds XOF 49.20 (USD<br />
0.10) per minute <strong>on</strong> calls made from outside the<br />
country (up 53% <strong>on</strong> the previous rate) while calls<br />
to fixed numbers impose an extra XOF 75.45 <strong>on</strong><br />
users. Given that internati<strong>on</strong>al calls account for<br />
more than 67% annual turnover, the development<br />
is likely to retard the company’s growth<br />
momentum.<br />
• We expect the counter to be resilient to<br />
downside risks. S<strong>on</strong>atel has indicated that it<br />
c<strong>on</strong>sider raising fees <strong>on</strong> overseas calls to offset<br />
the impact of the new tax structure. Our BUY<br />
recommendati<strong>on</strong> is endorsed by the relative<br />
resilience of the sector in general, the healthy<br />
dividend yield of 11.5%, and the operator’s<br />
diversified revenue streams (across various<br />
geographies) underpinned further by VAS as a<br />
new revenue stream and the significant bundling<br />
opportunity that could arise in the regi<strong>on</strong>.<br />
BLOOMBERG: SNTS:BC<br />
BUY<br />
Current price (XOF) 122,000<br />
Current price (USD) 254.7<br />
Target price (XOF) 150,901.1<br />
Target price (USD) 315.0<br />
Upside/Downside (%) 24%<br />
Liquidity<br />
Market Cap (XOFm) 1,220,000<br />
Market Cap (USDm) 2,546.7<br />
Shares (m) 10<br />
Free float (%) 20<br />
Ave. daily vol 837<br />
Share price performance<br />
6 M<strong>on</strong>ths (%) 165,000 -26%<br />
Relative change (%)* -18%<br />
12 M<strong>on</strong>ths (%) 133,000 -8%<br />
Relative change (%)* -11%<br />
*Relative to MSCI Index<br />
Financials (USDm) - FY 31 Dec 2010 2011F 2012F<br />
Turnover 620,157 659,198 710,339<br />
EBITDA 323,520 336,191 361,098<br />
Profit before tax 220,178 230,645 257,568<br />
Attributable earnings 159,631 158,684 174,992<br />
EPS (XOF) 15,963 15,868 17,499<br />
NAV/share (XOF) 52,450 55,072 57,826<br />
DPS (XOF) 14,000 14,426 15,908<br />
Valuati<strong>on</strong> Ratios 2010 2011F 2012F<br />
<str<strong>on</strong>g>Sub</str<strong>on</strong>g>scribers' 000 11,280 12,800 13,500<br />
PER (x) 7.6 7.7 7.0<br />
PBV (x) 2.3 2.2 2.1<br />
EV/EBITDA (x) 3.7 3.8 3.5<br />
Gross ARPU (USD) 9.6 9.0 9.2<br />
EV/<str<strong>on</strong>g>Sub</str<strong>on</strong>g>scriber (USD) 218.8 208.2 197.8<br />
EBITDA Margin 52.2% 51.0% 50.8%<br />
Earnings Yield 13.1% 13.0% 14.3%<br />
Dividend Yield 11.5% 11.8% 13.0%<br />
Gearing 11.5% 11.8% 13.0%<br />
RoaA 16.8% 15.6% 17.0%<br />
RoaE 31.2% 29.5% 31.0%<br />
S<strong>on</strong>atel :Price Vs Volume<br />
250,000<br />
200,000<br />
150,000<br />
250,000<br />
200,000<br />
150,000<br />
STRENGTHS<br />
Str<strong>on</strong>g brand name<br />
Experiencing growth in subsribber numbers<br />
despite competitive threats<br />
Strategic relati<strong>on</strong>ship with France Telecom<br />
ensures support in terms of technical and<br />
financial support<br />
WEAKNESSES<br />
Demand for data services may be<br />
c<strong>on</strong>strained by a lack of corporate demand<br />
100,000<br />
50,000<br />
-<br />
02-Jan-08<br />
02-Mar-08<br />
02-May-08<br />
02-Jul-08<br />
02-Sep-08<br />
02-Nov-08<br />
02-Jan-09<br />
02-Mar-09<br />
02-May-09<br />
02-Jul-09<br />
02-Sep-09<br />
02-Nov-09<br />
02-Jan-10<br />
02-Mar-10<br />
02-May-10<br />
02-Jul-10<br />
02-Sep-10<br />
02-Nov-10<br />
02-Jan-11<br />
02-Mar-11<br />
02-May-11<br />
02-Jul-11<br />
02-Sep-11<br />
100,000<br />
50,000<br />
-<br />
OPPORTUNITIES<br />
Low mobile penetrati<strong>on</strong> in Mali (52%)<br />
C<strong>on</strong>siderable scope for growth in broadband<br />
as a result of the launch of the ACE Cable<br />
Increased ec<strong>on</strong>omic activity in Franco ph<strong>on</strong>e<br />
West <str<strong>on</strong>g>Africa</str<strong>on</strong>g><br />
THREATS<br />
Competi<strong>on</strong> in key markets ie Senegal and Mali<br />
Regualtor threats ie taxes<br />
Ec<strong>on</strong>omic slow down<br />
Foreign currency shortages<br />
Volume Traded-RHS<br />
Price (XOF)-LHS<br />
28
Nature of Operati<strong>on</strong>s<br />
S<strong>on</strong>atel, which is 42.0% owned by France Telecom (<strong>on</strong>e of<br />
the largest operators worldwide) is the dominant telecom<br />
firm in Senegal and Mali, and is the largest company by<br />
value <strong>on</strong> the BRVM. Operating in four countries with a<br />
populati<strong>on</strong> of 40.0m inhabitants, the company offers<br />
fixed, mobile, internet and TV services, serving<br />
approximately 12.8m subscribers. The company is also 28%<br />
by the Senegalese government.<br />
France Telecom provides the technical and commercial<br />
support in order to enable the S<strong>on</strong>atel group to remain<br />
the reference operator in the sub regi<strong>on</strong>. Over the years,<br />
the partnership has put an emphasis <strong>on</strong> the improvement<br />
of rural coverage in the best technical ec<strong>on</strong>omical<br />
c<strong>on</strong>diti<strong>on</strong>s, the launch of TV via ADSL and the<br />
implementati<strong>on</strong> of the brand evoluti<strong>on</strong> strategy (Orange).<br />
Shareholder Structure<br />
% Shareholding<br />
France Telecom 42.3%<br />
Government 27.7%<br />
Employee Trust 10.0%<br />
Free float 20.0%<br />
Source: IAS<br />
Fig 38: Disaggregati<strong>on</strong> of Mobile <str<strong>on</strong>g>Sub</str<strong>on</strong>g>scribers<br />
Guinea<br />
8%<br />
Bissau<br />
2%<br />
Market Dynamics<br />
The intense competiti<strong>on</strong> <strong>on</strong> the mobile market in both<br />
Senegal and Mali has, to a large extent been an additi<strong>on</strong>al<br />
stimulant for S<strong>on</strong>atel to implement an efficient<br />
commercial and marketing strategy with permanent<br />
innovati<strong>on</strong>s. In Senegal, <strong>on</strong>e of the competitors is a<br />
Sudanese firm, Sudatel. In Mali, the government is<br />
reportedly inviting bids for a third telecoms licence, as it<br />
is looking to cater for the interests of the c<strong>on</strong>sumers as<br />
well as maximise receipts for the public treasury. At<br />
present, there are just two telecoms operators in Mali,<br />
state-owned Societe des Telecommunicati<strong>on</strong>s du Mali<br />
(SOTELMA), which also c<strong>on</strong>trols the country’s largest<br />
cellco by subscribers Malitel, and Orange Mali. Both<br />
operators currently offer fixed line and mobile voice<br />
services, in additi<strong>on</strong> to broadband via both ADSL and<br />
wireless in the local loop or WiMAX.<br />
Mali<br />
43%<br />
Source: IAS/Company <str<strong>on</strong>g>Report</str<strong>on</strong>g>s<br />
Fig 39: Evoluti<strong>on</strong> of <str<strong>on</strong>g>Sub</str<strong>on</strong>g>scriber Numbers<br />
16,000,000<br />
14,000,000<br />
12,000,000<br />
10,000,000<br />
Senegal<br />
47%<br />
Overview of H1 2011 Financial Performance<br />
Revenue trend positive despite stiff competiti<strong>on</strong>.<br />
Revenues for H1 2011 maintained an upward trend<br />
growing 5.70% to XOF 312.3bn despite fiercer competiti<strong>on</strong><br />
and the unfavourable XOF/Guinean franc exchange rate.<br />
The increase in fiscal charges was the main dampener.<br />
Operati<strong>on</strong>al and fiscal charges increased significantly,<br />
resulting in a drop of 20% in net income. External<br />
services, which represent the largest part of operating<br />
expenses, also recorded an increase of 13.1%.<br />
Furthermore, the “tax break” in Mali came to an end.<br />
EBITDA margins down, but still attractive. EBITDA for H1<br />
2011 declined 2.0% to XOF 163.8bn from XOF 167.5bn in<br />
H1 2010. C<strong>on</strong>sequently, the EBITDA margin declined by<br />
426 basis points to 52.4%. A key note however is that the<br />
group has maintained a satisfying level of profitability<br />
with EBITDA margins above 50%.<br />
According to management, S<strong>on</strong>atel plans to keep its<br />
EBITDA margin above 50% during FY 2012, and keep its<br />
dividend payment to shareholders at current levels, at the<br />
very least. Overall, S<strong>on</strong>atel's net profit totalled XOF<br />
75.4bn (USD 161.0m) for H1 2011.<br />
8,000,000<br />
6,000,000<br />
4,000,000<br />
2,000,000<br />
0<br />
Source: IAS/Company <str<strong>on</strong>g>Report</str<strong>on</strong>g>s<br />
2008 2009 2010 2011F 2012F<br />
Internet Mobile Fixed Line<br />
Operati<strong>on</strong>al Data H1 2010 H1 2011 % ∆<br />
<str<strong>on</strong>g>Sub</str<strong>on</strong>g>scribers<br />
Mobile 9,795,715 12,843,724 31.1%<br />
Fixed 269,436 288,479 7.1%<br />
Internet 72,508 105,337 45.3%<br />
Income Statement (XOFm) H1 2010 H1 2011 % Δ<br />
Revenue 295,416 312,254 6%<br />
EBITDA 167,540 163,774 -2%<br />
EBIT 115,815 114,450 -1%<br />
Profit after tax 94,452 75,358 -20%<br />
Capex 30,000 37,000 23%<br />
EBITDA Margin 56.7% 52.4%<br />
Earnings Margin 32.0% 24.1%<br />
29
Operati<strong>on</strong>al Review<br />
Str<strong>on</strong>g growth in subscriber numbers. Operati<strong>on</strong>al<br />
figures were positive as mobile subscripti<strong>on</strong>s grew 31%<br />
compared to H1 2010, reaching 12.8m active customers at<br />
the end of H1 2011, mainly due to multi-equipment<br />
development and larger offerings of prepaid plans. The<br />
internet segment saw the greatest expansi<strong>on</strong> with a 45.3%<br />
growth in subscripti<strong>on</strong>s. Fixed subscribers grew at a single<br />
digit growth rate of 7.1% to 288,479 subscribers.<br />
Data revenue growth disappointing. The group c<strong>on</strong>tinues<br />
to lag behind its peers such as Safaricom in terms of<br />
growth in the data segment. Data subscribers <strong>on</strong>ly<br />
represent 2.3% of the total subscriber base versus 20% for<br />
Safaricom. In 2010, S<strong>on</strong>atel launched a mobile m<strong>on</strong>ey<br />
payment business and registered about 295,000 as of<br />
December 2010. S<strong>on</strong>atel was also awarded a 3G licence in<br />
Mali and Senegal. The operator has since started<br />
deploying 3G infrastructure in the two countries.<br />
Capex <strong>on</strong> the increase. S<strong>on</strong>atel expects to increase its<br />
capex by at least 10% in FY 2011. The company plans to<br />
spend at least XOF 100.0bn (USD 211.0m) in FY 2011,<br />
compared with XOF 90.0bn in FY 2010. This will go<br />
towards reinforcing the company's voice and data<br />
capacity and expanding coverage in Mali and Guinea.<br />
Outlook<br />
ACE submarine cable expected to boost growth<br />
prospects in the l<strong>on</strong>g term. The submarine cable ACE<br />
(<str<strong>on</strong>g>Africa</str<strong>on</strong>g> Coast to Europe) will allow the greatest number of<br />
countries in Franco-ph<strong>on</strong>e West <str<strong>on</strong>g>Africa</str<strong>on</strong>g> to access the<br />
network <str<strong>on</strong>g>high</str<strong>on</strong>g>-speed world. This new optic cable fibre,<br />
with a length 17,000km in its current c<strong>on</strong>figurati<strong>on</strong>, will<br />
be put into service in the H1 2012. It will serve 23<br />
countries, either by direct access to countries al<strong>on</strong>g the<br />
coast or through a c<strong>on</strong>nected country for countries with<br />
no access to the sea.<br />
The cable c<strong>on</strong>structi<strong>on</strong> represents an investment of about<br />
USD 690.0m for the c<strong>on</strong>sortium, of which about USD<br />
180.0m should be supported by the various subsidiaries.<br />
Given its relati<strong>on</strong>ship with France Telecom, S<strong>on</strong>atel is<br />
positi<strong>on</strong>ed to reap the rewards of the mega investment.<br />
Competiti<strong>on</strong> to remain a comm<strong>on</strong> phenomen<strong>on</strong> across<br />
all market. S<strong>on</strong>atel’s markets are still characterised by<br />
increased competiti<strong>on</strong>. Despite efforts by the group to<br />
maintain a relatively str<strong>on</strong>g positi<strong>on</strong> its key markets. In<br />
Senegal, there is increased competiti<strong>on</strong> from operators<br />
such as Millicom whereas in Mali, the company competes<br />
with Maroc Telecom’s Malitel. The group’s strategy is<br />
hinged <strong>on</strong> c<strong>on</strong>tinuing its policy focused <strong>on</strong> providing a <str<strong>on</strong>g>high</str<strong>on</strong>g><br />
quality technical service and commercial so as to remain<br />
competitive.<br />
Valuati<strong>on</strong> and Recommendati<strong>on</strong><br />
S<strong>on</strong>atel trades currently at a discount to SSA and MENA<br />
peers, having a PER (T+1) of 7.7x, significantly lower than<br />
the SSA average of 10.7x, Our valuati<strong>on</strong> points to at<br />
target price of XOF 150,901, implying 24% potential<br />
upside. BUY<br />
Fig 40: C<strong>on</strong>tributi<strong>on</strong> of Entities<br />
100%<br />
1.0% 0.6%<br />
4.8% 3.4% 3.0% 2.9%<br />
80% 29.6% 35.1%<br />
39.7% 47.8%<br />
60%<br />
40%<br />
64.6% 61.0% 57.5% 49.7%<br />
20%<br />
0%<br />
-4.0%<br />
Revenue EBITDA Operating Profit Net Profit<br />
-20%<br />
-3.0%<br />
Bissau Guinea Mali Senegal<br />
Source: IAS/Company <str<strong>on</strong>g>Report</str<strong>on</strong>g>s<br />
Fig 41: S<strong>on</strong>atel Market Share Statistics<br />
80%<br />
70%<br />
73%<br />
60%<br />
63%<br />
50%<br />
40%<br />
30%<br />
20%<br />
27%<br />
24%<br />
10%<br />
0%<br />
Senegal Mali Guinea Bissau<br />
Market Share<br />
Penetrati<strong>on</strong> Rate<br />
Source: IAS/Company <str<strong>on</strong>g>Report</str<strong>on</strong>g>s<br />
Fig 42: S<strong>on</strong>atel Financial Analysis<br />
800,000<br />
700,000<br />
600,000<br />
500,000<br />
400,000<br />
300,000<br />
200,000<br />
100,000<br />
0<br />
2008 2009 2010 2011F 2012F<br />
Revenue (XOFm)-LHS<br />
EBITDA (XOFm)-LHS<br />
Net Profit (XOFm)-LHS<br />
Net Margin-RHS<br />
Source: IAS/Company <str<strong>on</strong>g>Report</str<strong>on</strong>g>s<br />
EBITDA margin-RHS<br />
70%<br />
60%<br />
50%<br />
40%<br />
30%<br />
20%<br />
10%<br />
0%<br />
60.0%<br />
50.0%<br />
40.0%<br />
30.0%<br />
20.0%<br />
10.0%<br />
0.0%<br />
30
SONATEL - 5 YEAR CGR COMPARISON<br />
31 DEC (XOFm) 2005 2006 2007 2008 2009 2010 2011F 2012F 5yr CAGR<br />
Balance Sheet<br />
Shareholders' equity 325,788 386,714 438,937 465,422 499,955 524,495 550,720 578,256 10.0%<br />
Minority interests 21,464 32,620 47,632 42,510 56,930 66,919.00 67,588.19 68,264.07 25.5%<br />
Total shareholders' equity 347,252 419,334 486,569 507,932 556,885 591,414 618,308 646,520 11.2%<br />
Current Liabilities 153,506 166,384 197,951 235,332 223,175 288,382 294,150 300,033 13.4%<br />
Total Liabilities and equity 565,849 655,308 743,175 831,839 884,103 1,014,224 1,024,366 1,034,610 12.4%<br />
Fixed Assets 278,245 333,086 399,673 432,169 440,439 458,350 481,268 505,331 10.5%<br />
Current Assets 287,604 322,222 343,502 399,670 443,664 555,874 543,099 529,279 14.1%<br />
Total Assets 565,849 655,308 743,175 831,839 884,103 1,014,224 1,024,366 1,034,610 12.4%<br />
Income Statement<br />
Sales 336,100 409,299 504,668 546,653 593,754 620,157 659,198 710,339 13.0%<br />
Value added 230,418 281,847 322,494 343,593 376,623 382,750 402,111 449,890 10.7%<br />
Staff costs 37,167 38,227 45,639 50,496 57,058 59,230 65,920 88,792 9.8%<br />
EBITDA 193,251 243,620 276,855 293,097 319,565 323,520 336,191 361,098 10.9%<br />
Finance income 3,892 3,511 5,192 10,549 9,487 13,501 14,446 15,457 28.2%<br />
Finance expenses (2,724) (5,476) (10,096) (7,479) (8,535) (10,656) (17,569) (18,271) 31.4%<br />
Profit before Tax 147,346 182,107 197,308 193,036 224,728 220,178 230,645 257,568 8.4%<br />
Taxati<strong>on</strong> (31,882) (36,796) (36,728) (34,043) (41,375) (35,898) (46,129) (54,089) 2.4%<br />
Profit after Tax 116,396 146,617 161,205 156,825 185,028 184,760 184,516 203,479 9.7%<br />
Attributable Income 105,548 130,628 140,967 136,578 163,603 159,631 158,684 174,992 8.6%<br />
Ratios<br />
Weighted shares (m) 10 10 10 10 10 10 10 10<br />
EPS (XOF) 10,555 13,063 14,097 13,658 16,360 15,963 15,868 17,499<br />
DPS (XOF) 6,210 7,947 9,900 13,000 13,500 14,000 14,426 15,908<br />
NAV/Share 32,579 38,671 43,894 46,542 49,996 52,450 55,072 57,826<br />
Dividend Cover 1.70 1.64 1.42 1.05 1.21 1.14 1.10 1.10<br />
Dividend Yield 5.1% 6.5% 8.1% 10.7% 11.1% 11.5% 11.8% 13.0%<br />
Growth Ratios<br />
Sales growth (%) 21.8% 23.3% 8.3% 8.6% 4.4% 6.3% 7.8%<br />
EBITDA growth (%) 26.1% 13.6% 5.9% 9.0% 1.2% 3.9% 7.4%<br />
Op Profit growth (%) 29.1% 9.9% -4.8% 15.3% 1.9% 4.9% 10.0%<br />
PBT growth (%) 23.6% 8.3% -2.2% 16.4% -2.0% 4.8% 11.7%<br />
Earnings growth (%) 23.8% 7.9% -3.1% 19.8% -2.4% -0.6% 10.3%<br />
Margins<br />
EBITDA margin 57.5% 59.5% 54.9% 53.6% 53.8% 52.2% 51.0% 50.8%<br />
OP margin 42.7% 45.3% 40.4% 35.5% 37.7% 36.8% 36.3% 37.0%<br />
PBT margin 43.8% 44.5% 39.1% 35.3% 37.8% 35.5% 35.0% 36.3%<br />
Earnings Margin 31.4% 31.9% 27.9% 25.0% 27.6% 25.7% 24.1% 24.6%<br />
Effective Tax Rate 22.3% 20.9% 18.9% 16.5% 19.2% 16.5% 20.0% 21.0%<br />
31
EQUITY RESEARCH<br />
MALAWI<br />
September 2011<br />
TELECOMS<br />
Telekom Networks Malawi (TNM)<br />
Smart growth over the years…<br />
While Telekom Networks Malawi (TNM) has indicated<br />
that it is currently in talks with a potential strategic<br />
equity partner, indicati<strong>on</strong>s are that it could be <strong>on</strong> the<br />
table with Vodacom Group. The telco is currently<br />
owned by Malawi Telecommunicati<strong>on</strong>s Limited (MTL,<br />
44.44%), First Merchant Bank (12.92%), local<br />
c<strong>on</strong>glomerate Press Corporati<strong>on</strong> Limited (10.46%), Old<br />
Mutual (10.46%) and employees (1%), with 20.7% of<br />
shares in free float. At the end of June 2011, TNM had<br />
more than 1.2m subscribers, claiming a 36.8% share of<br />
the country’s mobile market.<br />
• Strategically positi<strong>on</strong>ed. It would appear that<br />
TNM is geared to be a competitive force in the<br />
mobile telecommunicati<strong>on</strong>s sector. We have seen<br />
milest<strong>on</strong>e achievements such as the c<strong>on</strong>structi<strong>on</strong><br />
of new base stati<strong>on</strong>s for wider network coverage,<br />
commissi<strong>on</strong>ing of a new Online Charging System<br />
(OCS) for pre-paid services, introducti<strong>on</strong> of 3G<br />
services, the launch of affordable voice and data<br />
bundles and commissi<strong>on</strong>ing a new billing system<br />
for post-paid service.<br />
• Loan facility to finance capex projects. TNM has<br />
revealed that it has secured a l<strong>on</strong>g-term loan<br />
facility from a syndicate of local banks to finance<br />
its <strong>on</strong>-going capital investment programs. TNM<br />
plans to upgrade and develop its infrastructure<br />
with the additi<strong>on</strong> of innovative products. The<br />
group plans to expand coverage of 3.5G to more<br />
centres.<br />
• Lacklustre valuati<strong>on</strong> metrics. TNM trades at a<br />
demanding PER of 17.9x, relative to its SSA<br />
peers. Forward ratings are also demanding with a<br />
PER (T+1) of 13.4x. However, reports that<br />
Vodacom could be vying for a stake in the telco,<br />
present a speculative opportunity in our view.<br />
SPEC BUY.<br />
BLOOMBERG:TNM:MW<br />
SPEC BUY<br />
Current price (MWK) 1.89<br />
Current price (USc) 1.15<br />
Target price (MWK) 2.00<br />
Target price (USc) 1.21<br />
Upside/Downside (%) 6%<br />
Liquidity<br />
Market Cap (MWKm) 18,976.5<br />
Market Cap (USDm) 115.2<br />
Shares (m) 10,040.5<br />
Free float (%) 21.7<br />
Ave. daily vol ('000) 12,950<br />
Share price performance<br />
6 M<strong>on</strong>ths (%) 2.00 -5.5%<br />
Relative change (%)* 2.7%<br />
12 M<strong>on</strong>ths (%) 1.92 -1.6%<br />
Relative change (%)* -4.0%<br />
*Relative to MSCI Index<br />
Financials 2010 2011F 2012F<br />
Turnover 9,930.5 12,767.9 16,426.1<br />
EBITDA 3,646.9 4,916.1 6,596.4<br />
Attributable earnings 1,059.7 1,418.7 2,177.6<br />
EPS (t) 10.6 14.1 21.7<br />
DPS (t) 5.3 7.1 10.8<br />
NAV/share (t) 72.5 79.5 90.4<br />
Valuati<strong>on</strong> Ratios 2010 2011F 2012F<br />
<str<strong>on</strong>g>Sub</str<strong>on</strong>g>scribers' 000 1,034.4 1,500.0 1,616.5<br />
PBV (x) 2.6 2.4 2.1<br />
PER (x) 17.9 13.4 8.7<br />
EV/EBITDA(x) 5.7 4.2 2.9<br />
Gross ARPU (USD) 6.0 6.2 6.2<br />
EV/<str<strong>on</strong>g>Sub</str<strong>on</strong>g>scriber (USD) 221.2 152.5 141.5<br />
EBITDA Margin 36.7% 38.5% 40.2%<br />
Earnings Yield 5.6% 7.5% 11.5%<br />
Dividend Yield 2.8% 3.7% 5.7%<br />
Gearing 23.0% 17.9% 3.3%<br />
RoaA 7.7% 8.2% 10.4%<br />
RoaE 15.0% 18.6% 25.5%<br />
TNM: Price Vs Volume<br />
250<br />
700,000,000<br />
STRENGTHS<br />
Str<strong>on</strong>g brand name in Malawi<br />
Internati<strong>on</strong>al gateway enables the provisi<strong>on</strong><br />
WEAKNESSES<br />
With a low per capita GDP , growth<br />
prospects may be limited<br />
200<br />
150<br />
600,000,000<br />
500,000,000<br />
400,000,000<br />
of related services at lower rates<br />
First mover advantage<br />
Demand for data services may be<br />
c<strong>on</strong>strained by a lack of corporate<br />
demand bey<strong>on</strong>d major financial instituti<strong>on</strong>s.<br />
100<br />
300,000,000<br />
OPPORTUNITIES<br />
THREATS<br />
50<br />
200,000,000<br />
100,000,000<br />
Low mobile penetrati<strong>on</strong><br />
C<strong>on</strong>siderable scope for growth in<br />
<str<strong>on</strong>g>high</str<strong>on</strong>g> bandwidth applicati<strong>on</strong><br />
Increased competi<strong>on</strong><br />
Falling calling rates<br />
Ec<strong>on</strong>omic slowdown<br />
-<br />
06-Jul-09<br />
06-Sep-09<br />
06-Nov-09<br />
06-Jan-10<br />
06-Mar-10<br />
06-May-10<br />
06-Jul-10<br />
06-Sep-10<br />
06-Nov-10<br />
06-Jan-11<br />
06-Mar-11<br />
06-May-11<br />
06-Jul-11<br />
06-Sep-11<br />
-<br />
Increase network coverage<br />
Increased ec<strong>on</strong>omic activity<br />
Foreign currency shortages and inflati<strong>on</strong>ary<br />
pressures<br />
Political risks<br />
Volume Traded-RHS<br />
Price (MWK)-LHS<br />
32
Nature of Operati<strong>on</strong>s<br />
TNM Limited is a communicati<strong>on</strong>s and technology company<br />
and is the sec<strong>on</strong>d largest GSM mobile operator in Malawi<br />
having been awarded a 15-year licence from 28 May 1999.<br />
The company enjoys a market share of approximately 37%<br />
of the mobile sector and has more than 1.0m subscribers<br />
with over 200 base stati<strong>on</strong>s covering circa 50% of the<br />
country’s geographic reach.<br />
Shareholder Structure<br />
% Shareholding<br />
Malawi Telecomms Limited 44.4%<br />
Livingst<strong>on</strong>e Holdings Telecom 12.9%<br />
Old Mutual Life Assuarance 10.5%<br />
Press Corporati<strong>on</strong> Limited 10.5%<br />
Free float 21.7%<br />
Source: IAS<br />
Listed <strong>on</strong> the MSE, it was established in 1995 as a joint<br />
venture between Telekom Malaysia and the then<br />
government owned Malawi Telecommunicati<strong>on</strong>s Limited<br />
(MTL). In April 2007, Telekom Malaysia sold its 60%<br />
majority stake in TNM.<br />
Market Dynamics<br />
Most <str<strong>on</strong>g>Africa</str<strong>on</strong>g>n markets have experienced growth rates in<br />
mobile subscriber numbers in excess of 50% per annum.<br />
Malawi is a case in point, having increased its penetrati<strong>on</strong><br />
rate from an estimated 7.0% in 2007 to c21%, currently.<br />
Ec<strong>on</strong>omic growth in the country c<strong>on</strong>tinues to underpin the<br />
telecoms sector growth. In resp<strong>on</strong>se to significant<br />
investment by telecom operators, efficiency, quantity and<br />
quality of services is improving to meet the ec<strong>on</strong>omic and<br />
social needs of the country.<br />
Fig 43: <str<strong>on</strong>g>Sub</str<strong>on</strong>g>scriber Growth Vs Market Share<br />
1,400<br />
1,200<br />
1,000<br />
800<br />
600<br />
400<br />
200<br />
-<br />
2004 2005 2006 2007 2008 2009 2010F 2011F<br />
TNM ave. subs ('000)-LHS <str<strong>on</strong>g>Sub</str<strong>on</strong>g>sciber growth-RHS Market share-RHS<br />
Source: IAS/Company <str<strong>on</strong>g>Report</str<strong>on</strong>g>s<br />
80%<br />
70%<br />
60%<br />
50%<br />
40%<br />
30%<br />
20%<br />
10%<br />
0%<br />
The telecoms industry in Malawi has g<strong>on</strong>e through a<br />
number of transformati<strong>on</strong>s. Fixed line operators that have<br />
traditi<strong>on</strong>ally focused <strong>on</strong> data and teleph<strong>on</strong>y started<br />
moving towards greater mobility. At the same time, the<br />
mobile ph<strong>on</strong>e industry ventured into data services with<br />
the launch of <str<strong>on</strong>g>high</str<strong>on</strong>g> speed mobile broadband data services.<br />
Growth for operators has also been driven by low-cost<br />
handsets in rural areas. Moreover, an introducti<strong>on</strong> of VAS<br />
has also been another growth area.<br />
In terms of market competiti<strong>on</strong>, TNM currently lags<br />
Bharti’s Airtel Malawi. A key positive, however is that<br />
competiti<strong>on</strong> is <strong>on</strong>ly limited to two mobile operators. The<br />
third largest mobile operator failed to roll out its network<br />
by the established deadline whilst the fourth and fifth<br />
largest operators had their licenses revoked. This leaves<br />
room for existing players to grow.<br />
Fig 44: <str<strong>on</strong>g>Sub</str<strong>on</strong>g>scriber Types<br />
Post-paid<br />
subscribers, 1%<br />
Pre-paid<br />
subscribers, 99%<br />
Overview of H1 2011 Financial Performance<br />
Solid results. TNM released its H1 2011 results, indicating<br />
a 23% increase in revenue to MWK 5.3bn (USD 31.3m).<br />
According to management, the growth was driven by a rise<br />
in subscriber numbers that came about as a result of new<br />
product offerings and marketing promoti<strong>on</strong>s.<br />
A slight boost in margins. EBITDA rose 29% from MWK<br />
1.54bn in H1 2010 to MWK 1.99bn, despite rising costs<br />
related to <str<strong>on</strong>g>high</str<strong>on</strong>g>er levels of network maintenance and<br />
support costs. As a result, the EBITDA margin improved<br />
slightly over the period, from 36% to 37%. It is worth<br />
noting however that TNM has enjoyed healthy EBITDA<br />
margins of 52% for the past years but these have thinned<br />
to due to the network roll out. EBITDA margins are likely<br />
to hover around 35% compounded by the subsidy <strong>on</strong><br />
handsets for new subscribers resulting in a <str<strong>on</strong>g>high</str<strong>on</strong>g>er marginal<br />
subscriber cost.<br />
Income Statement (MWKm) H1 2010 H1 2011 % Δ<br />
Revenue 4,294.2 5,301.2 23%<br />
Direct operati<strong>on</strong>al costs (1,584.3) (1,869.4) 18%<br />
Gross profit 2,709.9 3,431.8 27%<br />
EBITDA 1,542.4 1,990.7 29%<br />
Operating proft 776.3 983.9 27%<br />
Net finance costs (187.1) (190.7) 2%<br />
Profit before tax 589.2 783.2 33%<br />
Profit after tax 412.5 587.4 42%<br />
EPS (MWK) 0.04 0.06 50%<br />
DPS (MWK) 0.02 0.02 0%<br />
EBITDA Margin 35.9% 37.6% 5%<br />
PBT Margin 13.7% 14.8% 8%<br />
Earnings Margin 9.6% 11.1% 15%<br />
33
Overall, TNM recorded a profit after tax of MWK 587.0m<br />
for H1 2011, implying 42% growth over the MWK 412.0m<br />
recorded in H1 2010.<br />
Fig 45: <str<strong>on</strong>g>Sub</str<strong>on</strong>g>scribers Vs Mobile Penetrati<strong>on</strong> Levels<br />
1,600<br />
80%<br />
Operati<strong>on</strong>al Review<br />
Talks with South <str<strong>on</strong>g>Africa</str<strong>on</strong>g>’s Vodacom? Indicati<strong>on</strong>s are that<br />
South <str<strong>on</strong>g>Africa</str<strong>on</strong>g>'s Vodacom is in talks to buy a stake in TNM.<br />
It also appears that TNM has streamlined some of its<br />
businesses to bring them closer in line with how Vodacom<br />
operates. Vodacom has previously announced that it is<br />
looking at expansi<strong>on</strong> opportunities in <str<strong>on</strong>g>Sub</str<strong>on</strong>g> <str<strong>on</strong>g>Saharan</str<strong>on</strong>g> <str<strong>on</strong>g>Africa</str<strong>on</strong>g>.<br />
Vodacom is already a dominant mobile carrier in South<br />
<str<strong>on</strong>g>Africa</str<strong>on</strong>g>, and has operati<strong>on</strong>s in Tanzania, the Democratic<br />
Republic of C<strong>on</strong>go, Mozambique and Lesotho.<br />
1,400<br />
1,200<br />
1,000<br />
800<br />
600<br />
400<br />
200<br />
-<br />
2004 2005 2006 2007 2008 2009 2010F 2011F<br />
TNM <str<strong>on</strong>g>Sub</str<strong>on</strong>g>s ('000)-LHS<br />
Nati<strong>on</strong>al Cellular Penetrati<strong>on</strong>-RHS<br />
Addressable pop penetrati<strong>on</strong>-RHS<br />
70%<br />
60%<br />
50%<br />
40%<br />
30%<br />
20%<br />
10%<br />
0%<br />
Loan facility to finance capex projects. TNM has<br />
revealed that it has secured a l<strong>on</strong>g-term loan facility<br />
from a syndicate of local banks to finance its <strong>on</strong>-going<br />
capital investment programs. TNM plans to upgrade and<br />
develop its infrastructure with the additi<strong>on</strong> of innovative<br />
products. The group plans to expand coverage of 3.5G to<br />
more centres. N<strong>on</strong>etheless, though the hope of new<br />
services remains <str<strong>on</strong>g>high</str<strong>on</strong>g>, the demand for such <str<strong>on</strong>g>high</str<strong>on</strong>g>-speed<br />
services remains limited. It remains unclear which<br />
applicati<strong>on</strong>s will be able to attract average customers<br />
into paying <str<strong>on</strong>g>high</str<strong>on</strong>g>er bills. There is tremendous potential in<br />
the sector and competiti<strong>on</strong> is likely to increase.<br />
Given the underlying industry dynamics, however, we<br />
believe TNM is perfectly positi<strong>on</strong>ed to capitalise <strong>on</strong> the<br />
str<strong>on</strong>g projected growth that the telecoms industry is<br />
expected to experience over the next few years.<br />
A focus data services. TNM became the first mobile<br />
operator to launch 3G services in 2009 and can now offer<br />
cutting edge services such as video calls, video and music<br />
streaming, <str<strong>on</strong>g>high</str<strong>on</strong>g> speed wireless internet access services 4-<br />
5 times faster than 2.5g and any other ISP provider <strong>on</strong> the<br />
market.<br />
Source: IAS/Company <str<strong>on</strong>g>Report</str<strong>on</strong>g>s<br />
Fig 46: Disaggregati<strong>on</strong> of <str<strong>on</strong>g>Sub</str<strong>on</strong>g>scriber Types<br />
100%<br />
90%<br />
80%<br />
70%<br />
60%<br />
50%<br />
40%<br />
30%<br />
20%<br />
10%<br />
0%<br />
2004 2005 2006 2007 2008 2009 2010F 2011F<br />
Ave c<strong>on</strong>tract subscibers ('000) Ave pre-paid subscribers ('000)<br />
Source: IAS/Company <str<strong>on</strong>g>Report</str<strong>on</strong>g>s<br />
Fig 47: TNM ARPU Trend (USD)<br />
16.00<br />
14.00<br />
12.00<br />
C<strong>on</strong>nectivity strengthened. TNM has strengthened its<br />
quality and reliability through the Internati<strong>on</strong>al Satellite<br />
Gateway and now offers <str<strong>on</strong>g>high</str<strong>on</strong>g>er bandwidth and internet<br />
speed through its c<strong>on</strong>necti<strong>on</strong> to the SEACOM Cable<br />
running via Mozambique. The internati<strong>on</strong>al gateway<br />
provides interesting scope for expanding the hard<br />
currency earning side of the business.<br />
10.00<br />
8.00<br />
6.00<br />
4.00<br />
2.00<br />
-<br />
2004 2005 2006 2007 2008 2009 2010F 2011F<br />
Leveraging <strong>on</strong> strategic partnerships. Strategic<br />
relati<strong>on</strong>ships and agreements have been entered into<br />
with suppliers, banks and other network operators to<br />
boost airtime sales for all aspects of TNM’s business. The<br />
internet business should support earnings growth. The<br />
demand for group products remains str<strong>on</strong>g given the low<br />
mobile penetrati<strong>on</strong> rate in Malawi of circa 21%.<br />
Valuati<strong>on</strong> and Recommendati<strong>on</strong><br />
TNM trades at a demanding PER of 16.6x, relative to its<br />
SSA peers. Forward ratings are also demanding with a PER<br />
(T+1) of 13.4x. <str<strong>on</strong>g>Report</str<strong>on</strong>g>s that Vodacom could be vying for a<br />
stake in the telco, present a speculative opportunity in<br />
our view. We believe a group such as Vodacom has the<br />
financial strength and operati<strong>on</strong>al expertise to swiftly<br />
turnaround the fortunes of TNM within the Malawan<br />
market. SPEC BUY.<br />
Source: IAS/Company <str<strong>on</strong>g>Report</str<strong>on</strong>g>s<br />
Fig 48: TNM Financial Analysis<br />
18,000<br />
16,000<br />
14,000<br />
12,000<br />
10,000<br />
8,000<br />
6,000<br />
4,000<br />
2,000<br />
-<br />
2009 2010 2011F 2012F<br />
Turnover (MWKm)-LHS EBITDA (MWKm)-LHS Sales growth -RHS EBITDA growth-RHS<br />
Source: IAS/Company <str<strong>on</strong>g>Report</str<strong>on</strong>g>s<br />
34<br />
40.0%<br />
35.0%<br />
30.0%<br />
25.0%<br />
20.0%<br />
15.0%<br />
10.0%<br />
5.0%<br />
0.0%
TNM - 5 YEAR CGR COMPARISON<br />
31 DECEMBER (MWKm) 2005 2006 2007 2008 2009 2010 2011F 2012F 5yr CAGR<br />
Balance Sheet<br />
Shareholders' equity 1,256.0 2,525.6 3,158.2 6,205.9 6,818.2 7,275.5 7,984.9 9,073.7 42%<br />
Minority interests<br />
Total shareholders' equity 1,256.0 2,788.2 3,351.6 6,490.7 7,252.7 7,943.3 9,029.6 10,696.8 45%<br />
Interest Bearing Debt 572.4 178.4 - - 2,145.4 2,523.4 2,392.6 2,342.2 35%<br />
Trade creditors 277.4 350.8 544.0 1,337.4 1,682.2 4,583.7 6,482.8 9,174.2 75%<br />
Current Liabilities 1,322.1 757.7 1,067.6 2,137.9 2,329.7 5,198.1 7,356.8 10,243.5 31%<br />
Total Liabilities and equity 3,358.4 3,724.3 4,419.2 8,628.6 11,727.8 15,664.8 18,779.0 23,282.5 36%<br />
Fixed Assets 2,050.8 2,594.0 3,092.9 5,798.2 9,231.6 13,207.8 16,123.3 19,447.2 45%<br />
Investments<br />
Stock - Trade net 27.4 14.9 108.6 179.2 182.0 81.8 89.4 97.8 24%<br />
Debtors 571.5 810.4 344.7 1,074.0 797.7 598.0 661.9 732.5 1%<br />
Cash at bank 605.9 202.6 832.1 1,534.4 642.0 852.8 963.9 2,043.7 7%<br />
Current Assets 1,307.6 1,130.3 1,285.6 2,794.7 2,397.3 2,269.2 2,439.8 3,587.0 12%<br />
Total Assets 3,358.4 3,724.3 4,419.2 8,628.6 11,727.8 15,664.8 18,779.0 23,282.5 36%<br />
Income Statement<br />
Turnover 2,835.1 4,275.2 5,771.3 6,701.9 8,205.0 9,930.5 12,767.9 16,426.1 28%<br />
EBITDA 1,376.3 2,228.7 2,638.9 2,708.5 2,920.0 3,646.9 4,916.1 6,596.4 22%<br />
Net finance income (129.1) (146.4) 30.0 38.7 (121.7) (423.8) (346.2) (228.9) 27%<br />
Profit before Tax 1,031.9 1,819.5 2,201.3 2,222.3 1,757.5 1,611.3 2,602.3 3,994.3 9%<br />
Taxati<strong>on</strong> (537.5) (549.8) (748.8) (692.3) (542.7) (551.6) (1,183.6) (1,816.7) 1%<br />
Profit after Tax 494.3 1,269.7 1,452.5 1,530.0 1,214.8 1,059.7 1,418.7 2,177.6 16%<br />
Minorities<br />
Attributable Income 494.3 1,269.7 1,452.5 1,530.0 1,214.8 1,059.7 1,418.7 2,177.6 16%<br />
Ratios<br />
Shares in issue (m) 10,040.5 10,040.5 10,040.5 10,040.5<br />
EPS(t) 4.9 12.6 14.5 15.2 12.1 10.6 14.1 21.7<br />
Cash EPS(t) 9.3 15.9 19.2 20.5 24.0 28.9 37.5 51.1<br />
DPS (t) 5.6 - 9.4 7.2 6.0 5.3 7.1 10.8<br />
NAV per share (t) 12.5 25.2 31.5 61.8 67.9 72.5 79.5 90.4<br />
Dividend Cover 0.9 n/a 1.5 2.1 2.0 2.0 2.0 2.0<br />
Dividend Yield 3.0% 0.0% 5.0% 3.8% 3.2% 2.8% 3.7% 5.7%<br />
Growth Ratios<br />
Sales growth 50.8% 35.0% 16.1% 22.4% 21.0% 28.6% 28.7%<br />
EBITDA growth 61.9% 18.4% 2.6% 7.8% 24.9% 34.8% 34.2%<br />
PBT growth 76.3% 21.0% 1.0% -20.9% -8.3% 61.5% 53.5%<br />
Earnings growth 156.9% 14.4% 5.3% -20.6% -12.8% 33.9% 53.5%<br />
Margins<br />
EBITDA Margin 48.5% 52.1% 45.7% 40.4% 35.6% 36.7% 38.5% 40.2%<br />
PBT Margin 36.4% 42.6% 38.1% 33.2% 21.4% 16.2% 20.4% 24.3%<br />
Earnings Margin 17.4% 29.7% 25.2% 22.8% 14.8% 10.7% 11.1% 13.3%<br />
Interest cover (times) 9.0 13.4 n/a n/a 15.4 4.8 8.5 18.4<br />
Effective Tax Rate 52.1% 30.2% 34.0% 31.2% 30.9% 34.2% 45.5% 45.5%<br />
35
EQUITY RESEARCH<br />
SOUTH AFRICA<br />
September 2011<br />
TELECOMS<br />
VODACOM GROUP LIMITED<br />
Also looking to <str<strong>on</strong>g>Africa</str<strong>on</strong>g>...but wings remain clipped<br />
Standard & Poor's (S&P) recently assigned its South<br />
<str<strong>on</strong>g>Africa</str<strong>on</strong>g>n nati<strong>on</strong>al scale l<strong>on</strong>g-term rating of zaAA and<br />
short term rating of zaA-1 to Vodacom Group for its<br />
str<strong>on</strong>g financial performance. The ratings show<br />
Vodacom's capacity to meet specific financial<br />
obligati<strong>on</strong>s. Thanks to its resilient and str<strong>on</strong>g positi<strong>on</strong><br />
in South <str<strong>on</strong>g>Africa</str<strong>on</strong>g>n mobile teleph<strong>on</strong>y, where Vodacom is<br />
the leading operator.<br />
• Absa deal to boost customer numbers.<br />
Vodacom and South <str<strong>on</strong>g>Africa</str<strong>on</strong>g>'s largest retail bank,<br />
Absa recently announced a multi-milli<strong>on</strong> rand<br />
agreement, in which the two will collaborate in<br />
order to accelerate the pace of mobile<br />
innovati<strong>on</strong> and expand the range of banking and<br />
mobile services <strong>on</strong> offer to c<strong>on</strong>sumers. We<br />
expect this to boost customer growth despite<br />
the intensifying competiti<strong>on</strong> and pressure <strong>on</strong><br />
pricing.<br />
• Data and VAS opportunities exist. Clearly,<br />
most of Vodacom’s’ SSA markets are still some<br />
years from reaching voice saturati<strong>on</strong>. While,<br />
data use is still limited, there is a huge growth<br />
potential. The company has launched Vodacom<br />
M-PESA in Tanzania. The mobile m<strong>on</strong>ey-transfer<br />
service has been a success in Tanzania where<br />
there are over 1.0m customers who generated<br />
transacti<strong>on</strong>s worth USD 169.0m in the m<strong>on</strong>th of<br />
March 2011 al<strong>on</strong>e. However, take-up of<br />
Vodacom M-PESA in South <str<strong>on</strong>g>Africa</str<strong>on</strong>g> has been dismal<br />
with fewer than 100,000 registered customers as<br />
at 31 March 2011. The group is planning to<br />
launch Vodacom M-PESA in Lesotho and<br />
Mozambique in 2012.<br />
• Relative to MTN, the stock appears more<br />
attractive. However, ratings are at a significant<br />
premium to our SSA averages.<br />
Vodacom: Price Vs Volume<br />
10,000<br />
9,000<br />
8,000<br />
7,000<br />
6,000<br />
40,000,000<br />
35,000,000<br />
30,000,000<br />
25,000,000<br />
BLOOMBERG: VOD:SJ<br />
NOT RATED<br />
Current price (ZAR) 91.4<br />
Current price (USD) 12.3<br />
Target price (ZAR)<br />
Target price (USD)<br />
Upside/Downside (%)<br />
Liquidity<br />
Market Cap (ZARm) 136,058.5<br />
Market Cap (USDm) 18,343.3<br />
Shares (m) 1,488.0<br />
Free float (%) 16.0<br />
Ave. daily vol ('000) 1,431<br />
Share price performance<br />
6 M<strong>on</strong>ths (%) 74.05 23.5%<br />
Relative change (%)* 31.7%<br />
12 M<strong>on</strong>ths (%) 62.82 45.6%<br />
Relative change (%)* 43.2%<br />
*Relative to MSCI Index<br />
Financials (ZARm) - FY 31 Mar 2011 2012F 2013F<br />
Turnover 61,197 64,563 69,405<br />
EBITDA 19,051 20,520 23,160<br />
Profit before tax 12,638 14,901 16,137<br />
Profit after tax 7,979 9,373 9,918<br />
EPS (ZAR) 5.62 6.46 6.81<br />
NAV/share (ZAR) 10.64 10.43 10.37<br />
DPS (ZAR) 3.55 4.07 4.29<br />
Valuati<strong>on</strong> Ratios 2011 2012F 2013F<br />
<str<strong>on</strong>g>Sub</str<strong>on</strong>g>scribers' 000 43,500 45,000 47,000<br />
PER (x) 16.28 14.15 13.43<br />
PBV (x) 8.59 8.76 8.82<br />
EV/EBITDA (x) 7.6 7.1 6.3<br />
Gross ARPU (USD) 15.8 16.1 16.6<br />
EV/<str<strong>on</strong>g>Sub</str<strong>on</strong>g>scriber (USD) 451.2 436.4 417.5<br />
EBITDA Margin 31.1% 31.8% 33.4%<br />
Earnings Yield 6.1% 7.1% 7.4%<br />
Dividend Yield 3.9% 4.5% 4.7%<br />
Gearing 66.5% 69.9% 73.4%<br />
RoaA 19.8% 21.3% 18.9%<br />
RoaE 56.2% 61.7% 65.5%<br />
STRENGTHS<br />
WEAKNESSES<br />
Str<strong>on</strong>g brand name <strong>on</strong>in South <str<strong>on</strong>g>Africa</str<strong>on</strong>g><br />
Exposure to <str<strong>on</strong>g>high</str<strong>on</strong>g> risk countries<br />
Financial strength and operati<strong>on</strong>al expertise<br />
Exposure to currencies other than reporting<br />
enables the group to take advantage of acquisiti<strong>on</strong>s currency creates translati<strong>on</strong>-related risks<br />
Strategic partnerships e.g ABSA<br />
5,000<br />
4,000<br />
3,000<br />
2,000<br />
1,000<br />
-<br />
20,000,000<br />
15,000,000<br />
10,000,000<br />
5,000,000<br />
-<br />
OPPORTUNITIES<br />
Low mobile penetrati<strong>on</strong> in SSA markets<br />
C<strong>on</strong>siderable scope for growth in data services<br />
Further diversificati<strong>on</strong> of operating portfolio can<br />
reduce the c<strong>on</strong>centrati<strong>on</strong> of risk<br />
THREATS<br />
Increased regulati<strong>on</strong>s in various countries<br />
Slowing revenue growth in some of the<br />
markets as a result of maturity<br />
Shortages of skilled human resources<br />
18-May-09<br />
18-Jul-09<br />
18-Sep-09<br />
18-Nov-09<br />
18-Jan-10<br />
18-Mar-10<br />
18-May-10<br />
18-Jul-10<br />
18-Sep-10<br />
18-Nov-10<br />
18-Jan-11<br />
18-Mar-11<br />
18-May-11<br />
18-Jul-11<br />
Volume Traded-RHS<br />
Price (ZAR)-LHS<br />
36
Nature of Operati<strong>on</strong>s<br />
Vodacom is a communicati<strong>on</strong>s group providing mobile<br />
communicati<strong>on</strong>s and related services to approximately<br />
43.5m customers. Its mobile network covers a total<br />
populati<strong>on</strong> of approximately 179.0m people across five<br />
countries; South <str<strong>on</strong>g>Africa</str<strong>on</strong>g>, Tanzania, the DRC, Lesotho and<br />
Mozambique. Vodacom's presence in <str<strong>on</strong>g>Africa</str<strong>on</strong>g> was<br />
strengthened with the acquisiti<strong>on</strong> of Gateway <strong>on</strong> 30<br />
December 2008, which has customers in 40 countries in<br />
<str<strong>on</strong>g>Africa</str<strong>on</strong>g>, providing communicati<strong>on</strong>s services to multinati<strong>on</strong>al<br />
companies and telecommunicati<strong>on</strong>s network<br />
operators. In additi<strong>on</strong>, majority shareholder Vodaf<strong>on</strong>e<br />
Group has agreed to use Vodacom as its exclusive<br />
investment vehicle in <str<strong>on</strong>g>Sub</str<strong>on</strong>g> <str<strong>on</strong>g>Saharan</str<strong>on</strong>g> <str<strong>on</strong>g>Africa</str<strong>on</strong>g><br />
Shareholder Structure<br />
% Shareholding<br />
Vodaf<strong>on</strong>e Group 65.0%<br />
South <str<strong>on</strong>g>Africa</str<strong>on</strong>g>n Government 13.9%<br />
Government employees' pensi<strong>on</strong> fund 5.4%<br />
Free float 16.0%<br />
Source: IAS<br />
Market Dynamics<br />
Regi<strong>on</strong>al Markets<br />
Generally, the competitive envir<strong>on</strong>ment in <str<strong>on</strong>g>Sub</str<strong>on</strong>g> <str<strong>on</strong>g>Saharan</str<strong>on</strong>g><br />
<str<strong>on</strong>g>Africa</str<strong>on</strong>g> is increasingly becoming more intense. For<br />
example, price competiti<strong>on</strong> has been fierce in Tanzania<br />
and DRC with prices having fallen as low as USD 0.02 per<br />
minute in the former. Competitive pressure has<br />
c<strong>on</strong>tributed to an 18.0% a year decline in the effective<br />
price per minute across the group. New players have also<br />
entered the mobile data market. New forms of<br />
competiti<strong>on</strong> are also coming from handset manufacturers,<br />
internet companies and software providers, as well as<br />
systems integrators in the c<strong>on</strong>verged communicati<strong>on</strong>s<br />
space.<br />
South <str<strong>on</strong>g>Africa</str<strong>on</strong>g>n Market<br />
Generally, the SA market is now mature and is displaying<br />
much more competitive behavior as compared to other<br />
SSA markets. There is also a threat of regulatory pressure<br />
over the next three years in South <str<strong>on</strong>g>Africa</str<strong>on</strong>g>, and c<strong>on</strong>tinuing<br />
requirements for sizeable infrastructure investment.<br />
Fig 49: Vodacom ARPUs Vs Customer Numbers<br />
30,000<br />
25,000<br />
20,000<br />
15,000<br />
10,000<br />
5,000<br />
-<br />
South <str<strong>on</strong>g>Africa</str<strong>on</strong>g> Tanzania DRC Mozambique Lesotho<br />
Customers (000)-LHS<br />
ARPU (ZAR)-RHS<br />
Source: IAS/Company <str<strong>on</strong>g>Report</str<strong>on</strong>g>s<br />
180<br />
160<br />
140<br />
120<br />
100<br />
80<br />
60<br />
40<br />
20<br />
-<br />
The South <str<strong>on</strong>g>Africa</str<strong>on</strong>g>n cellular industry is experiencing a rapid<br />
expansi<strong>on</strong> in mobile broadband usage. Opportunities to<br />
grow voice revenues are diminishing as the industry nears<br />
saturati<strong>on</strong>. As a result, Mobile Network Operators (MNOs)<br />
are increasingly looking to data services as the next<br />
growth fr<strong>on</strong>tier. Vodacom, for example, has g<strong>on</strong>e as far as<br />
to cite mobile broadband as representing the future of<br />
the firm. Given Vodacom’s intenti<strong>on</strong> to increasingly<br />
appeal to SA’s mass market, we believe that Vodacom is<br />
nearing an inflecti<strong>on</strong> point and that the lower-margin,<br />
prepaid segment will be an increasingly dominant<br />
c<strong>on</strong>tributor in future<br />
Overview of Q1 2012 Financial Performance<br />
Vodacom reported an 8.1% rise in revenues for Q1 2012 to<br />
ZAR 15.6bn (USD 2.3bn), compared with ZAR 14.4bn in the<br />
previous period. Customer numbers increased 20.4% to<br />
45.4m. Performance was largely driven by str<strong>on</strong>g data<br />
growth, with group data revenue increasing 37.6% and<br />
active data customers increasing 43.3% to 10.9m.<br />
Operati<strong>on</strong>al Review<br />
South <str<strong>on</strong>g>Africa</str<strong>on</strong>g> Operati<strong>on</strong>s<br />
A total of 1.2m customers were added in Q1 2012 and<br />
there was 16.3% y-o-y increase in average minutes of use.<br />
Prepaid customers closed at 22.4m adding just over 1.0m<br />
in the quarter.<br />
Revenue Q1 2010 Q1 2012 % Δ<br />
South <str<strong>on</strong>g>Africa</str<strong>on</strong>g> 12,567 13,537 7.7%<br />
Internati<strong>on</strong>al 1,922 2,119 10.2%<br />
Corporate (83) (87) 4.8%<br />
Total Revenue 14,406 15,569 8.1%<br />
Service Revenue Q1 2010 Q1 2012 % ∆<br />
South <str<strong>on</strong>g>Africa</str<strong>on</strong>g> 11,012 11,558 5.0%<br />
Internati<strong>on</strong>al 1,859 2,064 11.0%<br />
Corporate (69) (70) 1.4%<br />
Total Service Revenue 12,802 13,552 5.9%<br />
South <str<strong>on</strong>g>Africa</str<strong>on</strong>g> Indicators Q1 2010 Q1 2012 % ∆<br />
Customers (m) 23.2 27.7 19.7%<br />
ARPU (ZAR) 149 142 -4.7%<br />
Internati<strong>on</strong>al Indicators Q1 2010 Q1 2012 % ∆<br />
Customers (m) 14.561 17.686 21.5%<br />
ARPU (ZAR) 36.25 32.5 -10.3%<br />
37
C<strong>on</strong>tract customer growth remained str<strong>on</strong>g; up 13.9% to<br />
5.3m. Gross c<strong>on</strong>necti<strong>on</strong>s were up 58.9% to 3.6m. Total<br />
ARPU was down 4.7% to ZAR 142, largely due to a 24.8%<br />
reducti<strong>on</strong> in the effective price per minute, offset by a<br />
16.3% increase in average minutes of use stimulated by<br />
off-peak promoti<strong>on</strong>al offers. C<strong>on</strong>tract ARPU was down<br />
10.2% to ZAR 369 due to str<strong>on</strong>g growth of lower end<br />
c<strong>on</strong>tract packages and reduced out of bundle spend.<br />
Prepaid ARPUs remained flat at ZAR 79. Data revenue<br />
increased 35.4% to ZAR 1.86bn and active data customers<br />
grew 37.7% to 9.6m. PC c<strong>on</strong>nectivity devices increased by<br />
approximately 43,000 in the quarter to 1.1m. Active smart<br />
ph<strong>on</strong>es <strong>on</strong> the network increased by more than 0.4m to<br />
3.7m.<br />
Overall, South <str<strong>on</strong>g>Africa</str<strong>on</strong>g> delivered a robust performance with<br />
service revenue growing 5.0% to ZAR 11.56m mainly due to<br />
robust data growth. Revenue increased 7.7% outpacing<br />
service revenue growth, largely due to a 28.0% increase in<br />
equipment revenues. The group c<strong>on</strong>tinued to make<br />
substantial investments in the network, to enhance quality<br />
and support the growth in data traffic, adding 107 3G base<br />
stati<strong>on</strong>s in the quarter.<br />
Internati<strong>on</strong>al Operati<strong>on</strong>s<br />
There was an improvement from the internati<strong>on</strong>al<br />
operati<strong>on</strong>s. Revenue increased by 10.2% to ZAR 2.1bn.<br />
Service revenue increased by 11.0% to ZAR 2.1bn, largely<br />
due to growth in voice traffic of 10.8% offset by a decline<br />
in the effective price per minute of 2.3%. In local<br />
currencies, ARPU in Tanzania and Mozambique increased<br />
y-o-y. The Internati<strong>on</strong>al operati<strong>on</strong>s recorded customer<br />
growth of 21.5% to 17.7m, adding 729,000 customers in<br />
the quarter. While data revenue is <strong>on</strong>ly 4.4% of service<br />
revenue in the Internati<strong>on</strong>al operati<strong>on</strong>s, it increased by<br />
109.3% mainly due to str<strong>on</strong>g growth in M-PESA active<br />
customers to 1.6m in Tanzania, adding just over 342,000<br />
in the quarter<br />
Outlook<br />
Service revenue to grow in “low single digits”.<br />
Management has indicated it is likely for service revenue<br />
to grow in low single digits due to the effects of increased<br />
competiti<strong>on</strong> after the launch of 8ta and the ‘relaunch’ of<br />
Cell C. The group’s capex program (ZAR 7.7bn) will focus<br />
<strong>on</strong> the accelerated rollout of mobile broadband coverage<br />
which will support c<strong>on</strong>tinued growth in demand for data<br />
services. Management said it aims to triple data users <strong>on</strong><br />
its network to 25.0m users over the next 2 years.<br />
Fig 50: Vodacom Revenue C<strong>on</strong>tributi<strong>on</strong><br />
Internati<strong>on</strong>al<br />
15%<br />
Source: IAS/Company <str<strong>on</strong>g>Report</str<strong>on</strong>g>s<br />
South <str<strong>on</strong>g>Africa</str<strong>on</strong>g><br />
85%<br />
Growth into <str<strong>on</strong>g>Africa</str<strong>on</strong>g> limited by Vodaf<strong>on</strong>e’s shareholding<br />
in the group. Unlike MTN, Vodacom has kept its expansi<strong>on</strong><br />
drive “closer to home’, within the SADC regi<strong>on</strong>, given the<br />
fact that Vodaf<strong>on</strong>e is already invested directly in telcos<br />
such as Safaricom in Kenya. However, Vodaf<strong>on</strong>e has<br />
defined Vodacom as its <str<strong>on</strong>g>Sub</str<strong>on</strong>g> <str<strong>on</strong>g>Saharan</str<strong>on</strong>g> <str<strong>on</strong>g>Africa</str<strong>on</strong>g> investment<br />
vehicle. Growth going forward will therefore be a<br />
functi<strong>on</strong> of organic means, technology and service<br />
evoluti<strong>on</strong>, especially in data services. We also expect a<br />
spike in CAPEX in about 3 years time as LTE becomes a<br />
priority. In the absence of other opportunities, we believe<br />
that the company will likely return value to its<br />
shareholders through dividends.<br />
Fig 53: Vodacom Financial Analysis<br />
80,000<br />
70,000<br />
60,000<br />
50,000<br />
40,000<br />
30,000<br />
20,000<br />
10,000<br />
-<br />
2010 2011 2012F 2013F<br />
Turnover(ZARm)-LHS Operating Profit (ZARm)-LHS Sales growth -RHS EBITDA growth-RHS<br />
Source: IAS/Company <str<strong>on</strong>g>Report</str<strong>on</strong>g>s<br />
18.0%<br />
16.0%<br />
14.0%<br />
12.0%<br />
10.0%<br />
8.0%<br />
6.0%<br />
4.0%<br />
2.0%<br />
0.0%<br />
-2.0%<br />
-4.0%<br />
38
VODACOM GROUP - 5 YEAR CGR COMPARISON<br />
31 MAR (ZARm) 2005* 2006* 2007* 2008* 2009 2010 2011 2012F 2013F 5yr CAGR<br />
Balance Sheet<br />
Shareholders' equity 7,826 8,389 9,426 11,402 14,017 13,738 15,622 15,527 15,427 13.2%<br />
Minority interests 129 283 221 404 1,081 898 558 558 558 14.5%<br />
Total shareholders' equity 7,954 8,672 9,647 11,805 15,098 14,636 16,180 16,085 15,985 13.3%<br />
Current Liabilities 6,875 7,339 9,892 10,372 11,487 11,917 13,092 13,681 14,297 12.3%<br />
Total Liabilities and equity 22,566 24,768 28,470 34,175 47,359 41,691 41,435 48,720 58,784 10.8%<br />
PPE 12,231 13,387 17,073 19,120 21,844 21,383 21,577 22,526 23,518 10.0%<br />
Current Assets 8,662 8,689 7,626 9,707 12,135 12,560 13,453 19,507 28,285 9.1%<br />
Total Assets 22,566 24,768 28,470 34,175 47,359 41,691 41,435 48,720 58,784 10.8%<br />
Income Statement<br />
Revenue 27,315 34,043 41,146 48,178 55,442 58,535 61,197 64,563 69,405 12.4%<br />
Selling & distributi<strong>on</strong> expenses (767) (977) (1,146) (1,264) (1,793) (1,728) (2,086) (2,180) (2,289) 16.4%<br />
Other operating expenses - - - - (5,624) (5,977) (6,928) (7,240) (7,602)<br />
Impairment of assets (268) 53 (23) (30) (112) (3,370) (1,508) (1,576) (1,655)<br />
Depreciati<strong>on</strong> of PPE (2,611) (2,652) (2,902) (3,366) (4,683) (5,157) (5,355) (5,596) (5,876) 15.1%<br />
Amortisati<strong>on</strong> of intangible assets (232) (344) (459) (545) - - - - -<br />
Operating Profit 6,485 8,866 10,860 12,491 12,005 11,238 13,696 14,924 17,285 9.1%<br />
Finance income 663 659 75 72 108 124 109 118 127 -30.2%<br />
Finance costs (642) (1,318) (538) (496) (1,876) (2,417) (1,167) (1,220) (1,274) -2.4%<br />
Profit before tax 6,506 8,207 10,396 12,067 10,237 8,945 12,638 14,901 16,137 9.0%<br />
Income tax expense (2,614) (3,078) (3,836) (4,109) (4,045) (4,745) (4,659) (5,961) (6,220) 8.6%<br />
Profit after tax 3,892 5,129 6,560 7,958 6,192 4,200 7,979 9,373 9,918 9.2%<br />
Ratios<br />
Weighted shares (m) 0.01 0.01 0.01 0.01 1,488.03 1,486.36 1,468.39 1,487.95 1,487.95<br />
EPS (ZAR) 38,614,000 50,261,000 63,424,000 78,114,000 4.09 2.82 5.62 6.46 6.81<br />
DPS (ZAR) 34,000,000 45,000,000 54,000,000 59,400,000 3.50 1.10 3.55 4.07 4.29<br />
NAV/Share 782,560 841,210 942,580 1,140,170 9.42 9.24 10.64 10.43 10.37<br />
Dividend Cover 1.14 1.12 1.17 1.32 1.17 2.57 1.58 1.59 1.59<br />
Dividend Yield 0.0% 0.0% 0.0% 0.0% 3.8% 1.2% 3.9% 4.5% 4.7%<br />
Growth Ratios<br />
Sales growth 24.6% 20.9% 17.1% 15.1% 5.6% 4.5% 5.5% 7.5%<br />
EBITDA growth 27.2% 19.9% 15.3% 1.7% -1.8% 16.2% 7.7% 12.9%<br />
Op Profit growth 36.7% 22.5% 15.0% -3.9% -6.4% 21.9% 9.0% 15.8%<br />
PBT growth 26.1% 26.7% 16.1% -15.2% -12.6% 41.3% 17.9% 8.3%<br />
Earnings growth 29.8% 26.5% 23.2% -22.0% -31.1% 96.5% 16.6% 5.4%<br />
Margins<br />
EBITDA Margin 34.2% 34.8% 34.6% 34.0% 30.1% 28.0% 31.1% 31.8% 33.4%<br />
OP Margin 23.7% 26.0% 26.4% 25.9% 21.7% 19.2% 22.4% 23.1% 24.9%<br />
PBT Margin 23.8% 24.1% 25.3% 25.0% 18.5% 15.3% 20.7% 23.1% 23.3%<br />
Earnings Margin 14.1% 14.7% 15.4% 16.2% 11.0% 7.2% 13.5% 14.9% 14.6%<br />
Effective Tax Rate 40.2% 37.5% 36.9% 34.1% 39.5% 53.0% 36.9% 40.0% 38.5%<br />
*Note: During the period 2005 to 2008, Vodacom was not listed <strong>on</strong> the JSE and per share figures are based <strong>on</strong> 10,000 shares in issue<br />
Note: Given that our focus is mainly <strong>on</strong> SSA Excluding South <str<strong>on</strong>g>Africa</str<strong>on</strong>g> this secti<strong>on</strong> has been compiled strictly for comparative purposes. Also<br />
note that our forecasts are based <strong>on</strong> Thomps<strong>on</strong> Reuters c<strong>on</strong>sensus estimates.<br />
39
Capital<br />
Securities<br />
Botswana<br />
Ground Floor,<br />
Exchange House<br />
Block 6, Plot<br />
64511<br />
Fairgrounds,<br />
Gabor<strong>on</strong>e,<br />
Botswana<br />
Tel: + 267 318<br />
8886<br />
Cell: + 267 7 132<br />
1421 / 7 162<br />
4390<br />
<str<strong>on</strong>g>Imara</str<strong>on</strong>g> <str<strong>on</strong>g>Africa</str<strong>on</strong>g><br />
Securities (A<br />
divisi<strong>on</strong> of <str<strong>on</strong>g>Imara</str<strong>on</strong>g><br />
SP Reid)<br />
<str<strong>on</strong>g>Imara</str<strong>on</strong>g> House,<br />
Block 3, 257<br />
Oxford Road,<br />
Illovo,<br />
Johannesburg,<br />
2146<br />
South <str<strong>on</strong>g>Africa</str<strong>on</strong>g><br />
Direct line: +27<br />
11 550 6223<br />
Mobile: +27 82<br />
468 8126<br />
Tel: +27 11 550<br />
6200<br />
Fax: +27 11 550<br />
6295<br />
<str<strong>on</strong>g>Imara</str<strong>on</strong>g> Securities<br />
Angola<br />
SCVM Limitada<br />
Rua Rainha Ginga<br />
74, 13 th Floor,<br />
Luanda, Angola<br />
Tel: +244 222<br />
372 029/36<br />
Fax: +244 222<br />
332 340<br />
<str<strong>on</strong>g>Imara</str<strong>on</strong>g> Edwards<br />
Securities (Pvt.)<br />
Ltd.<br />
Tendeseka Office<br />
Park<br />
1st Floor Block 2<br />
Samora Machel<br />
Ave.<br />
Harare,<br />
Zimbabwe<br />
Tel: +2634<br />
790590<br />
Fax:+2634<br />
791435<br />
4 Fanum House<br />
Cnr. Leopold<br />
Takawira/Josiah<br />
T<strong>on</strong>gogara Street<br />
Bulawayo<br />
Tel: +263 9<br />
74554<br />
Fax: +263 9<br />
66024<br />
Members of the<br />
Zimbabwe Stock<br />
Exchange<br />
<str<strong>on</strong>g>Imara</str<strong>on</strong>g> S P Reid<br />
(Pty)<br />
Ltd<br />
<str<strong>on</strong>g>Imara</str<strong>on</strong>g> House,<br />
Block 3, 257<br />
Oxford Road,<br />
Illovo,<br />
Johannesburg,<br />
2146<br />
South <str<strong>on</strong>g>Africa</str<strong>on</strong>g><br />
Tel: +27 11 550<br />
6200<br />
Fax: +27 11 550<br />
6295<br />
Member of the<br />
JSE Securities<br />
Exchange<br />
Namibia Equity<br />
Brokers (Pty)<br />
Ltd<br />
1st Floor City<br />
Centre<br />
Building, West<br />
Wing<br />
Levins<strong>on</strong> Arcade<br />
Windhoek<br />
Namibia<br />
Tel: +264 61<br />
246666<br />
Fax: +264<br />
61256789<br />
Member of the<br />
Namibia Stock<br />
Exchange<br />
Stockbrokers<br />
Malawi Ltd<br />
Able House<br />
Cnr. Hanover<br />
Avenue/<br />
Chilembwe Road<br />
Blantyre<br />
Malawi<br />
Tel: +265<br />
1822803<br />
Member of the<br />
Malawi Stock<br />
Exchange<br />
Stockbrokers<br />
Zambia Ltd<br />
2nd Floor (Wing),<br />
Stock Exchange<br />
Building<br />
Central Park<br />
Corner<br />
Church/Cairo<br />
Roads<br />
P O Box 38956<br />
Lusaka<br />
Zambia<br />
Tel: +260<br />
211232455<br />
Fax: +260<br />
211224055<br />
Member of the<br />
Zambia<br />
Stock Exchange<br />
This research report is not an offer to sell or the solicitati<strong>on</strong> of an offer to buy or subscribe for any securities. The securities referred to in this report<br />
may not be eligible for sale in some jurisdicti<strong>on</strong>s. The informati<strong>on</strong> c<strong>on</strong>tained in this report has been compiled by <str<strong>on</strong>g>Imara</str<strong>on</strong>g> S.P. Reid (Pty) Ltd, (“<str<strong>on</strong>g>Imara</str<strong>on</strong>g>”)<br />
from sources that it believes to be reliable, but no representati<strong>on</strong> or warranty is made or guarantee given by <str<strong>on</strong>g>Imara</str<strong>on</strong>g> or any other pers<strong>on</strong> as to its<br />
accuracy or completeness. All opini<strong>on</strong>s and estimates expressed in this report are (unless otherwise indicated) entirely those of <str<strong>on</strong>g>Imara</str<strong>on</strong>g> as of the date<br />
of this report <strong>on</strong>ly and are subject to change without notice. Neither <str<strong>on</strong>g>Imara</str<strong>on</strong>g> nor any other member of the <str<strong>on</strong>g>Imara</str<strong>on</strong>g> group of companies including their<br />
respective associated companies (together “Group Companies”), nor any other pers<strong>on</strong>, accepts any liability whatsoever for any loss howsoever arising<br />
from any use of this report or its c<strong>on</strong>tents or otherwise arising in c<strong>on</strong>necti<strong>on</strong> therewith. Each recipient of this report shall be solely resp<strong>on</strong>sible for<br />
making its own independent investigati<strong>on</strong> of the business, financial c<strong>on</strong>diti<strong>on</strong> and prospects of companies referred to in this report. Group Companies<br />
and their respective affiliates, officers, directors and employees, including pers<strong>on</strong>s involved in the preparati<strong>on</strong> or issuance of this report may, from<br />
time to time (i) have positi<strong>on</strong>s in, and buy or sell, the securities of companies referred to in this report (or in related investments); (ii) have a<br />
c<strong>on</strong>sulting, investment banking or broking relati<strong>on</strong>ship with a company referred to in this report; and (iii) to the extent permitted under applicable<br />
law, have acted up<strong>on</strong> or used the informati<strong>on</strong> c<strong>on</strong>tained or referred to in this report including effecting transacti<strong>on</strong>s for their own account in an<br />
investment (or related investment) in respect of any company referred to in this report, prior to or immediately following its publicati<strong>on</strong>. This report<br />
may not have been distributed to all recipients at the same time. This report is issued <strong>on</strong>ly for the informati<strong>on</strong> of and may <strong>on</strong>ly be distributed to<br />
professi<strong>on</strong>al investors (or, in the case of the United States, major US instituti<strong>on</strong>al investors as defined in Rule 15a-6 of the US Securities Exchange Act<br />
of 1934) and dealers in securities and must not be copied, published or reproduced or redistributed (in whole or in part) by any recipient for any<br />
purpose. © <str<strong>on</strong>g>Imara</str<strong>on</strong>g> <str<strong>on</strong>g>Africa</str<strong>on</strong>g> Securities (A divisi<strong>on</strong> of <str<strong>on</strong>g>Imara</str<strong>on</strong>g> SP Reid)<br />
40