Water Management for Irrigation in Kerala - India Environment Portal
Water Management for Irrigation in Kerala - India Environment Portal
Water Management for Irrigation in Kerala - India Environment Portal

You also want an ePaper? Increase the reach of your titles
YUMPU automatically turns print PDFs into web optimized ePapers that Google loves.
NOTES<br />
<strong>Water</strong> <strong>Management</strong><br />
<strong>for</strong> <strong>Irrigation</strong> <strong>in</strong> <strong>Kerala</strong><br />
M Lathika<br />
With the grow<strong>in</strong>g threat of food<br />
<strong>in</strong>security and a largely erratic<br />
ra<strong>in</strong>fall pattern, <strong>Kerala</strong>, despite its<br />
very high rate of annual<br />
precipitation, has embarked on a<br />
series of large budget irrigation<br />
schemes. However, with the shift<br />
<strong>in</strong> acreage <strong>in</strong> favour of certa<strong>in</strong><br />
cash crops which demand<br />
relatively less moisture, the<br />
requirement of water <strong>in</strong><br />
agriculture may change. This<br />
paper f<strong>in</strong>ds, after estimat<strong>in</strong>g the<br />
total water required <strong>for</strong> irrigation<br />
purposes <strong>in</strong> <strong>Kerala</strong>, that the state<br />
government need not pump a<br />
huge amount of funds <strong>in</strong>to major<br />
irrigation projects.<br />
I owe a great deal to C E Ajith Kumar <strong>for</strong> all the<br />
back-end support especially <strong>in</strong> data analysis.<br />
The comments of the delegates of a conference<br />
on “<strong>Water</strong> Resources Policy <strong>in</strong> South Asia” at<br />
Colombo, 17-20 December 2008, where the<br />
first version of this paper was presented, also<br />
helped shap<strong>in</strong>g the article <strong>in</strong>to this <strong>for</strong>m.<br />
M Lathika (lathikajit@gmail.com) is with the<br />
Department of Economics, NSS College <strong>for</strong><br />
Women, Thiruvananthapuram.<br />
Despite <strong>Kerala</strong>’s bounty of natural<br />
wealth, the state f<strong>in</strong>ds itself <strong>in</strong>creas<strong>in</strong>gly<br />
under pressure <strong>in</strong> the two vital<br />
resources of land and water. Effici ency <strong>in</strong><br />
their use is, there<strong>for</strong>e, very important.<br />
Traditionally, the crop choice of the<br />
farmers <strong>in</strong> <strong>Kerala</strong> had a strong association<br />
with the physiographic nature of the land<br />
they cultivate and the suitability of the crop<br />
to the land. The water-rich valleys (0-7.5 m<br />
altitude) were earmarked <strong>for</strong> moisturelov<strong>in</strong>g,<br />
submergence-tolerant crops like<br />
paddy, sugar cane, etc. In the lower slopes<br />
(of 7.5-75.0 m altitude), where the water<br />
table is fairly high, but the soil is dra<strong>in</strong>ed,<br />
annual/seasonal crops like tapioca, planta<strong>in</strong>s,<br />
vegetables, etc, and perennial crops<br />
like coconuts, rubber, pepper, cashew,<br />
arecanut, etc, are preferred. The perennial<br />
cash crops of tea, coffee (Robusta<br />
variety), pepper and even coconuts, rubber,<br />
etc, dom<strong>in</strong>ate the high land (75-1,000 m)<br />
regions. High ranges (700-1,500 m) are<br />
devoted to crops like cardamom, coffee<br />
(Arabia) and tea (GoK 1998; GoK 2003;<br />
Rao 2003). Land utilisation <strong>in</strong> <strong>Kerala</strong> has<br />
undergone drastic changes, as much of the<br />
land hitherto engaged <strong>for</strong> water-<strong>in</strong>tensive<br />
foodgra<strong>in</strong> production has been either<br />
converted to suit human needs other than<br />
cultivation or is <strong>in</strong>creas<strong>in</strong>gly employed <strong>for</strong><br />
crops demand<strong>in</strong>g less water. This must have<br />
a direct repercussion on the <strong>in</strong>tensity of<br />
water use <strong>for</strong> agriculture. A vast pool of the<br />
state’s scarce f<strong>in</strong>ancial resources is be<strong>in</strong>g<br />
used <strong>for</strong> improv<strong>in</strong>g irrigation. It is reported<br />
that the state has already (up to the Tenth<br />
Plan) spent more than Rs 38 billion on<br />
irrigation, flood control, command area<br />
development (CAD) and anti-sea erosion<br />
(GoK 2003; GoK 2007). A large chunk (about<br />
70%) of this sum had been allocated exclusively<br />
to major (with cultivable command<br />
area greater than 10,000 hectares) and<br />
medium (with command area greater<br />
than 2,000 hectares) irrigation systems.<br />
This paper seeks primarily to assess<br />
the water resources of the state and the<br />
total water requirement of crops. It then<br />
exam<strong>in</strong>es critically, with the cont<strong>in</strong>u<strong>in</strong>g<br />
shift of crop area <strong>in</strong> favour of cash crops,<br />
if the strategy of pump<strong>in</strong>g more funds<br />
<strong>in</strong>to the irrigation sector still stands to<br />
reason. The subject of the paper is conf<strong>in</strong>ed<br />
to the water needs of only agriculture.<br />
The paper is organised <strong>in</strong>to four sections.<br />
Section 1 is an appraisal of the water<br />
resources of the state. The cropp<strong>in</strong>g pattern<br />
<strong>in</strong> the state practised over different<br />
periods has been analysed <strong>in</strong> Section 2.<br />
Assessment of the water requirement of<br />
various crops cultivated <strong>in</strong> <strong>Kerala</strong>, across<br />
the Plan periods s<strong>in</strong>ce 1980-81, is made <strong>in</strong><br />
Section 3. Section 4 seeks to ascerta<strong>in</strong>, <strong>in</strong><br />
the light of the changed cropp<strong>in</strong>g pattern,<br />
whether the irrigation <strong>in</strong>frastructure built<br />
up over the years yielded returns, especially<br />
with regard to the f<strong>in</strong>ancial efficiency<br />
parameters. The study relies solely<br />
on secondary data available from various<br />
governmental agencies.<br />
1 Ra<strong>in</strong>fall and <strong>Water</strong> Resources<br />
Ow<strong>in</strong>g to the high precipitation rate <strong>in</strong><br />
<strong>Kerala</strong>, the region has generally been<br />
regarded as water surplus. The para meters<br />
that determ<strong>in</strong>e the availability of water <strong>in</strong><br />
the state are presented <strong>in</strong> Table 1 (p 74).<br />
The total surface and replenishable<br />
groundwater <strong>in</strong> <strong>Kerala</strong> is estimated to be<br />
70,165 million cubic metres (mcm) (GoK<br />
1998; GoK 2007). But only about 60% of it<br />
could be put to beneficial use, as the rest of<br />
the available resources are lost as run-off<br />
caus<strong>in</strong>g heavy floods many a times (GoK<br />
1998; GoK 2001a; GoK 2003). The groundwater<br />
resource available <strong>in</strong> <strong>Kerala</strong> is estimated<br />
at 7,900 mcm (GoK 2005). The per<br />
capita utilisable water availability from both<br />
surface flow and replenishable ground flow<br />
comes to 1,340 m 3 (as on 2001), which is<br />
seen reduced to 1,248 m 3 by 2006. Thus,<br />
the region, accord<strong>in</strong>g to <strong>in</strong>ternational<br />
standards, is under “water stress”.<br />
As per a rough estimate (as of 1974) of<br />
the projected demand <strong>for</strong> water, <strong>Kerala</strong><br />
would require around a total of 49,700 mcm<br />
of water (GoK 1998). Agriculture requires<br />
30,000 mcm and domestic requirements<br />
work out to another 7,500 mcm. <strong>Kerala</strong><br />
Economic & Political Weekly EPW July 24, 2010 vol xlv no 30 73
NOTES<br />
Table 1: <strong>Water</strong> Resources of <strong>Kerala</strong> as Compared to <strong>India</strong><br />
Parameter <strong>Kerala</strong> <strong>India</strong><br />
Geographical area (sq km) 38,864 32,87,732<br />
Population 2001 Census (mn) 31.84 1,028.61<br />
Population 2006 (mn, projected) 34.20 1,094.1<br />
Total ra<strong>in</strong>fall and snowfall (bcm, 2003) 88.45 4,057.35<br />
Surface and replenishable groundwater (or, water potential of river bas<strong>in</strong>s, bcm) 70.17 1,869<br />
<strong>Water</strong> that can be put to beneficial use 42.67 1,122<br />
Of which: surface flow 34.77 690<br />
with its long-coastal belt stretch<strong>in</strong>g to<br />
over 590 km has to spend a significant<br />
proportion of its water resources <strong>for</strong> prevent<strong>in</strong>g<br />
salt water <strong>in</strong>trusion. It is estimated<br />
that this needs another 12,200<br />
mcm. The utilisable water resources as<br />
per the earlier assessment are above<br />
42,000 mcm. The surface water balance<br />
does not, there<strong>for</strong>e, suffice to meet the<br />
demand <strong>for</strong> water <strong>in</strong> <strong>Kerala</strong>.<br />
<strong>Kerala</strong> receives about 3,000 mm of<br />
ra<strong>in</strong>fall annually, which is almost three<br />
times that of <strong>India</strong> (1,170 mm). The 41<br />
west-flow<strong>in</strong>g rivers (of more than 15 km<br />
long) run to a total distance of 3,092 km<br />
across the length and breadth of <strong>Kerala</strong><br />
and each kilometre of these rivers, on an<br />
average, has a gross catchment area of<br />
11.33 km 2 (computed from GoK 2003). The<br />
three other rivers draw from a total catchment<br />
area of another 2,866 sq km of<br />
<strong>Kerala</strong> be<strong>for</strong>e they jo<strong>in</strong> the Cauvery <strong>in</strong> the<br />
east. As per the state public works department<br />
estimates (1974), of the total annual<br />
yield of 77,883 mcm of water flow<strong>in</strong>g<br />
through these 44 rivers 70,165 mcm is<br />
available <strong>in</strong> <strong>Kerala</strong> with only 42,672 mcm<br />
that could be utilisable <strong>in</strong> the state alone<br />
(GoK 2001a).<br />
The crop season-wise average ra<strong>in</strong>fall<br />
experienced <strong>in</strong> the state as well as <strong>in</strong> <strong>India</strong><br />
74<br />
replenishable ground flow 7.90 432<br />
% to total 60.82 60.03<br />
Per capita annual availability of utilisable water (m 3 ) 1,248 1,026<br />
Source: Compiled/computed from GoI 2005; GoK 2003; Tata 2001.<br />
Table 2: Average Seasonal Ra<strong>in</strong>fall (<strong>in</strong> mm) <strong>in</strong> MET<br />
Subdivisions <strong>in</strong> <strong>Kerala</strong> and <strong>India</strong> (Period: 1871-2005)<br />
Season<br />
Seasonal Ra<strong>in</strong>fall (N=135) Monthly Ra<strong>in</strong>fall (mm)<br />
<strong>Kerala</strong> <strong>India</strong> <strong>Kerala</strong> <strong>India</strong><br />
Kharif (May-Oct) 2168 901<br />
Virippu (18) (10) 434 181<br />
Rabi (Nov-Jan) 491 132<br />
Mundakan (30) (26) 123 33<br />
Other (Feb-Apr) 164 54<br />
Punja (42) (29) 55 18<br />
Total 2822 1088 236 91<br />
(14) (9)<br />
Source: <strong>India</strong>n Meteorology Department.<br />
Values with<strong>in</strong> parenthesis are the respective coefficient of<br />
variation (N=135).<br />
Seasons given <strong>in</strong> italics are the season name <strong>in</strong> local language.<br />
as a whole has been computed from the<br />
month-wise data <strong>for</strong> a long period of 135<br />
years (from 1871 to 2005) and is presented<br />
<strong>in</strong> Table 2.<br />
This table shows the richness of <strong>Kerala</strong><br />
<strong>in</strong> ra<strong>in</strong>fall. <strong>Kerala</strong> receives more than<br />
three-fourths of the total annual downpour<br />
dur<strong>in</strong>g virippu/kharif season, which<br />
is, by its quantity, 2.41 times that of <strong>India</strong>.<br />
The mundakan/rabi season, as compared<br />
to the major season kharif, is dry. The variation<br />
of ra<strong>in</strong>fall over the years is larger <strong>in</strong><br />
<strong>Kerala</strong>, with a higher coefficient of variation<br />
(CV) than that of the whole of <strong>India</strong><br />
<strong>for</strong> all the seasons. Over the 135 years <strong>for</strong><br />
which data is available, <strong>Kerala</strong> experienced<br />
normal ra<strong>in</strong>fall (± 10% of the average<br />
of 135 years) <strong>in</strong> only 20 years. <strong>India</strong> as<br />
a whole also had normal ra<strong>in</strong>s <strong>in</strong> about<br />
21 years.<br />
The ra<strong>in</strong>fall diversity has a spatial<br />
dimension as well. Table 3 (p 75) shows<br />
the average monthly ra<strong>in</strong>fall by districts,<br />
dur<strong>in</strong>g the n<strong>in</strong>e years up to 2004. Except<br />
<strong>for</strong> the district of Idukki, all other districts<br />
experienced a lower average ra<strong>in</strong>fall<br />
<strong>in</strong> 1996-2004, when compared with<br />
the normal ra<strong>in</strong>fall figures supplied by the<br />
meteorology centre, Thiruvananthapuram.<br />
The districts of Kozhikode (27%) and<br />
Wayanad (35%) had huge deficits of ra<strong>in</strong>fall<br />
dur<strong>in</strong>g this period. The state, as a<br />
whole, had about 12% less ra<strong>in</strong>fall than<br />
the normal dur<strong>in</strong>g the period. Table 3<br />
demonstrates not only that the ra<strong>in</strong>fall<br />
dur<strong>in</strong>g the period was far short of the<br />
normal, but also that the deviation varied<br />
vastly from region to region and also<br />
from month to month. This calls <strong>for</strong> an<br />
effective conservation of water dur<strong>in</strong>g<br />
the water-plenty days and its judicious<br />
use dur<strong>in</strong>g the dry periods. The construction<br />
of dams would thus be justified.<br />
2 Crops of <strong>Kerala</strong><br />
As already noted, ow<strong>in</strong>g to the location of<br />
<strong>Kerala</strong>, the soil and climatic conditions<br />
are highly suitable <strong>for</strong> a multitude of<br />
crops, that too, round the year. The crops<br />
can atta<strong>in</strong> their full yield potential only<br />
with supply of water <strong>in</strong> addition to what is<br />
rendered by ra<strong>in</strong>fall or a gravity-driven<br />
ra<strong>in</strong>water runoff, as even <strong>in</strong> <strong>Kerala</strong>, <strong>in</strong>tolerably<br />
long dry spells are the norm rather<br />
than the exception <strong>in</strong> all seasons. Even so,<br />
despite the high potency <strong>for</strong> water conservation<br />
(due to high annual ra<strong>in</strong>fall) and<br />
the longer wet spells (than the average<br />
<strong>India</strong>n level) <strong>in</strong> <strong>Kerala</strong>, the area with<br />
irrigation facility still hovers around 14.7%<br />
(2002-03) of the gross cropped area of the<br />
state – a level far below the average <strong>for</strong><br />
<strong>India</strong> (38.7%). The traditional farmers, on<br />
their part, choose the cropp<strong>in</strong>g pattern to<br />
suit the ra<strong>in</strong>fall rhythm experienced dur<strong>in</strong>g<br />
various months of a year.<br />
<strong>Water</strong>-<strong>in</strong>tensive crops enjoy <strong>in</strong>creas<strong>in</strong>gly<br />
less preference <strong>in</strong> <strong>Kerala</strong>. Unlike<br />
other <strong>India</strong>n states, more than 70% of the<br />
total area under cultivation comprises<br />
“orchards” (GoI 2005), which demand<br />
much less water per day of the crop than<br />
that is required by wetland crops like<br />
rice, sugar cane, etc. Many of these crops<br />
flourish well under ra<strong>in</strong>-fed management<br />
itself, though water<strong>in</strong>g them dur<strong>in</strong>g dry<br />
spells of the year would enable them to<br />
atta<strong>in</strong> their potential yield.<br />
The suitability of a crop to a region<br />
depends on various soil and climate<br />
parameters of the region. The regions that<br />
are found to be “most suitable (S1)”, “less<br />
suitable (S2)” and “least suitable (S3)” <strong>for</strong><br />
cultivation of each of the major crops separately<br />
are reported to have been identified<br />
based on the parameters of the region,<br />
namely, elevation, ra<strong>in</strong>fall, temperature,<br />
humidity, physiography, slope, soil depth,<br />
soil texture, presence of stones and rocks<br />
and soil dra<strong>in</strong>age. These variables are<br />
very crucial <strong>in</strong> determ<strong>in</strong><strong>in</strong>g the irrigation<br />
needs of crops as well. The yield potential<br />
of the crops <strong>in</strong> respect of these suitability<br />
regions are also seen estimated, as a “first<br />
approximation” (KSLUB 1997). These are<br />
given <strong>in</strong> Table 4 (p 75).<br />
Table 4 shows the potential of agriculture<br />
<strong>in</strong> <strong>Kerala</strong>. More than half of the current<br />
gross cropped area is classified as highly<br />
suitable <strong>for</strong> crop growth. The yield levels<br />
July 24, 2010 vol xlv no 30 EPW Economic & Political Weekly
Table 3: Spatial and Temporal Distribution of Ra<strong>in</strong>fall (mm) <strong>in</strong> <strong>Kerala</strong> – Average of 1996-2004<br />
NOTES<br />
District January February March April May June July August September October November December Total Normal Deviation from<br />
Normal<br />
Thiruvananthapuram 10 28 25 122 196 281 182 154 204 341 183 56 1,782 2,204 -20.46<br />
Kollam 11 47 47 161 255 391 310 274 219 476 170 58 2,419 2,555 -6.65<br />
Alappuzha 21 51 60 175 291 504 416 342 270 431 175 47 2,783 2,965 -7.62<br />
Pathanamthitta 20 43 43 156 300 552 445 362 273 428 165 53 2,840 3,134 -10.63<br />
Kottayam 15 27 62 143 284 555 493 387 279 426 151 51 2,873 3,130 -9.27<br />
Idukki 5 28 47 158 287 695 786 631 332 472 179 52 3,672 3,379 7.84<br />
Ernakulam 8 25 24 107 321 662 610 432 298 430 159 54 3,130 3,274 -4.73<br />
Thrissur 0 21 8 66 237 646 579 393 247 368 91 25 2,681 3,262 -17.14<br />
Palakkad 1 16 24 79 153 445 457 310 144 279 118 22 2,048 2,390 -15.19<br />
Kozhikode 2 8 14 74 237 743 664 396 198 322 91 29 2,778 3,668 -27.29<br />
Malappuram 3 8 13 80 271 713 613 386 204 366 132 37 2,826 2,906 -2.65<br />
Wayanad 6 12 28 102 161 522 570 418 153 249 96 37 2,354 3,591 -35.14<br />
Kannur 4 1 4 47 253 927 816 532 172 338 92 36 3,222 3,465 -7.36<br />
Kasaragod 4 0 3 35 300 1,023 874 563 176 312 58 23 3,371 3,581 -6.42<br />
Mean 8 23 29 108 253 619 558 399 226 374 133 41 2,770 3,108 -11.74<br />
Normal 15 17 40 113 263 697 765 439 252 297 166 43<br />
Deviation -45 39 -27 -5 -4 -11 -27 -9 -10 26 -20 -5<br />
Subdiv normal 11 17 35 112 244 687 636 377 224 286 156 37 2,822<br />
Source: Compiled/computed from GoK, Statistics <strong>for</strong> Plann<strong>in</strong>g, various issues.<br />
of the crops <strong>in</strong> 2005-06 are also shown.<br />
It can be discerned that the yield levels <strong>in</strong><br />
<strong>Kerala</strong> are very low, except <strong>for</strong> a couple of<br />
crops, even with regard to the national<br />
standards. While the yield of coconuts <strong>in</strong><br />
Andhra Pradesh (<strong>in</strong> 2005-06) was 8,577<br />
nuts and <strong>in</strong> Tamil Nadu 13,133, the yield <strong>in</strong><br />
<strong>Kerala</strong> was as low as 7,046 nuts, aga<strong>in</strong>st<br />
the national average of 7,608 and the<br />
highest yield<strong>in</strong>g state (Maharashtra) with<br />
15,189 nuts. 1<br />
The yield of rice <strong>in</strong> <strong>Kerala</strong>, though<br />
slightly better than that of average <strong>India</strong>n<br />
level (2.047 tonnes), has been stagnant<br />
and is range-bound <strong>for</strong> some years now<br />
(GoK 2007a). The only crop that is seen<br />
steadily improv<strong>in</strong>g its per<strong>for</strong>mance is<br />
rubber. 2 Table 4 also provides the yield<br />
potential of crops under the three cropsuitability<br />
regimes. These estimates are<br />
perceived, as noted above, as approximates<br />
projected with reference to given<br />
and limited <strong>in</strong><strong>for</strong>mation available. But<br />
these estimates categorically assert that<br />
the yield per<strong>for</strong>mance, barr<strong>in</strong>g a few<br />
crops like rubber, tapioca and arecanut,<br />
are stagger<strong>in</strong>gly low.<br />
Given the suitability conditions prevail<strong>in</strong>g<br />
<strong>in</strong> the state <strong>for</strong> almost all these crops,<br />
an urgent evaluation of the factors that<br />
hampered the yield growth <strong>in</strong> <strong>Kerala</strong> is<br />
called <strong>for</strong>.<br />
In this paper, we address the issues<br />
related to irrigation of crops <strong>in</strong> <strong>Kerala</strong>.<br />
The “water use efficiency” (WUE) of a crop<br />
which is def<strong>in</strong>ed as the ratio of the yield<br />
(kg/ha) and water requirement (mm) of<br />
the crop is also computed and presented <strong>in</strong><br />
Table 7 (p 77). Interest<strong>in</strong>gly, the tapioca,<br />
with WUE of 56.73 kg/ha mm is found to<br />
be the most water-efficient crop <strong>in</strong> <strong>Kerala</strong>,<br />
followed by p<strong>in</strong>eapple (9.54 kg/ha mm)<br />
and banana (6.68 kg/ha mm). The spice<br />
crops like cardamom (0.19 kg/ha mm) and<br />
coffee (0.59 kg/ha mm), <strong>for</strong> which the economic<br />
part constitutes only a very small<br />
proportion of the total biological yield –<br />
naturally turned out to be the least waterefficient<br />
crops <strong>in</strong> the state.<br />
Table 4: Area and Yield Potential of Crops under Different Suitability Regimes<br />
Area (ha) Suitable under Current Yield Potential (Tonnes/ha) <strong>Water</strong> Use Efficiency 2005-06<br />
(2005-06) Yield (kg/ha as a Ratio of<br />
Tonnes/ha<br />
mm of <strong>Water</strong>)$<br />
Crop S1 S2 Total S1 S2 S3 m<strong>in</strong> max<br />
Rice 1,25,496 2,76,742 4,02,238 2.285 6 4.5 3 1.43 2.29<br />
Pepper 1,22,140 94,552 2,16,692 0.368 1.2 0.9 0.6 0.31 0.74<br />
G<strong>in</strong>ger 14,567 11,395 25,962 4.604 20 15 10 3.84 6.58<br />
Cardamom 78,325 39,483 1,17,808 0.236 0.5 0.35 0.3 0.13 0.19<br />
Banana 1,26,325 30,835 1,57,160 8.010 40 30 20 3.64 6.68<br />
Cashew 71,131 53,969 1,25,100 0.872 1.2 0.9 0.5 0.73 0.97<br />
P<strong>in</strong>eapple 23,950 7,420 31,370 6.681 60 45 30 6.68 9.54<br />
Tapioca 1,53,755 1,11,630 2,65,385 28.367 35 25 17.5 40.52 56.73<br />
Vegetable 24,158 2,196 26,354 – – – – --<br />
Coconut 3,68,230 5,72,230 9,40,460 7,046 14,000 10,500 7,000 – --<br />
Tea 51,860 25,430 77,290 1.609 2 1.5 1 0.89 1.29<br />
Coffee 73,050 4,215 77,625 0.711 0.8 0.6 0.4 0.40 0.57<br />
Rubber 3,23,141 1,05,047 4,28,188 1.495 1.5 1.25 0.75 0.83 1.20<br />
Arecanut (not available) 1.099 1 0.75 0.5 0.61 0.88<br />
Total 15,56,128 13,35,144 28,91,272<br />
At the outset, let us exam<strong>in</strong>e the effectiveness<br />
of irrigation of crops, as evident<br />
from the secondary data available. Trend<br />
data on yield <strong>for</strong> the irrigated and unirrigated<br />
crop is available <strong>for</strong> paddy. We have,<br />
there<strong>for</strong>e, analysed the yield of paddy <strong>in</strong><br />
<strong>Kerala</strong> under irrigated and non-irrigated<br />
conditions to ascerta<strong>in</strong> the relative yield<br />
efficiency of irrigation. The season wise<br />
data of paddy yield correspond<strong>in</strong>g to the<br />
10 years up to 2005-06 is used <strong>for</strong> this<br />
analysis (source of data: GoK 2007). Twofactor<br />
analysis of variance was done on the<br />
data. As the yield per<strong>for</strong>mance <strong>in</strong> a season<br />
% to GCA (2005-06) 52 45 97<br />
Coconut yield is <strong>in</strong> number of nuts per ha.<br />
$: Computed by author. M<strong>in</strong>imum value corresponds to upper limit of water requirement of the crop and the m<strong>in</strong>imum value to the lower limit.<br />
Source: Compiled from KSLUB 1997. Data on productivity: Economic Review, 2007.<br />
Economic & Political Weekly EPW July 24, 2010 vol xlv no 30 75
NOTES<br />
cannot be considered <strong>in</strong>dependent of the<br />
previous season’s per<strong>for</strong>mance, the Analysis<br />
of Varience, ANOVA, <strong>in</strong> split-plot fashion<br />
is attempted, with season <strong>in</strong> the sub-plot<br />
(Gomez and Gomez 1984), follow<strong>in</strong>g the<br />
l<strong>in</strong>ear fixed effect model <strong>for</strong> ANOVA (Das<br />
and Giri 2003):<br />
y ijk<br />
= m + a i<br />
+ b j<br />
+d ij<br />
+ e ijk<br />
, with e ijk<br />
~<br />
N(0, s 2 ); where,<br />
p = number of irrigation status (here,<br />
“irrigated” and “un-irrigated”),<br />
q = number of seasons (sub-plots),<br />
r = number of years (replicates), and<br />
i = 1,2, … , p; j = 1,2, … , q; k = 1,2, … , r<br />
m = general mean, a i<br />
= effect due to ith<br />
level of “irrigation status”, b j<br />
= effect due<br />
to jth season, d ij<br />
= <strong>in</strong>teraction between ith<br />
level of irrigation status and jth level of<br />
season, and e ijk<br />
= second error term. The<br />
two seasons <strong>for</strong> the same irrigation status<br />
(sub-plot <strong>in</strong> the same ma<strong>in</strong> plot) be<strong>in</strong>g correlated,<br />
say with a coefficient r, they are<br />
related with E (e ijk,<br />
e ij’k<br />
) = rs 2 .<br />
The results are presented <strong>in</strong> Table 5.<br />
Table 5: Mean Paddy Yield (Kg ha –1 ) under Irrigated and<br />
Unirrigated Conditions (10-Years Till 2005-06),<br />
by Seasons<br />
The table shows that irrigation has a<br />
great effect on enhanc<strong>in</strong>g the yield levels<br />
(F = 17.81, p < .01). <strong>Irrigation</strong> pushed up<br />
the yield by about one-sixth (about 500 kg<br />
per hectare) of that of the unirrigated<br />
level. The effect of irrigation was visible,<br />
irrespective of the seasons. Irrigat<strong>in</strong>g <strong>in</strong><br />
summer, fetches the highest marg<strong>in</strong>al yield<br />
though summer paddy <strong>in</strong> <strong>Kerala</strong> extends to<br />
less than 30% of the acreage of that <strong>in</strong> the<br />
w<strong>in</strong>ter. Summer is the best yield<strong>in</strong>g season<br />
<strong>for</strong> paddy and w<strong>in</strong>ter yields the least. Note<br />
that the kharif season is the wettest season<br />
<strong>in</strong> <strong>Kerala</strong>, both <strong>in</strong> quantity of ra<strong>in</strong>fall and <strong>in</strong><br />
the number of ra<strong>in</strong>y days, with more than<br />
half the days turn<strong>in</strong>g out to be wet. 3<br />
The spatial extent of occupation of the<br />
crops and area under irrigation of major<br />
crops of <strong>Kerala</strong> are furnished <strong>in</strong> Table 6.<br />
To gauge the shift <strong>in</strong> cropp<strong>in</strong>g pattern,<br />
the area growth and the share of these<br />
crops <strong>in</strong> the gross cropped area (GCA)<br />
76<br />
Autumn W<strong>in</strong>ter Summer Mean<br />
Irrigated 3,508.7 3,241.1 3,748.9 3,499.6<br />
Unirrigated 3,036.8 2,864.2 3,163.2 3,021.4<br />
Mean 3,272.8 3,052.7 3,456.1<br />
F 1,18<br />
<strong>for</strong> <strong>Irrigation</strong> (I) = 17.81**; F 2,36<br />
<strong>for</strong> Season (S)= 6.10 **<br />
F 2,36<br />
IxS = 0.04<br />
CD (.05)<br />
<strong>Irrigation</strong> = 238.03; Season = 231.00<br />
Source of data: GoK 2007.<br />
correspond<strong>in</strong>g <strong>in</strong> 1980-81 and 2005-06<br />
are also given <strong>in</strong> the table. <strong>Kerala</strong> utilises<br />
about four-fifths of its non-<strong>for</strong>est area <strong>for</strong><br />
cultivation. The strik<strong>in</strong>g feature of the<br />
trend <strong>in</strong> cropp<strong>in</strong>g pattern (dur<strong>in</strong>g the<br />
period 1990-91 to 2005-06) was that while<br />
some crops lost heavily <strong>in</strong> area, some<br />
other crops still managed to improve their<br />
acreage considerably. Dur<strong>in</strong>g the 15 years,<br />
paddy lost its area at an annual exponential<br />
rate of 5.21%. Area shr<strong>in</strong>kage was<br />
rapid <strong>for</strong> g<strong>in</strong>ger (-3.26%) and tapioca<br />
(-2.81%) also. Tapioca and g<strong>in</strong>ger are<br />
crops of high WUE. Paddy was the crop<br />
that suffered the most. This table also<br />
reveals that <strong>Kerala</strong> has experienced major<br />
shifts <strong>in</strong> its cropp<strong>in</strong>g pattern. A shift from<br />
foodgra<strong>in</strong>s to certa<strong>in</strong> plantation crops<br />
notably rubber, arecanut and banana is<br />
conspicuous. Tapioca be<strong>in</strong>g the crop of<br />
highest WUE, a crop that almost matches<br />
its potential yield level and a crop that<br />
proved to be a crop-<strong>in</strong>-need, especially <strong>for</strong><br />
the poor when they struggled to meet<br />
their energy requirements at times of<br />
price escalation <strong>for</strong> foodgra<strong>in</strong>s, this debacle<br />
of tapioca would spell disaster <strong>for</strong> a<br />
state like <strong>Kerala</strong>, which is perhaps the<br />
highest food <strong>in</strong>secure state <strong>in</strong> <strong>India</strong>.<br />
The crop which claimed 8.49% of GCA<br />
<strong>in</strong> 1980-81 was prevail<strong>in</strong>g only <strong>in</strong> 3.13% of<br />
the GCA <strong>in</strong> 2005-06. G<strong>in</strong>ger, cardamom,<br />
cashew, etc, had experienced a slump <strong>in</strong><br />
acreage and share <strong>in</strong> GCA. However,<br />
Table 6: Area (ha) under Crops and Area Irrigated@<br />
banana, coconut and cash crops like tea,<br />
coffee and rubber took no retreat <strong>in</strong> their<br />
acreage over the period. Rubber, which<br />
takes a tally of 16.27% of GCA <strong>in</strong> 2005-06,<br />
had a share of only 7.16% <strong>in</strong> 1980-81.<br />
Similarly, area under banana (4.35%<br />
of GCA) and arecanut (3.63% of GCA)<br />
expanded substantially dur<strong>in</strong>g the period.<br />
With practically no growth <strong>in</strong> GCA <strong>in</strong><br />
<strong>Kerala</strong>, it follows that the ga<strong>in</strong> <strong>in</strong> acreage<br />
under one crop should be at the expense<br />
of other crops. There are already reports<br />
that some crops ga<strong>in</strong>ed <strong>in</strong> area <strong>in</strong> <strong>Kerala</strong><br />
really at the expense of cereals or cerealsubstitute<br />
crops (Lathika et al 2004;<br />
Jeromi 2007), mak<strong>in</strong>g the already fragile<br />
food security system of the state more<br />
vulnerable. The table also shows that the<br />
utilisation of irrigation facilities also varied<br />
widely across crops, both <strong>in</strong> area irrigated<br />
as percentage of crop area and the crop<br />
area irrigated as percentage of gross area<br />
irrigated <strong>in</strong> the state. Though paddy occupied<br />
only about 9% of the GCA (as of<br />
2005-06) of the state, it claimed about<br />
37.12% of the total area irrigated. As<br />
paddy is a highly water-demand<strong>in</strong>g crop,<br />
it is natural that the larger area (about<br />
60%) of the crop could be brought under<br />
irrigation. Coconut which claims 30%<br />
stake <strong>in</strong> the GCA of the state, occupied 33%<br />
of the total irrigated area of the state.<br />
Thus these two crops appropriate about<br />
70% of the total irrigation. This seems<br />
Crop Crop Area (ha) Crop Area as % of GCA Exponential Growth Crop Area (ha) Area Irrigated Crop Area<br />
5-Year Average of Area (from Irrigated (5-Years as % of Crop Area Irrigated as<br />
2005-06 1980-81 2005-06 1990-01 to 2005-06) End<strong>in</strong>g 2005-06) (5-Year Average % of Gross<br />
Till 2005-06) Area Irrigated<br />
(NSA) 21,68,196 75.56 72.57 -0.33 – – –<br />
Paddy 2,97,187.6 27.79 9.08 -5.21 1,78,716.6 57.90 37.12<br />
Pepper 2,15,698.8 3.75 7.92 1.69<br />
G<strong>in</strong>ger 9,499.2 0.44 0.31 -3.26<br />
Cardamom 40,798.2 1.87 1.28 -1.57<br />
Banana 1,11,144.2 1.71 3.87 4.35 28,473.8 25.56 5.91<br />
Cashew 86,293.8 4.90 2.66 -2.19<br />
Tapioca 98,626.6 8.49 3.13 -2.81 1,631 1.65 0.34<br />
Coconut 9,00,223.4 24.02 29.62 0.23 1,57,424.6 17.38 32.7<br />
Arecanut 99,789.8 2.12 3.56 3.63 33,927.6 33.33 7.05<br />
Tea 36,855.4 1.31 1.15 0.52<br />
Coffee 84,375.2 1.45 2.79 0.36<br />
Rubber 4,80,885.6 7.16 16.27 1.00 40,121.5 8.34 8.33<br />
Vegetables 52,502 0.51 1.56 0.25 13,400.2 19.32 2.78<br />
(Others) 4,73,879.6 14.35 16.81 1.40 27,729.6 8.33 5.76<br />
(GCA) 29,87,759 100 100 -0.12 4,81,424.9 16.03 100<br />
@ Some cells <strong>in</strong> the table are left blank as the respective data is seen miss<strong>in</strong>g <strong>in</strong> the departmental publications, possibly because<br />
the values are negligible. However, others would <strong>in</strong>clude these also. Two major crops that miss the table are mango and p<strong>in</strong>eapple<br />
which occupy about 2.9% and 0.4% of GCA, respectively.<br />
Source: GoK 2005, Statistics <strong>for</strong> Plann<strong>in</strong>g 2005, Department of Economics and Statistics.<br />
GoK (2007), Economic Review (various years). State Plann<strong>in</strong>g Board.<br />
July 24, 2010 vol xlv no 30 EPW Economic & Political Weekly
quite puzzl<strong>in</strong>g <strong>for</strong> many reasons. In <strong>Kerala</strong>,<br />
homesteads are the most prevalent <strong>for</strong>m of<br />
garden-land use, where the households are<br />
surrounded by a multitude of crops of<br />
diverse utility and economic value <strong>in</strong>terspersed<br />
without follow<strong>in</strong>g any crop geometry<br />
of sorts. When an irrigation facility<br />
reaches the area of the homestead, it is<br />
well nigh impossible that the facility is<br />
used only by one or two crops <strong>in</strong> the mix. 4<br />
It might be that the irrigation status of only<br />
these limited crops is be<strong>in</strong>g reported. This<br />
calls <strong>for</strong> a thorough re-estimation of the<br />
total area really brought under irrigation,<br />
under all crops. For a real evaluation of the<br />
irrigation projects <strong>in</strong> <strong>Kerala</strong> this deems<br />
highly <strong>in</strong>evitable. This might also be a limitation<br />
of this study.<br />
3 <strong>Water</strong> Requirement of Crops<br />
<strong>Water</strong> plays an important role <strong>in</strong> all plant<br />
func tions, the ma<strong>in</strong> be<strong>in</strong>g the photosynthetic<br />
activity – the process of us<strong>in</strong>g solar energy<br />
that is absorbed by the chlorophyll of<br />
plant leaves to generate carbohydrates<br />
and sugars <strong>for</strong> its own consumption by<br />
splitt<strong>in</strong>g water <strong>in</strong>to hydrogen and oxygen.<br />
The net-assimilates <strong>in</strong> the plants are<br />
free <strong>for</strong> consumption by the higher species.<br />
Agriculture is all about optimis<strong>in</strong>g the<br />
quantity and quality of these balance<br />
assimilates of plants to suit the need<br />
regime of the respective farmers. The<br />
total quantity of water that is needed by<br />
the plants <strong>for</strong> its growth and other functions<br />
and the water that is wasted through<br />
evaporation from around the plant constitute<br />
what is called the Consumptive Use<br />
(Cu) of the plant. As the metabolic process<br />
needs very little water (less than 1% of the<br />
whole water that is passed through it), the<br />
other two water needs, namely, evaporation<br />
and transpiration – jo<strong>in</strong>tly called evapotranspiration<br />
(ET) – amount almost fully<br />
to the total requirement of water by the<br />
plant. Though consumptive use covers<br />
exclusive needs <strong>for</strong> the crop growth, some<br />
field operations like land preparation and<br />
desal<strong>in</strong>ation also demand water. The total<br />
volume of water that is required at the<br />
field level must account <strong>for</strong> the application<br />
losses also (ICAR 1987; Reddi and Reddy<br />
2006). Application losses vary between<br />
types of irrigation and texture and structure<br />
of soil. The total annual water<br />
requirement of various crops <strong>in</strong> <strong>Kerala</strong> has<br />
been computed us<strong>in</strong>g the “per hectare<br />
water requirement” values collected from<br />
literature. Some assumptions and approximation<br />
are made <strong>for</strong> the purpose, which<br />
are listed under the respective table. As<br />
only the range of water requirement is<br />
available <strong>in</strong> the literature, consider<strong>in</strong>g the<br />
wide spectrum of situations that are applicable<br />
to <strong>Kerala</strong> conditions <strong>for</strong> the crops,<br />
we have adopted both the limits (lower<br />
and upper) of the quantity of water per<br />
hectare that is required, <strong>for</strong> computation<br />
of the total water need <strong>for</strong> agriculture.<br />
Table 7 provides the quantity of water<br />
requirement <strong>for</strong> various crops at the <strong>in</strong>itial<br />
year of all five-year plans s<strong>in</strong>ce 1980-81.<br />
The most strik<strong>in</strong>g feature of the results is<br />
that while paddy which needed more than<br />
28% of the m<strong>in</strong>imum total water requirement<br />
dur<strong>in</strong>g 1980-81, the need <strong>for</strong> it <strong>in</strong><br />
2005-06 was only 8.83% of the m<strong>in</strong>imum<br />
total water requirement <strong>for</strong> the whole<br />
gross area under cultivation <strong>in</strong> <strong>Kerala</strong>. It<br />
may be noted that the area under paddy –<br />
the crop that demanded maximum water<br />
<strong>for</strong> its growth and is sensitive to water<br />
stress – is still on the decl<strong>in</strong>e. On the other<br />
hand, water requirement of coconut and<br />
almost all cash crops recorded a sharp<br />
rise. The water demand <strong>for</strong> banana and<br />
vegetables also shot up tremendously.<br />
NOTES<br />
Note that requirement <strong>in</strong>creases <strong>in</strong> proportion<br />
to area and the economic net<br />
returns of a few crops like rubber is almost<br />
<strong>in</strong>elastic to irrigation. But s<strong>in</strong>ce <strong>in</strong> <strong>Kerala</strong>,<br />
crop shifts are largely <strong>in</strong> favour of cash crops<br />
which demand less quantity of water than<br />
that demanded by water- <strong>in</strong>tensive crops<br />
like paddy, and s<strong>in</strong>ce most of the farmers<br />
of cash crops are still <strong>in</strong> the habit of us<strong>in</strong>g<br />
the monsoon ra<strong>in</strong>fall, the real use of the<br />
costly irrigation water might have come<br />
down considerably. This calls <strong>for</strong> a serious<br />
reth<strong>in</strong>k of expenditure on irrigation systems<br />
<strong>in</strong> <strong>Kerala</strong> over the years.<br />
4 <strong>Irrigation</strong> Infrastructure and<br />
Economic Efficiency<br />
Table 8 (p 78) provides the public expenditure<br />
at current prices on both types of irrigation<br />
– major and m<strong>in</strong>or – and other public<br />
demands of water like anti-sea erosion,<br />
CAD, etc. <strong>Irrigation</strong> systems received very<br />
little of public money till 1980. Start<strong>in</strong>g<br />
from a meagre amount of Rs 51 million <strong>in</strong><br />
the First Five-Year Plan, it skyrocketed to<br />
Rs 3,020 million <strong>in</strong> the Sixth Plan. The<br />
Sixth Plan envisaged some major projects<br />
like Meenachil, Vamanapuram, Kakkadavu,<br />
Chaliar, etc, with an orig<strong>in</strong>al estimate of<br />
Rs 350 million, Rs 198.2 million, Rs 133.5<br />
million and Rs 106.1 million, respectively.<br />
Table 7: Range of <strong>Water</strong> Requirement (Million M 3 ) of Crops <strong>in</strong> <strong>Kerala</strong> Per Season <strong>in</strong> the Initial Year of Various Plan<br />
Periods, by Crops<br />
Crop <strong>Water</strong> Requirement Range of Total Annual <strong>Water</strong> Requirement <strong>in</strong> the State (Million M 3 ) <strong>in</strong> the Year<br />
(mm) $ 1980-81 1985-86 1992-93 1997-98 2005-06<br />
Paddy a 1,000-1,600 8,017-12,827 6,783-10,852 5,413-8,661 4,308-6,893 2,757-4,412<br />
Pepper b 500-1,200 540-1,297 608-1,459 891-2,138 902-2,164 1,203-2,887<br />
G<strong>in</strong>ger b 500-700 63-69 78-110 77-108 62-86 46-65<br />
Cardamom 1,250-1,800 676-973 758-1,091 546-786 511-736 486-700<br />
Banana and<br />
other planta<strong>in</strong>s 1,200-2,200 591-1,084 636-1,166 781-1,432 968-1,774 1,411-2,587<br />
Cashew b 900-1,200 1,271-1,695 1,240-1,653 1,009-1,345 852-1,136 727-969<br />
P<strong>in</strong>eapple 700-1,000 35-46 40-53 44-58 82-109 115-153<br />
Tapioca b 500-700 1,225-1,715 1,015-1,420 709-993 607-850 475-665<br />
Vegetable c 500-700 73-103 143-201 247-346 188-264 236-331<br />
Coconut d 1,250-1,800 8,662-12,473 8,809-12,684 10,788-15,535 11,054-15,918 11,249-16,199<br />
Tea d 1,250-1,800 471-679 435-626 433-623 433-623 438-631<br />
Coffee d 1,250-1,800 522-752 821-1,182 1,050-1,512 1,038-1,494 1,058-1,524<br />
Rubber d 1,250-1,800 2,584-3,720 4,129-5,946 5,322-7,664 5,816-8,375 6,180-8,899<br />
Arecanut 1,250-1,800 766-1,102 734-1,056 793-1,142 917-1,320 1,353-1,948<br />
(Others) e 700-1,000 2,897-4,139 2,587-3,696 2,057-2,938 2,386-3,409 3,485-4,978<br />
(All crops) 28,393-42,694 28,816-43,195 30,160-45,281 31,069-46,504 31,219-46,948<br />
$: Compiled from various technical sources. Certa<strong>in</strong> modifications made to suit <strong>Kerala</strong> conditions, <strong>in</strong> consultation with irrigation experts.<br />
a: For paddy, special needs on account of nursery and puddl<strong>in</strong>g/transplant<strong>in</strong>g are also accounted.<br />
For other crops, apart from ET values, 75 mm required <strong>for</strong> pre-sow<strong>in</strong>g irrigation (medium soils).<br />
b: As the water requirement of these crops was not directly available from data , the quantity required <strong>for</strong> related crops (<strong>in</strong> terms<br />
of the relevant parameters) is substituted.<br />
c: <strong>Water</strong> requirement values of tomato, br<strong>in</strong>jal and bh<strong>in</strong>di assumed <strong>for</strong> this. Area data was not available <strong>for</strong> a couple of years; it<br />
would thus figure <strong>in</strong> only under “others”.<br />
d: Values of plantation crops, as given <strong>in</strong> Reddi and Reddy 2006 are used.<br />
e: <strong>Water</strong> requirement is assumed as applicable <strong>for</strong> a moderately water-demand<strong>in</strong>g crop.<br />
Source: Computed from data of area from GoK, Statistics <strong>for</strong> Plann<strong>in</strong>g, various years.<br />
GoK, Economic Review, various years.<br />
Economic & Political Weekly EPW July 24, 2010 vol xlv no 30 77
NOTES<br />
Table 8: Expenditure Incurred on <strong>Irrigation</strong> and Allied Sectors dur<strong>in</strong>g Various Five-Year Plans (<strong>in</strong> Rs Million)<br />
Plan Expenditure at Current Prices Total <strong>Irrigation</strong> % of Expenditure of<br />
<strong>Irrigation</strong> Projects Total <strong>Irrigation</strong> Projects <strong>India</strong> (1993-94 Prices)<br />
Major and Medium M<strong>in</strong>or-SWD M<strong>in</strong>or-GWD Flood Control Anti-Sea Erosion CAD Projects (at 1993-94 Prices)<br />
I (1951-56) 51.1 – – – – – 51.1 791.13 1.16<br />
II (1956-61) 89.24 22.62 – – 18.94 – 111.86 1,553.59 2.07<br />
III (1961-66) 103.1 56.47 – 6.3 45.7 – 159.57 1,817.36 1.57<br />
Annual Plans (1966-69) 101.5 65.3 – 10.98 12.37 – 166.8 1,309.9 1.69<br />
IV (1969-74) 289.2 112.2 1.08 15.8 54.01 – 402.48 2,521.78 1.67<br />
V (1974-78) 751.3 126.67 7.34 22.83 45.41 – 885.31 3,478.61 2.16<br />
Annual Plans (1978-80) 723.5 105.53 5.25 31.3 36.91 – 834.28 2,886.78 2.55<br />
VI (1980-85) 2,620.7 340.9 58.44 53.08 126.03 8.36 3,020.04 7,102.64 2.63<br />
VII (1985-90) 3,019 357.22 89.08 81.32 98.23 147.58 3,465.3 5,921.55 1.93<br />
Annual Plans (1990-92) 1,345.9 283.97 66.15 61.29 95.31 151.05 1,696.02 2,157.17 1.64<br />
VIII (1992-97) 5,869.3 1286.49 313.99 406.01 725.94 477.8 7,469.77 6,745.32 2.33<br />
IX (1997-02) 7,033 2258 328.92 338.42 500.89 328.06 9,619.92 6,536.74 1.58<br />
X (2002-07) 6,000 2050 – 500 – 8,050.0<br />
Total (Up to X Plan) 27,996.84 5,220.36 870.25 2,837.06 1112.8 34,087.46<br />
Source: GoK. Steer<strong>in</strong>g Committee reports on water resources, 1998 and 2003; CWC 2006.<br />
SWD: surface water development, GWD: groundwater development.<br />
The Eighth Plan witnessed a major revision<br />
of cost estimates of pend<strong>in</strong>g projects.<br />
Kallada project started with an orig<strong>in</strong>al<br />
estimate of Rs 132.8 million <strong>in</strong> 1961. This<br />
rema<strong>in</strong>s still an unf<strong>in</strong>ished project. But,<br />
till the end of the Eighth Plan this project<br />
had taken a huge sum of Rs 5,051.5 million<br />
(about 40 times as that of the orig<strong>in</strong>al estimate).<br />
It envisaged a net command area of<br />
61,630 ha and a gross command area of<br />
92,800 ha (GOK 2003). But the actual area<br />
realised is still <strong>in</strong> question. Chaliar project<br />
cost was later revised to 6,450 million.<br />
Such unduly delayed projects not only put<br />
a heavy f<strong>in</strong>ancial stress on the exchequer,<br />
but also cast a shadow on the efficacy of<br />
the already built-up component of the<br />
project as it rema<strong>in</strong>s unutilised. Till date,<br />
the total expenditure <strong>for</strong> irrigation, flood<br />
control and anti-sea erosion works and <strong>for</strong><br />
CAD, comes to more than Rs 38,000 million<br />
and the major and medium projects<br />
alone appropriated about three-fourths of<br />
it. Yet, the m<strong>in</strong>or irrigation projects could<br />
achieve a comparable irrigation level. Up<br />
to the fourth year of 10th Five-Year Plan<br />
(that is, as on 2006), 47% of the total<br />
achieved irrigation <strong>in</strong> the state was solely<br />
from the m<strong>in</strong>or irrigation projects (GoK<br />
2007). However, the real cost <strong>in</strong>curred<br />
will be a more useful measure to compare<br />
the cost <strong>in</strong>crease across various plans.<br />
The table furnishes the cost at 1993-94<br />
prices also. It could be seen that only onethird<br />
of the total cost <strong>in</strong>curred up to<br />
March 2002 (worked out to about<br />
Rs 43,000 million on irrigation projects<br />
alone) was spent dur<strong>in</strong>g the first half of<br />
78<br />
the study period (from 1951-52 up to 1978-<br />
80). There has been a steady growth <strong>in</strong><br />
expenditure on irrigation projects ever<br />
s<strong>in</strong>ce. Dur<strong>in</strong>g the 10 years s<strong>in</strong>ce 1992-93,<br />
about one-third of the total cost was spent.<br />
But the period s<strong>in</strong>ce 1992-93 saw a steep<br />
fall <strong>in</strong> the area under the most waterdemand<strong>in</strong>g<br />
crop, namely, paddy and a<br />
slight decl<strong>in</strong>e (-0.33%) <strong>in</strong> the net sown<br />
area (NSA) (Table 6). However, the<br />
expenditure by both the central and state<br />
governments on irrigation as a share of<br />
total plan outlay is reportedly on the<br />
decl<strong>in</strong>e (GoK 2007) over successive plans.<br />
Thus, this table br<strong>in</strong>gs two po<strong>in</strong>ts to the<br />
<strong>for</strong>e. One, m<strong>in</strong>or irrigation projects<br />
received a much smaller share of the pie<br />
though their achievement levels were<br />
comparable with that of the major and<br />
medium projects, and two, the expenditure<br />
pattern saw a sudden surge upward<br />
<strong>in</strong> the post-1980 phase of growth, dur<strong>in</strong>g<br />
which the cropp<strong>in</strong>g pattern <strong>in</strong> the state<br />
took a tilt towards plantation/cash crops<br />
that demand very less water compared to<br />
water-<strong>in</strong>tensive food crops like paddy.<br />
In this context, the f<strong>in</strong>ancial efficiency<br />
of irrigation projects <strong>in</strong> <strong>Kerala</strong> could be a<br />
very relevant issue that should be exam<strong>in</strong>ed.<br />
The salient <strong>in</strong><strong>for</strong>mation regard<strong>in</strong>g<br />
the efficiency of irrigation projects <strong>in</strong><br />
<strong>Kerala</strong>, as compiled from the Central<br />
<strong>Water</strong> Commission publication (2005), is<br />
given <strong>in</strong> Table 9 (p 79).<br />
Certa<strong>in</strong> other parameters which are<br />
computed from this data are also furnished.<br />
For a comparison, the data related<br />
to <strong>India</strong> is also provided. It could be seen<br />
from Table 9 that the potential created up<br />
to the end of the N<strong>in</strong>th Plan was substantial<br />
both <strong>in</strong> respect of the major projects<br />
and the m<strong>in</strong>or projects. Till this period,<br />
55.60% of the ultimate potential has been<br />
utilised by major and medium projects <strong>in</strong><br />
<strong>Kerala</strong>. This is largely comparable with<br />
that of <strong>India</strong> (53.04%).<br />
But the potential created and utilised<br />
by m<strong>in</strong>or projects, which is below 40% of<br />
the ultimate potential, is strik<strong>in</strong>gly lower<br />
than that of <strong>India</strong>. The area created and<br />
utilised (<strong>in</strong> hectares) is higher <strong>for</strong> m<strong>in</strong>or<br />
projects <strong>in</strong> <strong>Kerala</strong>, as it is so <strong>for</strong> <strong>India</strong> as a<br />
whole. However, when it comes to cost,<br />
the capital expenditure per hectare of irrigation<br />
potential created <strong>in</strong> <strong>Kerala</strong> is higher<br />
than that <strong>for</strong> all of <strong>India</strong>. While it is<br />
Rs 17,878 <strong>in</strong> <strong>Kerala</strong>, it is just Rs 10,219 <strong>for</strong><br />
<strong>India</strong>, as a whole. The gross receipts per<br />
hectare till this period is just Rs 29.62<br />
which is about one-third of the national<br />
receipts <strong>in</strong> that account. The work<strong>in</strong>g<br />
expenses are also substantially lower <strong>in</strong><br />
<strong>Kerala</strong>. The percentage recovery of work<strong>in</strong>g<br />
expenses to the gross receipts was<br />
4.44%, aga<strong>in</strong>st the national tally of 5.29%.<br />
In short, <strong>Kerala</strong>’s ef<strong>for</strong>ts <strong>in</strong> utilis<strong>in</strong>g the<br />
surface water and groundwater are not<br />
gratify<strong>in</strong>g, and whatever potential created<br />
<strong>in</strong> <strong>Kerala</strong> cost it heavily, <strong>in</strong> terms of<br />
capital costs, <strong>in</strong> comparison with the all-<br />
<strong>India</strong> level. Consider<strong>in</strong>g the fact that only<br />
about one-fourth of the total cost was<br />
spent on m<strong>in</strong>or irrigation projects and<br />
that the achievement rate of these projects<br />
was reported to be comparable as that<br />
of the major/medium ones, it could be<br />
July 24, 2010 vol xlv no 30 EPW Economic & Political Weekly
safely concluded that the m<strong>in</strong>or irrigation<br />
projects are cost-effective. The social<br />
costs of major irrigation projects are also<br />
put at very high levels (Thukral 1992; IIT<br />
2008). There is great potential yet to be<br />
created <strong>in</strong> <strong>Kerala</strong> <strong>for</strong> m<strong>in</strong>or irrigation<br />
projects. All these warrant a serious<br />
relook at the socio-economic benefits<br />
these projects orig<strong>in</strong>ally envisaged and<br />
that the proposals <strong>for</strong> m<strong>in</strong>or projects<br />
merit greater consideration. However, the<br />
conclusions on the basis of an assessment<br />
of f<strong>in</strong>ancial efficiency should be corroborated<br />
with field data on irrigation of<br />
crops. An attempt is made towards this<br />
end, <strong>in</strong> the next section.<br />
Table 9: F<strong>in</strong>ancial Efficiency of <strong>Irrigation</strong> Projects of <strong>Kerala</strong> and <strong>India</strong><br />
The actual marg<strong>in</strong>al cost <strong>in</strong>curred dur<strong>in</strong>g<br />
a plan period per hectare of the irrigation<br />
area added dur<strong>in</strong>g the period is estimated.<br />
In order to assess the real achievements<br />
of irrigation <strong>in</strong> terms of the total<br />
requirement of water, an <strong>in</strong>dex, named <strong>in</strong><br />
this paper as “water requirement realisation<br />
<strong>in</strong>dex (WRRI)”, is computed, us<strong>in</strong>g the<br />
<strong>for</strong>mula.<br />
r<br />
∑ wk<br />
Ak<br />
k<br />
WRRI<br />
= x 100<br />
0<br />
× 100; where w<br />
w A<br />
k<br />
is<br />
∑<br />
k<br />
k<br />
k<br />
irrigation<br />
the per hectare water requirement of kth<br />
crop (Table 7), A r k , and A0 k<br />
are area under<br />
actually realised under the crop<br />
and area put under cultivation.<br />
Thus, WRRI, by def<strong>in</strong>ition, gives the ratio<br />
of total water actually required <strong>for</strong> the<br />
irrigated area under all crops to the total<br />
water actually needed if all the area under<br />
cultivation of those crops were irrigated.<br />
These estimates are presented <strong>in</strong> Table 10.<br />
The values of WRRI are computed, both<br />
with the m<strong>in</strong>imum requirement level and<br />
with the maximum levels. These estimates<br />
are presented <strong>in</strong> Table 10. As was<br />
already noted, despite heavy expenditure<br />
already <strong>in</strong>curred on irrigation dur<strong>in</strong>g various<br />
five-year plans, the total area brought<br />
under irrigation does not appear to be<br />
Item <strong>Kerala</strong> <strong>India</strong><br />
1 Ultimate irrigation potential (‘000 ha) $<br />
1.1 Major and medium: surface water 1,000 58,465<br />
1.2 M<strong>in</strong>or: surface and groundwater 1,679 81,543<br />
2 Potential created (‘000 ha) up to IXth Plan<br />
2.1 Major and medium: surface water 609 37,046<br />
2.2 M<strong>in</strong>or: surface and groundwater 640 56,900<br />
3 Potential utilised (‘000 ha) up to IXth Plan #<br />
3.1 Major and medium: surface water 556 31,010<br />
3.2 M<strong>in</strong>or: surface and groundwater 603 49,408<br />
4 Potential created as % of ultimate potential<br />
4.1 Major and medium: surface water 60.90 63.36<br />
4.2 M<strong>in</strong>or: surface and groundwater 38.12 69.78<br />
5 Potential utilised as % of ultimate potential<br />
5.1 Major and medium: surface water 55.60 53.04<br />
5.2 M<strong>in</strong>or: surface and groundwater 35.91 60.59<br />
6 Profit/Loss<br />
6.1 Capital outlay (up to 2002-03) Rs Mn 22,329 9,60,079<br />
6.2 Work<strong>in</strong>g expenditure and <strong>in</strong>terests (year 2002-03) 833 1,48,152<br />
6.3 Gross receipts – year 2002-03 37 7834<br />
7 Expenditure per hectare of potential created<br />
7.1 Capital outlay (up to 2002-03) (Rs) 17,878 10,219<br />
7.2 Work<strong>in</strong>g expenditure and <strong>in</strong>terests (Rs) – year 2002-03 666.93 1,576.99<br />
7.3 Gross receipts (Rs) – year 2002-03 29.62 83.39<br />
8 Recovery of work<strong>in</strong>g expense to gross receipts (%) – year 2002-03 (%) 4.44 5.29<br />
$: <strong>Irrigation</strong> potential of <strong>Kerala</strong> estimated by the State <strong>Irrigation</strong> Department is around 1.5 million ha, out of which 0.90 Mn ha is<br />
projected <strong>for</strong> m<strong>in</strong>or irrigation sources (GoK 1998).<br />
#: Data on area brought under irrigation, as provided by the state agencies are much lower If these are accounted <strong>for</strong>, the per hectare<br />
achievement will further shoot up.<br />
Source: Compiled/computed from CWC 2005.<br />
satisfactory. At the end of the Seventh<br />
Plan and the N<strong>in</strong>th Plan (up to March<br />
2002), it recorded even a negative growth<br />
(as the reported area under irrigation<br />
Table 10: Extent and Efficiency of <strong>Irrigation</strong> <strong>in</strong> <strong>Kerala</strong> over the Plan Period<br />
NOTES<br />
decl<strong>in</strong>ed dur<strong>in</strong>g the period). The expenditure<br />
<strong>in</strong>curred up to the annual plans 1978-<br />
80 (from 1951-52) was modest (Rs 37,695<br />
per hectare). The marg<strong>in</strong>al expenditure<br />
just took a vertical escalation thereafter.<br />
This was the period when the acreage of<br />
paddy, the most water-demand<strong>in</strong>g crop of<br />
the lot, commenced its slide steeply down.<br />
Dur<strong>in</strong>g the annual plans 1990-92, it ran to<br />
about Rs 7,57,000 per hectare. We had<br />
already seen <strong>in</strong> an earlier section that there<br />
was an advantage of about 500 kg of paddy<br />
(Table 5) on irrigat<strong>in</strong>g the paddy crop. But<br />
consider<strong>in</strong>g the whopp<strong>in</strong>g expenditure<br />
per hectare of added irrigation area, it<br />
should be a straight conclusion that<br />
major irrigation projects are, <strong>in</strong> no way,<br />
cost-effective.<br />
The change <strong>in</strong> cropp<strong>in</strong>g pattern made<br />
the scene still worse. Where the m<strong>in</strong>imum<br />
rate of water requirement (per hectare) is<br />
concerned, the level of irrigation <strong>for</strong> the<br />
crops was met, up to 1978-80 plan years, to<br />
the extent of only 14.97%. Though it<br />
<strong>in</strong>creased to 17.93% dur<strong>in</strong>g the Eighth<br />
Plan, the next plan period witnessed a<br />
considerable decrease (to a level of 16.68%).<br />
In terms of the maximum rate of irrigation<br />
also, it recorded slight decl<strong>in</strong>es <strong>in</strong> each<br />
plan period under consideration, except<br />
<strong>for</strong> the Eighth Plan.<br />
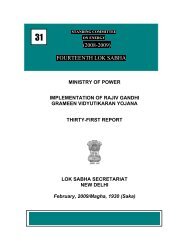
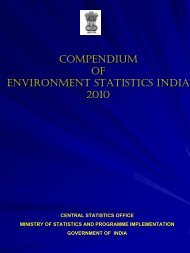
The whole scenario on the realisation of<br />
water requirement of crops <strong>in</strong> <strong>Kerala</strong> is<br />
captured <strong>in</strong> Figure 1 (p 80).<br />
Hav<strong>in</strong>g spent such large sums on irrigation,<br />
it is quite disturb<strong>in</strong>g that there is no<br />
great improvement <strong>in</strong> the achievement<br />
levels of irrigation. However, these estimates<br />
<strong>in</strong> the study did not consider the<br />
socio-economic benefits other than crop<br />
irrigation. It might even be that all the<br />
area under crops that have benefited has not<br />
been brought under the data coverage of the<br />
government publications. For <strong>in</strong>stance,<br />
cardamom is a crop that is yield-sensitive<br />
to irrigation. Know<strong>in</strong>g it well, the farmers<br />
Plan Total Area <strong>Irrigation</strong> Area Marg<strong>in</strong>al Cost <strong>for</strong> <strong>Water</strong> Requirement Realisation Index<br />
Irrigated(ha) Added dur<strong>in</strong>g the <strong>Irrigation</strong> (at (WRRI) %<br />
Period (ha) 1993-94 Prices) Rs/ha Maximum M<strong>in</strong>imum<br />
Up to Annual Plan (1978-80) 3,80,926 3,80,926 37,695 15.65 14.97<br />
VI (1980-85) 3,99,152 18,226 3,89,698 16.53 15.84<br />
VII (1985-90) 3,84,561 -14,591 – 16.41 15.84<br />
Annual Plan (1990-92) 3,87,411 2,850 7,56,900 15.47 14.87<br />
VIII (1992-97) 4,58,569 71,158 94,794 18.47 17.93<br />
IX (Exp: up to 3/2002) (Provisional) 4,32,217 -26,352 – 16.77 16.68<br />
Source: Computed from data source as given <strong>in</strong> tables above.<br />
Economic & Political Weekly EPW July 24, 2010 vol xlv no 30 79
NOTES<br />
do not, as a practice, leave the crop fully<br />
to the benevolence of ra<strong>in</strong>. But no government<br />
publication is seen to report irrigation<br />
under cardamom. It could be that<br />
the data on irrigation area reflect only<br />
the acreage under the command area of<br />
the projects.<br />
Figure 1: <strong>Water</strong> Requirement Realisation Index <strong>in</strong> Various Plan Periods <strong>for</strong> M<strong>in</strong>imum and Maximum <strong>Irrigation</strong><br />
Requirement of Crops<br />
WRRI<br />
80<br />
20<br />
16<br />
12<br />
8<br />
4<br />
0<br />
Maximum<br />
M<strong>in</strong>imum<br />
Up to 1979-80 1984-85 1989-90 1991-92 1996-97 March 2002<br />
In some of the areas of irrigation<br />
projects <strong>in</strong> Kollam and Thiruvananthapuram<br />
districts, it was observed that the<br />
residents <strong>in</strong> the command area of the<br />
projects, as a whole, appeared to be happy<br />
as they felt that the irrigation canals, when<br />
charged, have elevated the water table,<br />
sav<strong>in</strong>g the wells around from go<strong>in</strong>g dry. It<br />
can be concluded with sufficient confidence,<br />
that even after account<strong>in</strong>g <strong>for</strong> these benefits,<br />
that the irrigation facilities already <strong>in</strong><br />
place <strong>in</strong> <strong>Kerala</strong> have not been adequately<br />
utilised and that a little <strong>in</strong>crease <strong>in</strong><br />
irrigation that was really achieved (as per<br />
the available data) is not commensurate<br />
with the heavy <strong>in</strong>crease <strong>in</strong> the costs of the<br />
irrigation projects of <strong>Kerala</strong>.<br />
5 Conclusions<br />
Public <strong>in</strong>vestment <strong>in</strong> irrigation was very<br />
much needed <strong>in</strong> <strong>India</strong>, more so <strong>in</strong> the<br />
<strong>in</strong>fancy of the centralised plann<strong>in</strong>g process.<br />
<strong>Kerala</strong> also embarked on a series of largebudget<br />
irrigation projects right from the<br />
First Five-Year Plan period. This was<br />
greatly justified even <strong>in</strong> a wet tropical<br />
region like <strong>Kerala</strong>, where irregularity <strong>in</strong><br />
ra<strong>in</strong>fall was the norm and the domestic<br />
production of food could hardly meet just<br />
one-sixth of the requirement of the population<br />
and achieved yield levels fell<br />
extremely short of the potential levels<br />
projected. <strong>Irrigation</strong> systems <strong>in</strong> <strong>Kerala</strong> are<br />
becom<strong>in</strong>g heavily expensive and water is<br />
now much more precious. However, the<br />
land brought newly under irrigation is too<br />
small, to enable the state to recover the<br />
huge cost already <strong>in</strong>curred. There<strong>for</strong>e, the<br />
fact that the domestic production of<br />
foodgra<strong>in</strong>s registered a sharp decl<strong>in</strong>e<br />
ow<strong>in</strong>g to the rapid shr<strong>in</strong>kage <strong>in</strong> area and<br />
that the irrigation <strong>in</strong>frastructure re ma<strong>in</strong> ed<br />
grossly underutilised even by other crops,<br />
warrants a fresh look at the whole agenda<br />
of development of major irrigation facilities<br />
<strong>in</strong> the state.<br />
Notes<br />
1 coconutboard.nic.<strong>in</strong>, as on October 2008.<br />
2 GoK 2006; Rubber Board, various issues; GoK,<br />
Statistics <strong>for</strong> Plann<strong>in</strong>g, various issues.<br />
3 Ra<strong>in</strong>fall received dur<strong>in</strong>g the first crop season<br />
(kharif) is more than sufficient to meet the water<br />
requirement. Thirty-seven per cent yield variability<br />
<strong>in</strong> paddy dur<strong>in</strong>g kharif can be expla<strong>in</strong>ed, based on<br />
pre-monsoon and monsoon ra<strong>in</strong>fall. However, the<br />
pre-monsoon showers dur<strong>in</strong>g April to May are very<br />
important as it may hamper proper germ<strong>in</strong>ation of<br />
seeds. The wet spells are detrimental <strong>for</strong> the stage<br />
from flower<strong>in</strong>g to maturity (Rao 2003).<br />
4 The crops <strong>in</strong> a crop-mix atypical the homesteads<br />
of <strong>Kerala</strong> will share the common resources of<br />
land and atmosphere <strong>in</strong>clud<strong>in</strong>g the water that is<br />
used <strong>for</strong> the evaporation and the water that is<br />
wasted through seepage and application losses <strong>in</strong><br />
the field. There<strong>for</strong>e, the estimate on the total<br />
water requirement of all crops <strong>in</strong> <strong>Kerala</strong>, computed<br />
<strong>in</strong> the paper as the sum total of requirements<br />
of <strong>in</strong>dividual crops, may be on the higher<br />
side. However, with the k<strong>in</strong>d of data on irrigation<br />
and crop acreage as is available from published<br />
sources, only the method of estimation that is<br />
adopted <strong>in</strong> the paper seems feasible.<br />
References<br />
CWC (2005): <strong>Water</strong> Data Book (New Delhi: Central <strong>Water</strong><br />
Commission (In<strong>for</strong>mation System Organisation).<br />
– (2006): <strong>Water</strong> and Related Statistics (New Delhi:<br />
Central <strong>Water</strong> Commission, In<strong>for</strong>mation System<br />
Organisation).<br />
Das, M N and N C Giri (2003): Design and Analysis of<br />
Experiments (New Delhi: New Age International).<br />
GoI (2005): “Situation Assessment Survey of Farmers:<br />
Some Aspects of Farm<strong>in</strong>g” (New Delhi: National<br />
Sample Survey Organisation, Government of<br />
<strong>India</strong>).<br />
GoK (1993): “Statistics <strong>for</strong> Plann<strong>in</strong>g 1993” (Thiruvanathapuram:<br />
Department of Economics and<br />
Statistics, Government of <strong>Kerala</strong>).<br />
– (1998): “N<strong>in</strong>th Five-Year Plan 1997-2002: Report<br />
of the Steer<strong>in</strong>g Committee on <strong>Water</strong> Resources”<br />
(Thiruvananthapuram: State Plann<strong>in</strong>g Board,<br />
Government of <strong>Kerala</strong>).<br />
– (2001a): “Data Book on Agriculture 2000” (Thiruvananthapuram:<br />
State Plann<strong>in</strong>g Board, Government<br />
of <strong>Kerala</strong>).<br />
– (2001b): “Statistics <strong>for</strong> Plann<strong>in</strong>g 2000” (Thiruvanathapuram:<br />
Department of Economics and<br />
Statistics, Government of <strong>Kerala</strong>).<br />
– (2003): “Tenth Five Year Plan 2002-2007: Report<br />
of the Steer<strong>in</strong>g Committee on <strong>Water</strong> Resources”<br />
(Thiruvananthapuram: State Plann<strong>in</strong>g Board,<br />
Government of <strong>Kerala</strong>).<br />
– (2005): “Statistics <strong>for</strong> Plann<strong>in</strong>g 2005” (Thiruvanathapuram:<br />
Department of Economics and<br />
Statistics, Government of <strong>Kerala</strong>).<br />
– (2007): ComparativeStudy of Paddy Cultivation <strong>in</strong><br />
<strong>Kerala</strong> (Thiruvanathapuram: Department of<br />
Economics and Statistics, Government of <strong>Kerala</strong>).<br />
– (2007a): Economic Review 2006 (Thiruvananthapuram:<br />
State Plann<strong>in</strong>g Board, Government of<br />
<strong>Kerala</strong>).<br />
Gomez, K A and A A Gomez (1984): Statistical Procedures<br />
<strong>for</strong> Agricultural Research (New York: John<br />
Wiley & Sons).<br />
ICAR (1987): Handbook of Agriculture, <strong>India</strong>n Council<br />
of Agricultural Research, New Delhi.<br />
IIT (2008): “Impact of Tehri Dam: Lessons Learnt.<br />
<strong>Water</strong> Welfare Secretariat”, <strong>India</strong>n Institute of<br />
Technology, Roorkee.<br />
Jeromi, P D (2007): “‘Farmers’ Indebtedness and<br />
Suicides: Impact of Agricultural Trade Liberalisation<br />
<strong>in</strong> <strong>Kerala</strong>”, Economic & Political Weekly,<br />
4 August.<br />
KSLUB (1997): <strong>Kerala</strong> State Resource Based Perspective<br />
Plan 2020 AD (A First Approximation), (Thiruvananthapuram:<br />
<strong>Kerala</strong> State Land Use Board).<br />
Lathika, M, Mathew Kurian and C E Ajith Kumar (2004):<br />
“Scope and Constra<strong>in</strong>ts of Growth <strong>in</strong> Productivity<br />
of Coconut <strong>in</strong> <strong>Kerala</strong>”, Productivity 45(3).<br />
Rao, G S L H V Prasada (2003): “Agricultural Meteorology”<br />
(Thrissur: <strong>Kerala</strong> Agricultural University).<br />
Reddi, G H Sankara and T Yellamanda Reddy (2006):<br />
Efficient Use of <strong>Irrigation</strong> <strong>Water</strong> (New Delhi:<br />
Kalyani Publishers).<br />
Rubber Board (various issues): <strong>India</strong>n Rubber Statistics,<br />
Kottayam.<br />
Tata (2001): Statistical Outl<strong>in</strong>e of <strong>India</strong> 2001-02<br />
(Bombay: Tata Services Limited).<br />
Thukral, Enakshi Ganguly, ed. (1992): Big Dams:<br />
Displaced People (New Delhi: Sage).<br />
available at<br />
Delhi Magaz<strong>in</strong>e Distributors<br />
Pvt Ltd<br />
110, Bangla Sahib Marg<br />
New Delhi 110 001<br />
Ph: 41561062/63<br />
July 24, 2010 vol xlv no 30 EPW Economic & Political Weekly