Implementation of Unified Power Flow Controller (UPFC) for Power ...
Implementation of Unified Power Flow Controller (UPFC) for Power ...
Implementation of Unified Power Flow Controller (UPFC) for Power ...

You also want an ePaper? Increase the reach of your titles
YUMPU automatically turns print PDFs into web optimized ePapers that Google loves.
ISSN:2229-6093<br />
Arup Ratan Bhowmik et al, Int. J. Comp. Tech. Appl., Vol 2 (6),1889-1896<br />
reactive power generations at bus-i respectively. N<br />
b<br />
is<br />
the number <strong>of</strong> system buses and is the sensitivity <strong>of</strong><br />
system loading [26]. In equation (5), uni<strong>for</strong>m loading<br />
with the same power factor at all the load buses has<br />
been considered and the increase in the loading is<br />
assumed to be taken care by the slack bus whereas any<br />
sharing <strong>of</strong> generation amongst the generators can be<br />
easily incorporated in this model.<br />
4. Simulation Results and Discussion<br />
Digital simulation is done using the blocks <strong>of</strong> Matlab<br />
Simulink and the results are presented here. Standard<br />
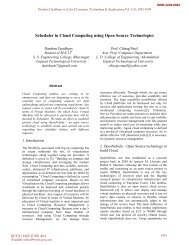
IEEE 14-bus test system is shown in the figure 4.<br />
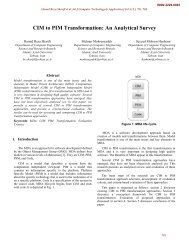
Figure 5 shows Simulation model in<br />
MATLAB/Simulink Environment. The Simulink<br />
Model/diagram <strong>for</strong> Standard IEEE 14-bus network with<br />
<strong>UPFC</strong> in MATLAB/Simulink Environment developed<br />
is shown in the Figure 6. The respective wave<strong>for</strong>ms are<br />
given in the figure below. A comparative per<strong>for</strong>mance<br />
evaluation with and without <strong>UPFC</strong> in the transmission<br />
line has been studied. The line impedance is represented<br />
by series RL combination. Figure 7 shows the<br />
wave<strong>for</strong>m <strong>of</strong> output voltage across load-1 without<br />
<strong>UPFC</strong>. Figure 8 shows the wave<strong>for</strong>m <strong>of</strong> output voltage<br />
across load-2 without <strong>UPFC</strong>. Figure 9 and 10 illustrates<br />
the wave<strong>for</strong>m <strong>of</strong> output voltage across load-1 and load-<br />
2 when <strong>UPFC</strong> is introduced in the network. These<br />
wave<strong>for</strong>ms are obtained by simulating the Simulink<br />
diagram <strong>for</strong> test system in the environment <strong>of</strong><br />
Simpower toolbox <strong>of</strong> MATLAB. Simulation stop time<br />
is set from 0 to 6 to completely analyze the stabilization<br />
time <strong>for</strong> the active power outputs. Ode 23tb [stiff/TR-<br />
BDF2] Simulink solver is used as developed Simulink<br />
model involves nonlinear elements.<br />
The magnitude <strong>of</strong> voltage at bus 1 is adjusted to 1.06<br />
per unit. Line impedances are taken in per unit on a<br />
100-MVA base. The <strong>UPFC</strong> is placed at buses 1 and 4<br />
in the lines 1-2 and 4-7.Then the power injections at the<br />
corresponding buses and increase in the power at<br />
corresponding buses can observe in Table 1 and we can<br />
observe the increment in the active power at the<br />
corresponding buses. Line Data Results <strong>of</strong> 20 lines are<br />
given in table 2. The value <strong>of</strong> Resistance as well as<br />
Reactance is highest in case <strong>of</strong> line number 15. Table 3<br />
shows the bus data and load flow result <strong>for</strong> bus 1-14.<br />
Figure 4. IEEE 14-bus Test System.<br />
Figure 5. Simulation model in<br />
MATLAB/Simulink Environment.<br />
IJCTA | NOV-DEC 2011<br />
Available online@www.ijcta.com<br />
1892