t - International Journal of Applied Science and Technology
t - International Journal of Applied Science and Technology
t - International Journal of Applied Science and Technology

Create successful ePaper yourself
Turn your PDF publications into a flip-book with our unique Google optimized e-Paper software.
<strong>International</strong> <strong>Journal</strong> <strong>of</strong> <strong>Applied</strong> <strong>Science</strong> <strong>and</strong> <strong>Technology</strong> Vol. 1 No. 3; June 2011<br />
62<br />
A NOVEL METHOD FOR THE DETERMINATION OF ORDER OF A REACTION AND RATE<br />
CONSTANT<br />
Abstract<br />
Dr. A.O. Abijo<br />
Department <strong>of</strong> Petroleum <strong>and</strong> Petrochemical <strong>Science</strong>s<br />
Tai Solarin University <strong>of</strong> Education,P.M.B. 2118 Ijagun, Ijebu-Ode, Ogun State, Nigeria<br />
EMAIL: dayoabijo@gmail.com<br />
Phone number: +2348184826096, +2348055108117<br />
Alabi Philip Ephraim<br />
Department <strong>of</strong> Petroleum <strong>and</strong> Petrochemical <strong>Science</strong>s,<br />
Tai Solarin University <strong>of</strong> Education,P.M.B. 2118 Ijagun, Ijebu-Ode, Ogun State, Nigeria<br />
EMAIL: icetritium@yahoo.com<br />
Phone number: +2348083832327, +2348051549584<br />
This study reports the derivation <strong>of</strong> a novel method for the determination <strong>of</strong> the order <strong>of</strong> a reaction <strong>and</strong> its rate<br />
constant, from experimental data. The derived expression is:<br />
n 1<br />
( e 1)<br />
w <br />
<br />
<br />
n1<br />
t 1/2 (2 1)<br />
And<br />
1n n1 n1<br />
Co<br />
(1 2 )(1 e<br />
)<br />
k <br />
1 n t<br />
Where k is the rate constant at a suitable temperature<br />
τ is the time constant<br />
t 1/2 is the half-life<br />
C 0 is a suitable concentration at which the half-life <strong>and</strong> time constant where recorded.<br />
n is the order <strong>of</strong> the reaction.<br />
Key Words: kinetics, reaction order, rate constant, initial rate method, rate law, extent <strong>of</strong> conversion,<br />
temperature, pressure, reaction mechanism.<br />
1.0 INTRODUCTION<br />
Kinetics is concerned with the dynamics <strong>of</strong> chemical reactions such as the way by which reactions take place <strong>and</strong><br />
the rate (speed) <strong>of</strong> the process. The keystone for a reaction mechanism is its rate law. It describes the relation<br />
between the velocity <strong>of</strong> a reaction <strong>and</strong> the concentration <strong>of</strong> chemical reactants (Perry, 2007). The initial rate<br />
method, when it is applicable, provides a clean, simple path to the rate law. The italicized qualifier is important.<br />
However, in practice, the method <strong>of</strong> initial rates is only rarely used for several reasons. The data obtained at the<br />
beginning <strong>of</strong> a reaction, where the rate is largest <strong>and</strong> the time interval is smallest, is usually less reliable than that<br />
obtained at later times, when the rate is less. It is undesirable to base an analysis on one's least reliable data.<br />
Second, <strong>and</strong> more important, the method <strong>of</strong> initial rates uses only a small fraction <strong>of</strong> the concentration time data;<br />
the rest is wasted. Third, to apply the initial rate method requires that full concentration-time pr<strong>of</strong>iles be collected<br />
for each run in order to extract the slope <strong>of</strong> the concentration-time plot at t=0. Collection <strong>of</strong> this much data<br />
requires a lot <strong>of</strong> experimental effort. Most <strong>of</strong> the resulting data is then ignored if the initial rate method is used.<br />
For these reasons <strong>and</strong> others, chemists have developed other methods for determining rate laws from data, which<br />
make use <strong>of</strong> all <strong>of</strong> the data collected (anonymous).<br />
Determination <strong>of</strong> the value <strong>of</strong> the rate constant is <strong>of</strong> great importance, since it helps to determine the value <strong>of</strong> the<br />
rate <strong>of</strong> any reaction applying its rate equation.<br />
1/2
© Centre for Promoting Ideas, USA www.ijastnet .com<br />
In the industrial applications <strong>of</strong> kinetics, knowledge <strong>of</strong> chemical rate equation is essential in establishing the<br />
optimum conditions <strong>of</strong> pressure, temperature, feed composition, space velocity, extent <strong>of</strong> conversion <strong>and</strong><br />
recycling (Smith, 1983). Experimental reaction data must be fitted into a useful reaction rate equation in order to<br />
be used in the simulation <strong>of</strong> reactor design <strong>and</strong> sizing (Jack et al).<br />
For the Finite Difference Methods <strong>of</strong> Numerical Analysis technique to be successful, however, it is important that<br />
the time intervals over which average rates are calculated be short relative to the total reaction time.<br />
1.1 DERIVATION OF EQUATIONS<br />
Assume a reaction: A<br />
P<br />
C<br />
1<br />
n<br />
1n<br />
a<br />
C t<br />
C0<br />
1n<br />
1n<br />
t 0<br />
1n<br />
1n<br />
0 t<br />
t<br />
0<br />
C C kt(1 n)<br />
C C kt(1 n)..................(1)<br />
1/2 t 0<br />
substituting for t in equation (1)<br />
1/2<br />
C ( C 0.5) kt (1 n)<br />
1n<br />
1n<br />
0 0 1/2<br />
1n<br />
<br />
1n<br />
1<br />
<br />
C0 1 kt1/2<br />
(1 n)<br />
<br />
2<br />
<br />
1/2<br />
kt<br />
at t c 0.5c<br />
t<br />
<br />
C<br />
1n<br />
1n<br />
0 t<br />
(1 2 ) ......................(2)<br />
k(1 n)<br />
1n<br />
n1<br />
0<br />
C<br />
at tau, =time constant, Ct<br />
<br />
e<br />
substituting for in equation (1)<br />
C C kt(1 n)<br />
1n<br />
1n<br />
1<br />
<br />
C0 ( C0<br />
k<br />
n)<br />
e<br />
<br />
1n<br />
1n<br />
1n1<br />
<br />
C0 C0<br />
k<br />
n)<br />
e<br />
<br />
1n<br />
n1<br />
C <br />
0 1 e <br />
k<br />
1-n)<br />
<br />
1/2<br />
C<br />
1n<br />
n1<br />
0<br />
1/2<br />
0<br />
<br />
<br />
<br />
(1 e ) ..........................(3)<br />
k(1 n)<br />
dividing equation (3) by equation (2)<br />
1n n1 1n n1<br />
C0 (1 e ) C0<br />
(1 2 )<br />
<br />
<br />
t 1/2 k(1 n) k(1 n)<br />
<br />
t<br />
n1 n1<br />
1e<br />
1e<br />
w<br />
n1 n1<br />
12 12<br />
<br />
let w <br />
t<br />
e<br />
therefore w <br />
n1<br />
n1<br />
2 1<br />
1n n1 1n n1<br />
0 0 1/2<br />
2(1 n) n1 n1 2 2<br />
0 1/2<br />
2(1 n) n1<br />
2 0<br />
<br />
2<br />
(1 n)<br />
t1/2<br />
1 .........................(4)<br />
also multiply equation (3) by equation (2)<br />
C (1 2 ) C (1 e ) k<br />
n) kt (1 n)<br />
C (1 2 )(1 e ) k t n)<br />
k<br />
k <br />
C<br />
C<br />
(1 2 )(1 e<br />
<br />
n1<br />
(1 2 )(1 e )<br />
2(1 n) n1 n1<br />
0<br />
2<br />
(1 n)<br />
t1/2<br />
<br />
1n n1 n1<br />
C0<br />
(1 2 )(1 e<br />
)<br />
k ...........................(5)<br />
1 n t <br />
1/2<br />
)<br />
63
<strong>International</strong> <strong>Journal</strong> <strong>of</strong> <strong>Applied</strong> <strong>Science</strong> <strong>and</strong> <strong>Technology</strong> Vol. 1 No. 3; June 2011<br />
k<br />
C<br />
(1 2 )(1 e )<br />
2(1 n) n1 n1<br />
2 0<br />
<br />
2<br />
(1 n)<br />
t1/2<br />
<br />
k <br />
C<br />
(1 2 )(1 e )<br />
2(1 n) n1 n1<br />
0<br />
2<br />
(1 n)<br />
t1/2<br />
<br />
1n n1 n1<br />
C0<br />
(1 2 )(1 e<br />
)<br />
k ...........................(5)<br />
1 n t <br />
1/2<br />
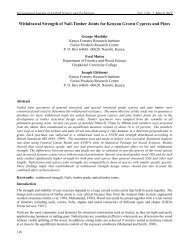
Thus it is evident from equation (4), that there are only two variables, time constant <strong>and</strong> half-life. Therefore if<br />
various values <strong>of</strong> n are substituted into equation (4), we would eventually obtain a corresponding value <strong>of</strong> w.<br />
Hence a table is constructed below. This table could be used as a reference in the determination <strong>of</strong> the order <strong>of</strong> a<br />
reaction.<br />
The table is:<br />
n(order <strong>of</strong> the reaction with respect to A ) w(ratio <strong>of</strong> time constant to half-life)<br />
0.1 1.28<br />
0.2 1.29<br />
0.3 1.31<br />
0.4 1.33<br />
0.5 1.34<br />
0.6 1.36<br />
0.7 1.38<br />
0.8 1.40<br />
0.9 1.42<br />
1.0 1.44<br />
1.1 1.47<br />
1.2 1.49<br />
1.3 1.51<br />
1.4 1.54<br />
1.5 1.57<br />
1.6 1.59<br />
1.7 1.62<br />
1.8 1.65<br />
1.9 1.69<br />
2.0 1.72<br />
2.1 1.75<br />
2.2 1.79<br />
2.3 1.83<br />
2.4 1.86<br />
2.5 1.90<br />
2.6 1.95<br />
2.7 1.99<br />
2.8 2.03<br />
2.9 2.08<br />
3.0 2.13<br />
Table <strong>of</strong> w <strong>and</strong> n<br />
The value <strong>of</strong> w for n=1, is not obtained from equation (4). Because it has been stated during integration that n<br />
cannot be 1. The value <strong>of</strong> w was obtained thus:<br />
For first order:<br />
64
w(time constant/half-life)<br />
© Centre for Promoting Ideas, USA www.ijastnet .com<br />
0.693 1<br />
t1/2<br />
, <br />
k k<br />
1 0.693 <br />
<br />
t k k <br />
1/2<br />
1 k <br />
w <br />
k 0.693 <br />
1 <br />
w <br />
1.44<br />
0.693<br />
<br />
1.2 THE METHOD FOR THE DETERMINATION OF THE ORDER<br />
The method involves, finding a way <strong>of</strong> getting w from the experimental data. The w obtained is now checked up<br />
in the table for the corresponding value <strong>of</strong> n; thus its order is determined.<br />
Let us assume that you were given the data on the rate <strong>of</strong> change <strong>of</strong> concentration with time.<br />
Concentration C 0 C 1 C 2 C 3 C 4<br />
TIME t 0 t 1 t 2 t 3 t 4<br />
Step1<br />
Plot a graph <strong>of</strong> concentration (on the y-axis) against time (on the x-axis).<br />
Step2<br />
Choose or pick a reference concentration (within the boundary <strong>of</strong> the concentration given) or if the initial<br />
concentration is given, just adopt it.<br />
Step3<br />
If the reference concentration is C O find the<br />
Value <strong>of</strong> 0.5C O <strong>and</strong> (1/e)C O<br />
STEP4<br />
Extrapolate the values 0.5C O to the curve <strong>and</strong> (1/e)C O to the curve, the respective time values will be t 1/2 <strong>and</strong><br />
respectively<br />
Step5<br />
From the values <strong>of</strong> half-life <strong>and</strong> time constant,<br />
Calculate w,<br />
The value obtained is now looked-up in the table <strong>and</strong> the corresponding n value is the order<br />
with respect to A.<br />
The graph <strong>of</strong> w against n is shown below<br />
2.5<br />
<strong>of</strong> the reaction<br />
2<br />
1.5<br />
1<br />
0.5<br />
0<br />
0 0.5 1 1.5 2 2.5 3 3.5<br />
Reaction Order(n)<br />
65
<strong>International</strong> <strong>Journal</strong> <strong>of</strong> <strong>Applied</strong> <strong>Science</strong> <strong>and</strong> <strong>Technology</strong> Vol. 1 No. 3; June 2011<br />
1.3 APPLICATION OF THE PRESENT THEORY AND DISCUSSION<br />
PROBLEM 1<br />
Extracted from (Clyde R Metz, 1976)<br />
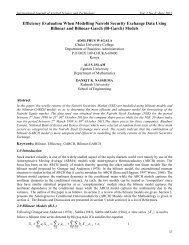
The reaction between ozone <strong>and</strong> carbon disulphide was studied at 29.5 o C with excess CS 2 to find the order <strong>of</strong> the<br />
reaction with respect to ozone from the following data by Olszyna <strong>and</strong> Hieecklan, prove that the reaction is<br />
second order <strong>and</strong> determine the pseudo second order rate constant.<br />
t(min) 0.0 0.5 1.0 2.0 3.0 4.0<br />
Pressure <strong>of</strong> 1.76 1.04 0.79 0.52 0.37 0.29<br />
ozone(torr)<br />
Determination <strong>of</strong> order by proposed method<br />
Using a computer s<strong>of</strong>tware plot the graph (Micros<strong>of</strong>t excel)<br />
2<br />
1.5<br />
1<br />
0.5<br />
0<br />
t(min)<br />
Let the reference concentration be C O =1.76<br />
0.5C O = 0.5(1.76)=0.88<br />
1 1<br />
Co<br />
1.76 0.6475<br />
e e<br />
1<br />
at Co,<br />
t t<br />
2<br />
PROBLEM 2<br />
Extracted from (Clyde R. Metz, 1976)<br />
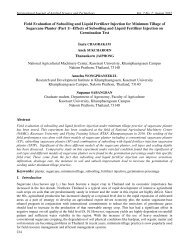
The concentration <strong>of</strong> bromine at various times after flash photolysis <strong>of</strong> a bromine-SF 6 mixture with<br />
C Br /C SF6 =3.2(10 -2 ) were reported by Degraft <strong>and</strong> Lang as<br />
C Br<br />
5<br />
66<br />
1<br />
2<br />
1<br />
2<br />
1<br />
at Co, t= e<br />
from the graph t 0.7526<br />
1.311<br />
1.311<br />
w <br />
t 0.7526<br />
w 1.742 1.74<br />
1<br />
2<br />
from the table the corresponding value <strong>of</strong> n is 2.1<br />
10 M 2.58 1.51 1.04 0.80 0.67 0.56<br />
6<br />
T(10 s)<br />
120 220 320 420 520 620
Cbr ×100000<br />
© Centre for Promoting Ideas, USA www.ijastnet .com<br />
If these data were for the reaction 2Br Br 2 show that the reaction is a pseudo-second order <strong>and</strong> calculate k.<br />
Determination <strong>of</strong> order by proposed method<br />
Using a computer s<strong>of</strong>tware plot the graph( Micros<strong>of</strong>t excel)<br />
3<br />
2.5<br />
2<br />
1.5<br />
1<br />
0.5<br />
0<br />
2.58<br />
220, 1.511.04<br />
0.8 0.67 0.56<br />
0 200 400 600 800<br />
t(0.000001s)<br />
Let the reference concentration be C t =2.58 at t=120<br />
1<br />
Ct<br />
0.5 2.58 1.290<br />
2<br />
1 1<br />
Ct<br />
2.58 0.949<br />
e e<br />
1<br />
at Ct<br />
, t=t<br />
2<br />
1<br />
2<br />
1<br />
2<br />
1<br />
at Ct<br />
, t= e<br />
from the graph t<br />
1<br />
134.8<br />
2<br />
from the graph 228.7<br />
<br />
w 1.6965 1.70<br />
t<br />
from the table the corresponding value n is 1.9<br />
PROBLEM 3<br />
Extracted from (Peter Atkins et al)<br />
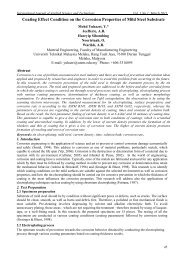
The data below apply to the reaction (CH 3 ) 3 CBr + H 2 O (CH 3 ) 3 COH + HBr, determine the order <strong>of</strong> the<br />
reaction, the rate constant <strong>and</strong> molar concentration <strong>of</strong> 2-methyl-2-bromopropane after 43.8hr.<br />
t/hr 0 3.15 6.2 10.00 18.30 30.8<br />
(CH 3 ) 3 CBr 10.39 8.96 7.76 6.39 3.53 2.07<br />
(0.01mol/dm 3 )<br />
67
concentration(0.01mol/d<br />
m 3 )<br />
<strong>International</strong> <strong>Journal</strong> <strong>of</strong> <strong>Applied</strong> <strong>Science</strong> <strong>and</strong> <strong>Technology</strong> Vol. 1 No. 3; June 2011<br />
DETERMINATION OF ORDER BY PROPOSED METHOD<br />
Using a computer s<strong>of</strong>tware plot the graph (Micros<strong>of</strong>t excel)<br />
12<br />
10<br />
8<br />
6<br />
4<br />
2<br />
0<br />
0 10 20 30 40<br />
t(hr)<br />
Let the reference concentration be C o =10.39 at t=0<br />
1<br />
Co<br />
0.510.39 5.195<br />
2<br />
1 1<br />
Co<br />
10.39 3.822<br />
e e<br />
1<br />
at Co, t=t<br />
2<br />
PROBLEM 4<br />
Extracted from (Kween W.R. et al, 1982)<br />
1<br />
2<br />
1<br />
2<br />
1<br />
at Co, t= e<br />
from the graph t<br />
1<br />
12.96<br />
2<br />
from the graph 17.09<br />
<br />
w 1.3186 1.32<br />
t<br />
from the table the corresponding value n is 0.4<br />
Dinitrogen pentoxide, N 2 O 5 decomposes on st<strong>and</strong>ing to produce dinitrogentetraoxide, nitrogendioxide <strong>and</strong><br />
oxygen. The decomposition is first order.<br />
t(sec) 0 184 319 526 867 1198 1877 2315 3144<br />
C(molL - 2.33 2.08 1.91 1.67 1.36 1.11 0.72 0.55 0.34<br />
1 )<br />
68
P(torr)<br />
C(mol/dm 3 )<br />
© Centre for Promoting Ideas, USA www.ijastnet .com<br />
DETERMINATION OF ORDER BY PROPOSED METHOD<br />
Using a computer s<strong>of</strong>tware plot the graph (Micros<strong>of</strong>t excel)<br />
2.5<br />
2<br />
1.5<br />
1<br />
0.5<br />
0<br />
0 1000 2000 3000 4000<br />
t(SEC)<br />
Let the reference concentration be C o =2.33 at t=0<br />
C 0.5 2.33 1.165<br />
o<br />
1 1<br />
Co<br />
2.33 0.857<br />
e e<br />
1<br />
at Co, t=t<br />
2<br />
1<br />
2<br />
1<br />
2<br />
1<br />
at Co, t= e<br />
from the graph t<br />
1<br />
1107.1<br />
2<br />
from the graph 1618.4<br />
<br />
w 1.4618 1.46<br />
t<br />
from the table the corresponding value n is 1.1<br />
PROBLEM 5<br />
Extracted from (Clyde R. Dillard et al)<br />
Determine the order <strong>of</strong> reaction <strong>and</strong> value <strong>of</strong> the specific rate constant for the decomposition <strong>of</strong> N 2 O 5 from the<br />
following data<br />
t(sec) 110 980 2310 3670 4770 6580 8988<br />
P(torr) 0.826 0.708 0.562 0.449 0.372 0.277 0.184<br />
DETERMINATION OF ORDER BY PROPOSED METHOD<br />
Using a computer s<strong>of</strong>tware plot the graph (Micros<strong>of</strong>t excel)<br />
1<br />
0.8<br />
0.6<br />
0.4<br />
0.2<br />
0<br />
0 2000 4000 6000 8000 10000<br />
t(sec)<br />
69
[iodoethane] mol<br />
<strong>International</strong> <strong>Journal</strong> <strong>of</strong> <strong>Applied</strong> <strong>Science</strong> <strong>and</strong> <strong>Technology</strong> Vol. 1 No. 3; June 2011<br />
Let the reference concentration be C o =0.826 at t=110<br />
1<br />
Co<br />
0.5 0.826 0.413<br />
2<br />
1 1<br />
Co<br />
0.826 0.304<br />
e e<br />
1<br />
at Co, t=t<br />
2<br />
PROBLEM 6<br />
Extracted from (Raymond Chang, 2005)<br />
1<br />
2<br />
1<br />
2<br />
1<br />
at Co, t= e<br />
from the graph t<br />
1<br />
5933.3<br />
2<br />
from the graph 4013.1<br />
<br />
w 1.479 1.48<br />
t<br />
from the table the corresponding value n is 1.1<br />
Ethyl iodide decomposes at a certain temperature in the gas phase as follows:<br />
C 2 H 5 I C 2 H 4 + HI<br />
From the following data determine the order <strong>of</strong> the reaction <strong>and</strong> rate constant<br />
Time(min) 0 15 30 48 75<br />
[C 2 H 5 I] mol 0.36 0.30 0.25 0.19 0.13<br />
DETERMINATION OF ORDER BY PROPOSED METHOD<br />
Using a computer s<strong>of</strong>tware plot the graph (Micros<strong>of</strong>t excel)<br />
0.4<br />
0.35<br />
0.3<br />
0.25<br />
0.2<br />
0.15<br />
0.1<br />
0.05<br />
0<br />
0 20 40 60 80<br />
t(min)<br />
70
P(mmhg)<br />
© Centre for Promoting Ideas, USA www.ijastnet .com<br />
Let the reference concentration be C o =0.36 at t=0<br />
1<br />
Co<br />
0.5 0.36 0.18<br />
2<br />
1 1<br />
Co<br />
0.36 0.132<br />
e e<br />
1<br />
at Co, t=t<br />
2<br />
1<br />
2<br />
1<br />
2<br />
1<br />
at Co, t= e<br />
from the graph t<br />
1<br />
51.35<br />
2<br />
from the graph 73.92<br />
<br />
w 1.4395 1.44<br />
t<br />
from the table the corresponding value n is 1.0<br />
PROBLEM 7<br />
Extracted from (Raymond Chang, 2005)<br />
Cyclobutane decomposes to ethylene according to the equation below:<br />
C 4 H 8<br />
2C 2 H 2,<br />
Determine the order <strong>of</strong> the reaction <strong>and</strong> the rate constant based on the following pressures which were recorded<br />
when the reaction is carried out at 430 0 C in a constant-volume vessel.<br />
Time(s) 0 2000 4000 6000 8000 10000<br />
P(mmHg) 400 316 248 196 155 122<br />
DETERMINATION OF ORDER BY PROPOSED METHOD<br />
Using a computer s<strong>of</strong>tware plot the graph (Micros<strong>of</strong>t excel)<br />
500<br />
400<br />
300<br />
200<br />
100<br />
0<br />
0 5000 10000 15000<br />
Time(s)<br />
71
<strong>International</strong> <strong>Journal</strong> <strong>of</strong> <strong>Applied</strong> <strong>Science</strong> <strong>and</strong> <strong>Technology</strong> Vol. 1 No. 3; June 2011<br />
Let the reference concentration be C o =400 at t=0<br />
1<br />
Co<br />
0.5 400 200<br />
2<br />
1 1<br />
Co<br />
400 147.15<br />
e e<br />
1<br />
at Co, t=t<br />
2<br />
1.4 CONCLUSION<br />
1<br />
2<br />
1<br />
2<br />
1<br />
at Co, t= e<br />
from the graph t<br />
1<br />
5832.9<br />
2<br />
from the graph 8409.2<br />
<br />
w 1.4416 1.44<br />
t<br />
from the table the corresponding value n is 1.0<br />
This method <strong>and</strong> its accuracy will be limited by the source <strong>of</strong> the experimental data, experimental errors <strong>and</strong><br />
whatever errors that exist in this theoretical reasoning <strong>and</strong> analysis. From the worked illustrations there still<br />
remains a margin <strong>of</strong> error, noticeably ±0.1 in the results <strong>of</strong> the order <strong>of</strong> the reaction. These errors hypothetically<br />
may be caused by the inherent errors in the experimental data <strong>and</strong>/or the errors in the computer plotting <strong>and</strong><br />
extrapolation <strong>of</strong> the curve.<br />
Recall the equation on which this method is based:<br />
w <br />
<br />
n 1<br />
( e 1)<br />
n1<br />
t 1/2 (2 1)<br />
An experimental method that would determine both the time-constant <strong>and</strong> half-life accurately at a specified<br />
concentration (C 0 ) would also specify accurately the order <strong>of</strong> the reaction <strong>and</strong> indirectly the rate constant.<br />
1.4.1 EXPERIMENTAL PROCEDURE<br />
Assume a hypothetical reaction<br />
A + B → P<br />
Assume A is the reactant specie whose order we intend to determine<br />
Step1<br />
Measure the concentration <strong>of</strong> A before reaction=C o<br />
Measure accurately two equal volumes <strong>of</strong> A into two separate reaction vessels<br />
Step2<br />
Calculate 0.5C O AND (1/e) C o<br />
Step3<br />
To the first volume <strong>of</strong> A react with B <strong>and</strong> determine the time taken for the reaction <strong>of</strong> A to be 0.5C O , the time<br />
determined is the half-life.<br />
Step4<br />
To the first volume <strong>of</strong> A react with B <strong>and</strong> determine the time taken for the reaction <strong>of</strong> A to be (1/e) C 0 , the time<br />
determined is the time constant.<br />
Note<br />
Step3 <strong>and</strong> step4 should be carried out using suitable instrumental analytical techniques<br />
72
© Centre for Promoting Ideas, USA www.ijastnet .com<br />
Step5<br />
<br />
Calculate t1<br />
2<br />
And check the value obtained with the corresponding value in the table. And calculate k.<br />
The above experiment is yet to be demonstrated due to unavailability <strong>of</strong> suitable analytical equipment <strong>and</strong><br />
reagents. We would appreciate help or suggestion to help us out.<br />
Kindly note that the problems used for illustration in this paper are exactly as presented in the original texts.<br />
References<br />
Yang, K.H., & Hougen, O.A. (1950). Determination <strong>of</strong> Mechanism <strong>of</strong> Catalyzed Gaseous<br />
Reactions. Chemical Engineering Progress, 46 (3), 146-157<br />
Perry, R. H., 2007. Chemical engineers’ h<strong>and</strong>book. 8th ed., McGraw-Hill Pr<strong>of</strong>essional.<br />
Smith, J. M., 1983. Chemical engineering kinetics. 3rd ed., McGraw-Hill, <strong>International</strong> Student edition<br />
Clyde R. Metz: theory <strong>and</strong> problems <strong>of</strong> physical chemistry, schuam’s outline series Mcgraw-Hill book company,<br />
1976.<br />
Peter Atkin’s et al: physical chemistry Oxford university press, New York, eight edition.<br />
Kween W.R. et al: chemistry; facts, patterns, <strong>and</strong> principles ELBS <strong>and</strong> Addison Wesley publishers, London, 1982<br />
edition.<br />
Clyde R. Dillard, David E. Goldberg: Chemistry reactions, structure <strong>and</strong> properties, new Macmillan company,<br />
New York.<br />
Raymond Chang: chemistry(eight edition), Mcgraw-Hill higher education 2005.<br />
73