A Time-Dependent Enhanced Support Vector Machine For Time ...
A Time-Dependent Enhanced Support Vector Machine For Time ...
A Time-Dependent Enhanced Support Vector Machine For Time ...

Create successful ePaper yourself
Turn your PDF publications into a flip-book with our unique Google optimized e-Paper software.
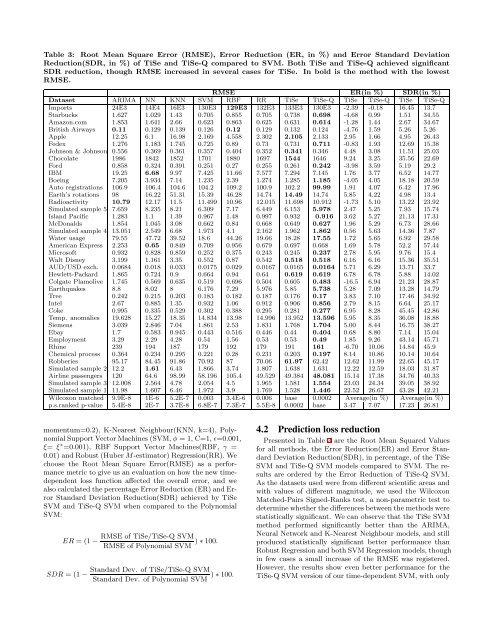
Table 3: Root Mean Square Error (RMSE), Error Reduction (ER, in %) and Error Standard Deviation<br />
Reduction(SDR, in %) of TiSe and TiSe-Q compared to SVM. Both TiSe and TiSe-Q achieved significant<br />
SDR reduction, though RMSE increased in several cases for TiSe. In bold is the method with the lowest<br />
RMSE.<br />
RMSE ER(in %) SDR(in %)<br />
Dataset ARIMA NN KNN SVM RBF RR TiSe TiSe-Q TiSe TiSe-Q TiSe TiSe-Q<br />
Imports 24E3 14E4 16E3 130E3 129E3 132E3 133E3 130E3 -2.39 -0.18 16.45 13.7<br />
Starbucks 1.627 1.029 1.43 0.705 0.855 0.705 0.738 0.698 -4.68 0.99 1.51 34.55<br />
Amazon.com 1.853 1.641 2.66 0.623 0.863 0.625 0.631 0.614 -1.28 1.44 2.67 34.67<br />
British Airways 0.11 0.129 0.139 0.126 0.12 0.129 0.132 0.124 -4.76 1.59 5.26 5.26<br />
Apple 12.25 6.1 16.98 2.169 4.558 2.302 2.105 2.133 2.95 1.66 4.95 26.43<br />
Fedex 1.276 1.183 1.745 0.725 0.89 0.73 0.731 0.711 -0.83 1.93 12.69 15.38<br />
Johnson & Johnson 0.556 0.369 0.361 0.357 0.404 0.352 0.341 0.346 4.48 3.08 11.51 25.03<br />
Chocolate 1986 1842 1852 1701 1880 1697 1544 1646 9.24 3.25 35.56 22.69<br />
<strong>For</strong>d 0.858 0.324 0.391 0.251 0.27 0.255 0.261 0.242 -3.98 3.59 5.19 29.2<br />
IBM 19.25 6.68 9.97 7.425 11.66 7.577 7.294 7.145 1.76 3.77 6.52 14.77<br />
Boeing 7.205 3.934 7.14 1.235 2.39 1.274 1.285 1.185 -4.05 4.05 18.18 20.59<br />
Auto registrations 106.9 106.4 104.6 104.2 109.2 100.9 102.2 99.99 1.91 4.07 6.42 17.96<br />
Earth’s rotations 98 16.22 51.31 15.39 46.28 14.74 14.49 14.74 5.85 4.22 4.98 13.4<br />
Radioactivity 10.79 12.17 11.5 11.499 10.96 12.015 11.698 10.912 -1.73 5.10 13.22 23.92<br />
Simulated sample 5 7.659 8.235 8.21 6.309 7.17 6.449 6.153 5.978 2.47 5.25 7.93 15.74<br />
Island Pacific 1.283 1.1 1.39 0.967 1.48 0.997 0.932 0.916 3.62 5.27 21.13 17.31<br />
McDonalds 1.854 1.045 3.08 0.662 0.84 0.668 0.649 0.627 1.96 5.29 6.73 28.66<br />
Simulated sample 4 13.051 2.549 6.68 1.973 4.1 2.162 1.962 1.862 0.56 5.63 14.36 7.87<br />
Water usage 79.55 47.72 39.52 18.6 44.26 19.66 18.28 17.55 1.72 5.65 6.92 29.58<br />
American Express 2.253 0.65 0.849 0.709 0.956 0.679 0.697 0.668 1.69 5.78 52.2 57.44<br />
Microsoft 0.932 0.828 0.859 0.252 0.375 0.243 0.245 0.237 2.78 5.95 9.76 15.4<br />
Walt Disney 3.199 1.161 3.35 0.552 0.87 0.542 0.518 0.518 6.16 6.16 15.36 35.51<br />
AUD/USD exch. 0.0684 0.018 0.033 0.0175 0.029 0.0167 0.0165 0.0164 5.71 6.29 13.71 33.7<br />
Hewlett-Packard 1.865 0.724 0.9 0.664 0.94 0.64 0.619 0.619 6.78 6.78 5.88 14.02<br />
Colgate Plamolive 1.745 0.569 0.635 0.519 0.696 0.504 0.605 0.483 -16.5 6.94 21.23 28.87<br />
Earthquakes 8.8 8.02 8 6.176 7.29 5.976 5.85 5.738 5.28 7.09 13.28 14.79<br />
Tree 0.242 0.215 0.203 0.183 0.182 0.187 0.176 0.17 3.83 7.10 17.46 34.92<br />
Intel 2.67 0.885 1.35 0.932 1.06 0.912 0.906 0.856 2.79 8.15 6.64 25.17<br />
Coke 0.995 0.335 0.529 0.302 0.388 0.295 0.281 0.277 6.95 8.28 45.45 42.86<br />
Temp. anomalies 19.628 15.27 18.35 14.834 13.98 14.996 13.952 13.596 5.95 8.35 36.08 18.88<br />
Siemens 3.039 2.846 7.04 1.861 2.53 1.831 1.768 1.704 5.00 8.44 16.75 38.27<br />
Ebay 1.7 0.583 0.945 0.443 0.516 0.446 0.44 0.404 0.68 8.80 7.14 15.04<br />
Employment 3.29 2.29 4.28 0.54 1.56 0.53 0.53 0.49 1.85 9.26 43.14 45.71<br />
Rhine 239 194 187 179 192 179 191 161 -6.70 10.06 14.84 45.9<br />
Chemical process 0.364 0.234 0.295 0.221 0.28 0.231 0.203 0.197 8.14 10.86 10.14 10.64<br />
Robberies 95.17 84.45 91.86 70.92 87 70.06 61.97 62.42 12.62 11.99 22.65 45.17<br />
Simulated sample 2 12.2 1.61 6.43 1.866 3.74 1.807 1.638 1.631 12.22 12.59 18.03 31.87<br />
Airline passengers 120 64.6 98.99 58.196 105.4 49.529 49.384 48.081 15.14 17.38 34.76 40.33<br />
Simulated sample 3 12.008 2.564 4.78 2.054 4.5 1.965 1.581 1.554 23.03 24.34 39.05 38.92<br />
Simulated sample 1 11.98 1.607 6.46 1.972 3.9 1.769 1.528 1.446 22.52 26.67 43.28 42.21<br />
Wilcoxon matched 9.9E-8 1E-6 5.2E-7 0.003 3.4E-6 0.006 base 0.0002 Average(in %) Average(in %)<br />
p.s.ranked p-value 5.4E-8 2E-7 3.7E-8 6.8E-7 7.3E-7 5.5E-8 0.0002 base 3.47 7.07 17.23 26.81<br />
momentum=0.2), K-Nearest Neighbour(KNN, k=4), Polynomial<strong>Support</strong><strong>Vector</strong><strong>Machine</strong>s(SVM,φ<br />
= 1, C=1, ǫ=0.001,<br />
ξ= ξ ∗ =0.001), RBF <strong>Support</strong> <strong>Vector</strong> <strong>Machine</strong>s(RBF, γ =<br />
0.01) andRobust(HuberM-estimator) Regression(RR). We<br />
choose the Root Mean Square Error(RMSE) as a performance<br />
metric to give us an evaluation on how the new timedependent<br />
loss function affected the overall error, and we<br />
alsocalculatedthepercentageErrorReduction(ER)andError<br />
Standard Deviation Reduction(SDR) achieved by TiSe<br />
SVM and TiSe-Q SVM when compared to the Polynomial<br />
SVM:<br />
RMSE of TiSe/TiSe-Q SVM<br />
ER = (1−<br />
RMSE of Polynomial SVM )∗100.<br />
Standard Dev. of TiSe/TiSe-Q SVM<br />
SDR = (1−<br />
Presented in Table 3 are the Root Mean Squared Values<br />
for all methods, the Error Reduction(ER) and Error Standard<br />
Deviation Reduction(SDR), in percentage, of the TiSe<br />
SVM and TiSe-Q SVM models compared to SVM. The results<br />
are ordered by the Error Reduction of TiSe-Q SVM.<br />
As the datasets used were from different scientific areas and<br />
with values of different magnitude, we used the Wilcoxon<br />
Matched-Pairs Signed-Ranks test, a non-parametric test to<br />
determinewhetherthedifferencesbetweenthemethodswere<br />
statistically significant. We can observe that the TiSe SVM<br />
method performed significantly better than the ARIMA,<br />
Neural Network and K-Nearest Neighbour models, and still<br />
produced statistically significant better performance than<br />
RobustRegressionandbothSVMRegressionmodels, though<br />
in few cases a small increase of the RMSE was registered.<br />
However, the results show even better performance for the<br />
TiSe-Q SVM version of our time-dependent SVM, with only<br />
Standard Dev. of Polynomial SVM )∗100. 4.2 Prediction loss reduction