surface velocity determination on large polar glaciers by aerial ...
surface velocity determination on large polar glaciers by aerial ...
surface velocity determination on large polar glaciers by aerial ...

Create successful ePaper yourself
Turn your PDF publications into a flip-book with our unique Google optimized e-Paper software.
Allllals of Giacioiogy 8 1986<br />
@ Internati<strong>on</strong>al Glacio\ogical Society<br />
SURFACE VELOCITY DETERMINATION ON LARGE POLAR GLACIERS<br />
BY AERIAL PHOTOGRAMMETRY<br />
<strong>by</strong><br />
H.H. Brecher<br />
(Institute of Polar Studies, The Ohio State University, Columbus, Ohio 432 10, U.S. A)<br />
ABSTRACT<br />
Aerial photogrammetric block triangulati<strong>on</strong>, a standard<br />
and well-developed technique for extending accurate c<strong>on</strong>trol<br />
for mapping into the interior of a regi<strong>on</strong> from a few<br />
points of known positi<strong>on</strong> <strong>on</strong> its perimeter, can be readily<br />
adapted to determine <str<strong>on</strong>g>surface</str<strong>on</strong>g> velocities <strong>on</strong> bodies of ice<br />
which are too <strong>large</strong>, and often too crevassed, to be studied<br />
effectively <strong>by</strong> c<strong>on</strong>venti<strong>on</strong>al ground surveying. Velocities are<br />
calculated from the changes in positi<strong>on</strong>s of the same natural<br />
<str<strong>on</strong>g>surface</str<strong>on</strong>g> features determined from photography of two (or<br />
more) epochs and the elapsed time. This method is capable<br />
of providing many uniformly-spaced measurements over the<br />
whole, moving, ice <str<strong>on</strong>g>surface</str<strong>on</strong>g>, thus allowing the producti<strong>on</strong> of<br />
maps of <str<strong>on</strong>g>velocity</str<strong>on</strong>g> and strain-rate, which are valuable in<br />
analyzing the ice-flow regime. Results from measurements<br />
completed some years ago <strong>on</strong> Byrd Glacier, <strong>on</strong>e of the<br />
<strong>large</strong>st outlet <strong>glaciers</strong> from the East Antarctic plateau, are<br />
presented as an example of what the method can yield. By<br />
means of Doppler satellite surveying, relative positi<strong>on</strong>s of<br />
c<strong>on</strong>trol points for each photography epoch can be<br />
determined with sub-meter accuracy, making the technique<br />
suitable also in regi<strong>on</strong>s where no fixed land features exist.<br />
A brief descripti<strong>on</strong> of a project under way in such an area,<br />
<strong>on</strong> Ice Stream B in West Antarctica, is given.<br />
INTRODUCTION<br />
C<strong>on</strong>venti<strong>on</strong>al surveying to determine <str<strong>on</strong>g>surface</str<strong>on</strong>g> velocities<br />
is not practical <strong>on</strong> <strong>large</strong> <strong>polar</strong> valley <strong>glaciers</strong> and ice<br />
streams. The sheer size of the ice masses, which are<br />
comm<strong>on</strong>ly <strong>on</strong>e or two hundred kilometers l<strong>on</strong>g and many<br />
tens of kilometers wide, usually makes it impossible to<br />
measure enough points for adequate coverage in a<br />
reas<strong>on</strong>able time. Severe crevassing often precludes <str<strong>on</strong>g>surface</str<strong>on</strong>g><br />
travel. On ice streams, there are no vantage points for<br />
survey stati<strong>on</strong>s, from which to make c<strong>on</strong>venti<strong>on</strong>al<br />
intersecti<strong>on</strong> surveys. Furthermore, it is usually not possible<br />
to make enough and properly distributed measurements <strong>by</strong><br />
ground survey methods, even <strong>on</strong> smaller <strong>glaciers</strong>, to allow<br />
producti<strong>on</strong> of maps of <str<strong>on</strong>g>velocity</str<strong>on</strong>g> and strain-rate fields.<br />
Photogrammetric <strong>aerial</strong> block triangulati<strong>on</strong> is a standard,<br />
highly-developed technique for extending precise c<strong>on</strong>trol for<br />
topographic mapping into the interior of a regi<strong>on</strong> from a<br />
limited number of c<strong>on</strong>trol points of known positi<strong>on</strong> <strong>on</strong> the<br />
perimeter and from a few strips of points of known<br />
elevati<strong>on</strong> across the regi<strong>on</strong>. This technique allows the<br />
<str<strong>on</strong>g>determinati<strong>on</strong></str<strong>on</strong>g> of ice-<str<strong>on</strong>g>surface</str<strong>on</strong>g> velocities at essentially as many<br />
points as <strong>on</strong>e wants to measure, with minimal, or, if<br />
necessary, no operati<strong>on</strong> <strong>on</strong> the moving ice <str<strong>on</strong>g>surface</str<strong>on</strong>g>. The<br />
positi<strong>on</strong>s of the same natural features, such as crevasses and<br />
seracs, which are generally present in virtually unlimited<br />
numbers <strong>on</strong> rapidly moving bodies of ice, are determined at<br />
two (or more) epochs and velocities are calculated from the<br />
changes in positi<strong>on</strong>s and the elapsed time. The method<br />
makes it possible to provide many more measurements of<br />
<str<strong>on</strong>g>surface</str<strong>on</strong>g> moti<strong>on</strong> and to have them spaced uniformly over the<br />
whole moving ice mass, than is usually possible with<br />
c<strong>on</strong>venti<strong>on</strong>al field surveys. It is this capability which makes<br />
this photogrammetric technique particularly useful, because it<br />
allows the producti<strong>on</strong> of maps of <str<strong>on</strong>g>velocity</str<strong>on</strong>g> and strain-rate<br />
fields which are valuable in interpreting and analyzing the<br />
flow regime.<br />
The accuracy of the positi<strong>on</strong>s of the new points<br />
determined <strong>by</strong> block <strong>aerial</strong> triangulati<strong>on</strong> is essentially<br />
independent of the size of the block and depends primarily<br />
<strong>on</strong> the spacing between the perimeter c<strong>on</strong>trol points, while<br />
the accuracy of elevati<strong>on</strong>s depends <strong>on</strong> the spacing of the<br />
strips of elevati<strong>on</strong> c<strong>on</strong>trol. With c<strong>on</strong>trol-point spacing of a<br />
few air-base lengths (distances between exposures al<strong>on</strong>g a<br />
flight line), the positi<strong>on</strong>al accuracy of interior points<br />
approaches the measuring accuracy <strong>on</strong> the photographs<br />
(American Society of Photogrammetry, 1980). Measurements<br />
<strong>on</strong> the photographs accurate to a few micrometers are not<br />
uncomm<strong>on</strong>; 10 /Lm is an easily-achievable value. Resoluti<strong>on</strong><br />
of mapping cameras is comm<strong>on</strong>ly about 15 /Lm . Generally,<br />
the smallest-scale photography which allows relevant features<br />
to be resolved, i.e. the smallest number of photographs to<br />
cover the area, will yield the highest accuracy, because<br />
accuracy improves with reducti<strong>on</strong> of the number of<br />
photographs in a block. Fewer photographs also obviously<br />
minimize effort and cost. In practice, the ceiling of the<br />
photographing aircraft is often the limiting factor <strong>on</strong> scale.<br />
With a standard mapping camera (15 cm focal length,<br />
23 cm square format), it is difficult to obtain photographs<br />
at a scale smaller than 1:50000, with generally available<br />
aircraft. Both measuring accuracy and resoluti<strong>on</strong> at this<br />
often-encountered, practical limit are thus better than I m<br />
in the terrain, i.e. 0.5 m and 0.8 m respectively. Because<br />
it is often impractical to emplace strips of c<strong>on</strong>trol points<br />
across the moving ice, poor elevati<strong>on</strong> c<strong>on</strong>trol and its effect<br />
<strong>on</strong> positi<strong>on</strong>al accuracy may have to be accepted. If c<strong>on</strong>trol<br />
points can be established <strong>on</strong> fixed terrain, their positi<strong>on</strong>s<br />
need to be determined <strong>on</strong>ly <strong>on</strong>ce. To avoid uncertainty in<br />
identifying these <strong>on</strong> the photographs, they should be<br />
targeted with suitable markers. The technique can also be<br />
applied in "featureless" terrain, with no fixed points. In this<br />
case, positi<strong>on</strong>s of c<strong>on</strong>trol points must be determined for<br />
each photography epoch and targets to mark the points are<br />
essential. Only relative positi<strong>on</strong>s of c<strong>on</strong>trol points need to<br />
be known. Doppler satellite surveying allows <str<strong>on</strong>g>determinati<strong>on</strong></str<strong>on</strong>g><br />
of relative positi<strong>on</strong>s of points up to hundreds of kilometers<br />
apart and at different times, to sub-meter accuracy<br />
(Mueller, 1982) and has been applied successfully in <strong>polar</strong><br />
c<strong>on</strong>diti<strong>on</strong>s (e.g., Drew and Whillans, 1984).<br />
Results from Byrd Glacier. Antarctica<br />
Results from work <strong>on</strong> the Byrd Glacier, undertaken in<br />
1978-79 as part of a study <strong>by</strong> Terence Hughes, of the<br />
University of Maine, and completed some time ago<br />
(Brecher, 1982), are presented as an example of what the<br />
method can be expected to yield. Similar results should be<br />
obtainable <strong>on</strong> ice stream B or elsewhere, under similar<br />
c<strong>on</strong>diti<strong>on</strong>s.<br />
Byrd is <strong>on</strong>e of the <strong>large</strong>st and most active outlet<br />
<strong>glaciers</strong> from the East Antarctic plateau. The main ice<br />
stream is about 25 km wide. An area more than 100 km<br />
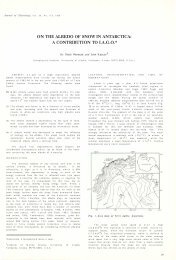
l<strong>on</strong>g and about 40 km wide was measured. Thirteen<br />
perimeter positi<strong>on</strong> and elevati<strong>on</strong> c<strong>on</strong>trol points, eleven <strong>on</strong><br />
the glacier fjord walls and two <strong>on</strong> the glacier, and twelve<br />
additi<strong>on</strong>al elevati<strong>on</strong> c<strong>on</strong>trol points, more or less down the<br />
glacier'S center line, were established (Fig. I ). Surface<br />
22
Brecller:<br />
Surface <str<strong>on</strong>g>velocity</str<strong>on</strong>g> <str<strong>on</strong>g>determinati<strong>on</strong></str<strong>on</strong>g><br />
South Camp<br />
O -+ 84· ~O'S<br />
+<br />
r J Nor rh Camp<br />
+Sou'" Pol e<br />
"""' ..... .,...'m"'=-...,,;50 ==========~<br />
+<br />
---<br />
~ -------'<br />
140·W<br />
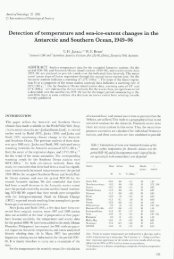
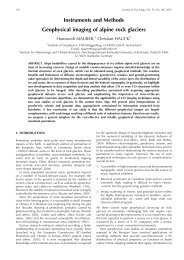
Fig. l . Overviews of photo blocks and c<strong>on</strong>trol layout for<br />
Byrd Glacier and Ice Stream B. Triangles are positi<strong>on</strong> and<br />
elevati<strong>on</strong> c<strong>on</strong>trol points, circles elevati<strong>on</strong> c<strong>on</strong>trol <strong>on</strong>ly.<br />
Open triangles <strong>on</strong> ice stream B are c<strong>on</strong>trol points not<br />
imaged <strong>on</strong> the photographs due to displacement of the<br />
flight lines from their desired positi<strong>on</strong>s. C<strong>on</strong>trol point<br />
pos iti<strong>on</strong>s <strong>on</strong> Ice Stream B were determined <strong>by</strong> Doppler<br />
satellite surveying relative to near<strong>by</strong> points <strong>on</strong> stagnant ice<br />
(North and South camps) and to McMurdo and South Pole<br />
stati<strong>on</strong>s.<br />
velocities were measured from two sets of <strong>aerial</strong><br />
photographs, of 152 and 170 exposures, respectively, taken<br />
56 days apart in the 1978-79 antarctic summer. Only the<br />
minimum number of points to form the two blocks properly<br />
were measured. Average spacing between points <strong>on</strong> the<br />
glacier was about 2.5 km. Points were selected separately in<br />
each block for optimum locati<strong>on</strong> in the photogrammetric<br />
sense and then identified and marked in the other block as<br />
well. Incidentally, it is surprisingly easy to find and identify<br />
the same glacier-<str<strong>on</strong>g>surface</str<strong>on</strong>g> features in photographs taken at<br />
different times. Coordinates of 1467 terrain points were<br />
determined from 6738 image point measurements. Surface<br />
velocities for 60 I comm<strong>on</strong> moving points, 472 of them <strong>on</strong><br />
the main ice stream, were determined. The standard<br />
deviati<strong>on</strong> of the photograph tie-point measurements is<br />
16 .3 /Lm, which is equivalent to 0.8 m in positi<strong>on</strong> and<br />
1.8 m in elevati<strong>on</strong>, at the average scale of the photographs.<br />
This appears to be a reas<strong>on</strong>able indicati<strong>on</strong> of the precisi<strong>on</strong><br />
of the photogrammetric work. Redundancy of measurements<br />
is more than twice as <strong>large</strong> as in usual practice; the<br />
residuals approximate a normal distributi<strong>on</strong> very well and<br />
<strong>on</strong>ly 154 (1.1 %) are <strong>large</strong>r than three standard deviati<strong>on</strong>s.<br />
It is difficult to give a satisfactory estimate of<br />
accuracy, however, as no unambiguous checks are available.<br />
From various indirect approaches, it appears that both<br />
positi<strong>on</strong>s and elevati<strong>on</strong>s are accurate to a few meters.<br />
Taking 5 m as a reas<strong>on</strong>able, and perhaps too c<strong>on</strong>servative,<br />
value yields errors of about 5% to 15% for all velocities<br />
except for the very lowest, near the glacier edge, where it<br />
yields about 40%. Velocities agree within 2 to 4% with<br />
values reported <strong>by</strong> Swithinbank (i 963) and with values from<br />
ground surveys in 1978-79 (Hughes and Fastook, 1981).<br />
Velocities determined independently <strong>by</strong> ground and photogram<br />
metric methods at 13 comm<strong>on</strong> points agree within 0 to<br />
4% and the RMS of the differences is 2%. This good<br />
agreement and the "reas<strong>on</strong>ableness" of the results suggest<br />
1'/<br />
I<br />
+<br />
that the 5 m accuracy estimate, above, may be too<br />
pessimistic. A value of 3 m may be more realistic.<br />
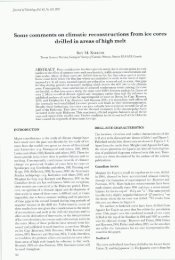
The results are presented as <str<strong>on</strong>g>velocity</str<strong>on</strong>g> vectors and as<br />
c<strong>on</strong>tours of c<strong>on</strong>stant total <str<strong>on</strong>g>velocity</str<strong>on</strong>g> and its x and y<br />
comp<strong>on</strong>ents. The coordinate system was chosen to make the<br />
x directi<strong>on</strong> parallel to the general flow directi<strong>on</strong>, as judged<br />
<strong>by</strong> the vector plot (Fig.2a). The total <str<strong>on</strong>g>velocity</str<strong>on</strong>g> c<strong>on</strong>tour plot<br />
(Fig.2b) clearly shows that the dynamic center line of the<br />
glacier is displaced appreciably from the geometric center<br />
line over about two-thirds of the glacier'S length and that<br />
the maximum <str<strong>on</strong>g>velocity</str<strong>on</strong>g> of 875 m a-I occurs well upstream<br />
<strong>on</strong> the glacier, presumably due to the buttressing effect of<br />
the Ross Ice Shelf. Not surprisingly, the x <str<strong>on</strong>g>velocity</str<strong>on</strong>g> (Fig.2c)<br />
is very similar to the total <str<strong>on</strong>g>velocity</str<strong>on</strong>g> and the y <str<strong>on</strong>g>velocity</str<strong>on</strong>g> plot<br />
(Fig.2d) clearly shows the appreciable right turn, beginning<br />
about half -way down the glacier.<br />
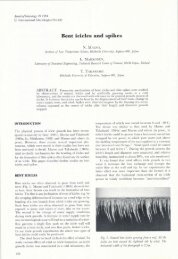
Figure 3 presents these results as c<strong>on</strong>tours of partial<br />
derivatives of the <str<strong>on</strong>g>velocity</str<strong>on</strong>g> comp<strong>on</strong>ents in the two orthog<strong>on</strong>al<br />
directi<strong>on</strong>s (strain rates). These plots were produced at the<br />
suggesti<strong>on</strong> of Ian Whillans and are interpreted with his<br />
assistance, as in Whillans and others (1984). The accuracy of<br />
these <str<strong>on</strong>g>velocity</str<strong>on</strong>g> gradients can be estimated from the positi<strong>on</strong>al<br />
errors. Because positi<strong>on</strong>al errors are highly correlated,<br />
displacements, and thus velocities, of points close together<br />
have much smaller errors than points farther apart.<br />
C<strong>on</strong>versely, errors of <str<strong>on</strong>g>velocity</str<strong>on</strong>g> gradients decrease with greater<br />
spacing. Taking reas<strong>on</strong>able values of positi<strong>on</strong> error and<br />
spacing, <strong>on</strong>e arrives at errors in <str<strong>on</strong>g>velocity</str<strong>on</strong>g> gradients of about<br />
I x 10-3a-I (or <strong>on</strong>e-fifth c<strong>on</strong>tour interval <strong>on</strong> the plots) over<br />
distances of 8 km or more. Errors increase linearly to about<br />
5 x 1O- 3 a- 1 (<strong>on</strong>e c<strong>on</strong>tour interval) for points about 1.5 km<br />
apart.<br />
In the plot of Bv xl Bx (Fig.3a), extending flow at the<br />
upstream end of the glacier, a marked transiti<strong>on</strong> to no<br />
extensi<strong>on</strong> or compressi<strong>on</strong> in the regi<strong>on</strong> of maximum <str<strong>on</strong>g>velocity</str<strong>on</strong>g><br />
and a hint of compressi<strong>on</strong> at the ice-shelf end can be seen.<br />
The plot of oVxl oy (Fig.3b) shows the progressive<br />
development of a narrow shear z<strong>on</strong>e against the fjord walls,<br />
particularly as the ice shelf is approached. More variati<strong>on</strong> in<br />
flow line turning than is readily apparent in the vector plot<br />
is indicated in the BVy'I Bx plot (Fig.3c). A "snaking" moti<strong>on</strong><br />
appears to be taking place at the upstream end and most of<br />
the turning to the north, farther downstream, takes place<br />
over a short distance. Lateral compressi<strong>on</strong> at the upstream<br />
end and spreading at the downstream end are shown <strong>by</strong><br />
the Bv yI By plot (Fig.3d), but the pattern over the glacier is<br />
complex.<br />
Applicati<strong>on</strong> to Ice Stream B. Antarctica<br />
The approach outlined above for regi<strong>on</strong>s where no<br />
fixed c<strong>on</strong>trol points can be established, is being applied to<br />
work begun in the 1984-85 field seas<strong>on</strong> <strong>on</strong> Ice Stream B in<br />
West Antarctica. This ice stream is about 250 km l<strong>on</strong>g and<br />
between 40 and 90 km wide. To keep the field effort<br />
required JO set out the necessary c<strong>on</strong>trol points within<br />
manageable limits, four separate blocks of photographs,<br />
covering limited areas of greatest interest, were laid out.<br />
The blocks are all about 30 km wide and between 60 and<br />
100 km l<strong>on</strong>g. The total area covered, about 9100 km 2 , is<br />
nevertheless equal to about <strong>on</strong>e-third of the area of the<br />
state of Maryland, or of Belgium. About 260 photographs,<br />
at a scale of 1:52000, are involved. Figure I gives an<br />
overview of this project and a comparis<strong>on</strong> with the size<br />
and layout of the Byrd Glacier work described above. The<br />
ice stream B project covers roughly twice the area of the<br />
Byrd Glacier work and each of the four photo blocks is<br />
about half as big as the Byrd Glacier block.<br />
Targets of black, plastic sheeting, 3 m square,<br />
suspended about 0.5 m above the <str<strong>on</strong>g>surface</str<strong>on</strong>g> <strong>on</strong> an array of<br />
bamboo stakes, were used to mark ground c<strong>on</strong>trol points.<br />
Their positi<strong>on</strong>s were determined relative to near<strong>by</strong> points <strong>on</strong><br />
stagnant ice and to McMurdo and South Pole stati<strong>on</strong>s <strong>by</strong><br />
Doppler satellite surveying. They defied burial <strong>by</strong> drifting<br />
snow and destructi<strong>on</strong> <strong>by</strong> wind and their images proved<br />
reas<strong>on</strong>ably easy to find, even though they were, in several<br />
cases, very far from their intended posIti<strong>on</strong>s <strong>on</strong> the<br />
photographs. Due to too great reliance <strong>by</strong> the flight crew<br />
<strong>on</strong> positi<strong>on</strong>ing flight lines with an insufficiently-accurate,<br />
inertial navigati<strong>on</strong> system (INS), the photo blocks are<br />
displaced some 8 to 12 km to the north-east of their<br />
23
Brecher:<br />
Surface <str<strong>on</strong>g>velocity</str<strong>on</strong>g> <str<strong>on</strong>g>determinati<strong>on</strong></str<strong>on</strong>g><br />
8<br />
JIlt. QuockenDu ....<br />
M .. Tuoloto<br />
8<br />
Mop Scol.<br />
Velocity Scal.<br />
o km 10 _---------<br />
Mt. Tuotan:l<br />
8<br />
Mop Sea ..<br />
........... ;;;,m"""",,;'O Total Velocity<br />
Y Velocity Comp<strong>on</strong>ent. Vy<br />
Fig.2. Surface <str<strong>on</strong>g>velocity</str<strong>on</strong>g> <strong>on</strong> Byrd Glacier. a) Velocity vectors, b) total <str<strong>on</strong>g>velocity</str<strong>on</strong>g>, c) x <str<strong>on</strong>g>velocity</str<strong>on</strong>g> and d) y<br />
<str<strong>on</strong>g>velocity</str<strong>on</strong>g> c<strong>on</strong>tours. C<strong>on</strong>tour interval is 20 m a- 1 . Coordinate system chosen to make x directi<strong>on</strong> parallel<br />
to general directi<strong>on</strong> of ice flow. Vectors <strong>on</strong> extreme downstream end have been truncated to allow<br />
figure to fit <strong>on</strong> page.<br />
24
o 0 I<br />
5<br />
-3<br />
0 0 f<br />
a)<br />
0 d<br />
Brecher:<br />
Surface <str<strong>on</strong>g>velocity</str<strong>on</strong>g> <str<strong>on</strong>g>determinati<strong>on</strong></str<strong>on</strong>g><br />
d 0<br />
rface <str<strong>on</strong>g>velocity</str<strong>on</strong>g> (strain rates) <strong>on</strong> Byrd Glacier. 0 avxl ax.,<br />
Fig 3 C<strong>on</strong>tours of partial denvattves 0 su fl 10 turnlOng d) av l ay spreadmgo C<strong>on</strong>tou r<br />
I h c) av l ax ow me , y' 0<br />
extensi<strong>on</strong>, b) avxl ax, atera s eoar, 0 y. 0' dO tance (8 km) over which error IS<br />
o I<br />
eSllmate<br />
0 IO -3a -1 I I indicates minimum IS<br />
mterva IS x 0 -1<br />
to be <strong>on</strong>e-fifth c<strong>on</strong>tour interval (lxlO a ) or less<br />
25
Breclrer:<br />
Surface <str<strong>on</strong>g>velocity</str<strong>on</strong>g> <str<strong>on</strong>g>determinati<strong>on</strong></str<strong>on</strong>g><br />
intended positi<strong>on</strong>s and, as a result, about <strong>on</strong>e third of the<br />
c<strong>on</strong>trol points, usually al<strong>on</strong>g <strong>on</strong>e edge of each block, were<br />
not photographed (Fig.l). Thus, <strong>on</strong>ly a limited part of this<br />
photography can be used for measurements. It is possible to<br />
overcome the navigati<strong>on</strong> problem in relatively featureless<br />
terrain <strong>by</strong> using just <strong>on</strong>e clearly-recognizable feature of<br />
known positi<strong>on</strong>, such as the field camp in this instance, to<br />
correct for INS drift with time and there is every reas<strong>on</strong> to<br />
expect that satisfactory <strong>aerial</strong> photography will be obtained<br />
for this project.<br />
SUMMARY<br />
Photogrammetric <strong>aerial</strong> block triangulati<strong>on</strong> is readily<br />
adaptable for measuring <str<strong>on</strong>g>surface</str<strong>on</strong>g> velocities <strong>on</strong> bodies of ice<br />
which are too <strong>large</strong> to study effectively <strong>by</strong> c<strong>on</strong>venti<strong>on</strong>al<br />
ground surveys. Natural <str<strong>on</strong>g>surface</str<strong>on</strong>g> features are used as moti<strong>on</strong><br />
markers. Due to its capability of providing many<br />
uniformly-spaced measurements, the method allows<br />
producti<strong>on</strong> of maps of <str<strong>on</strong>g>velocity</str<strong>on</strong>g> and strain-rate fields which<br />
are valuable in analyzing and interpreting the ice-flow<br />
regime. Applicati<strong>on</strong> of the method <strong>on</strong> Byrd Glacier indicates<br />
that results accurate to a few per cent can be obtained.<br />
ACKNOWLEDGEMENTS<br />
I thank Terence Hughes and lan Whillans for the<br />
opportunities to work <strong>on</strong> Byrd Glacier and Ice Stream B,<br />
respectively. Ian Whi'lans prompted me to produce the<br />
partial derivative plots and guided me in attempts to<br />
interpret them. An an<strong>on</strong>ymous reviewer made valuable<br />
comments and suggesti<strong>on</strong>s which I have attempted to<br />
incorporate. Equipment loans and other assistance for the<br />
Byrd Glacier work were provided <strong>by</strong> Lloyd Herd and Niel<br />
O' Brien of the Ohio Department of Transportati<strong>on</strong>, Norman<br />
Henders<strong>on</strong> of Henders<strong>on</strong> Aerial Surveys, Steven lohns<strong>on</strong> of<br />
Virginia Polytechnic Institute and State University, the<br />
Department of Geodetic Science and the Instructi<strong>on</strong> and<br />
Research Computer Center of the Ohio State University.<br />
Robert Tope drafted the figures. The work was supported<br />
<strong>by</strong> Nati<strong>on</strong>al Science Foundati<strong>on</strong> grants DPP 77-22204 and<br />
80-19962, for Byrd Glacier and 81-17235A01, for Ice<br />
Stream B.<br />
REFERENCES<br />
American Society of Photogrammetry 1980 Manual of<br />
photogrammetry. Fourth editi<strong>on</strong>. Falls Church, V A,<br />
American Society of Photogrammetry: 397 , 502-505<br />
Brecher H H 1982 Photogrammetric <str<strong>on</strong>g>determinati<strong>on</strong></str<strong>on</strong>g> of <str<strong>on</strong>g>surface</str<strong>on</strong>g><br />
velocities and elevati<strong>on</strong>s <strong>on</strong> Byrd Glacier. Antarctic<br />
Journal of the United States 17(5): 79-81<br />
Drew A R, Whillans I M 1984 Measurement of <str<strong>on</strong>g>surface</str<strong>on</strong>g><br />
deformati<strong>on</strong> of the Greenland ice sheet <strong>by</strong> satellite<br />
tracking. Anllals of Glaciology 5: 51-55<br />
Hughes T J, Fastook J L 1981 Byrd Glacier: 1978-1979<br />
field results. Antarctic Journal of the United States 16(5):<br />
86-89<br />
Mueller I I 1982 African Doppler Survey - ADOS. III<br />
Proceedillgs of the Third Internati<strong>on</strong>al Geodetic Symposium<br />
011 Satellite Doppler Positi<strong>on</strong>ing. Vol 1. Las Cruces, NM,<br />
New Mexico State University. Physical Sciences<br />
Laboratory: 645<br />
Swithinbank C W M 1963 Ice movement of valley <strong>glaciers</strong><br />
flowing into the Ross Ice Shelf, Antarctica. Science<br />
141(3580): 523-524<br />
Whillans I M, lezek K C, Drew A R, Gundestrup N 1984<br />
Ice flow leading to the deep core hole at Dye 3,<br />
Greenland. Allnals of Glaciology 5: 185-190<br />
26