Genetic evaluation of production and reproduction traits in two ...
Genetic evaluation of production and reproduction traits in two ...
Genetic evaluation of production and reproduction traits in two ...

You also want an ePaper? Increase the reach of your titles
YUMPU automatically turns print PDFs into web optimized ePapers that Google loves.
Animal Science Papers <strong>and</strong> Reports vol. 26 (2008) no. 1, 71-78<br />
Institute <strong>of</strong> <strong>Genetic</strong>s <strong>and</strong> Animal Breed<strong>in</strong>g, Jastrzębiec, Pol<strong>and</strong><br />
<strong>Genetic</strong> <strong>evaluation</strong> <strong>of</strong> <strong>production</strong> <strong>and</strong> re<strong>production</strong><br />
<strong>traits</strong> <strong>in</strong> <strong>two</strong> selected l<strong>in</strong>es <strong>of</strong> geese under multitrait<br />
animal model*<br />
Anna Wolc 1 **, Elżbieta Barczak 1 , Stanisław Wężyk 2 ,<br />
Jakub Badowski 3 , Hal<strong>in</strong>a Bielińska 3 , Tomasz Szwaczkowski 1 ***<br />
1<br />
Department <strong>of</strong> <strong>Genetic</strong>s <strong>and</strong> Animal Breed<strong>in</strong>g, Agricultural University <strong>of</strong> Poznań,<br />
Wołyńska 33, 60-637 Poznań, Pol<strong>and</strong><br />
2<br />
National Research Institute <strong>of</strong> Animal Production,<br />
Krakowska 1, 32-083 Balice, Pol<strong>and</strong><br />
3<br />
National Research-Breed<strong>in</strong>g Goose Centre,<br />
Experimental Station Kołuda Wielka <strong>of</strong> the National Research Institute <strong>of</strong> Animal Production,<br />
88-160 Janikowo, Pol<strong>and</strong><br />
(Received November 2, 2007; accepted February 5, 2008)<br />
Heritability <strong>of</strong> <strong>and</strong> genetic correlations among <strong>production</strong> <strong>and</strong> re<strong>production</strong> <strong>traits</strong> as well as<br />
genetic trends over eight years <strong>of</strong> selection were estimated <strong>in</strong> W11 (maternal) <strong>and</strong> W33 (paternal)<br />
l<strong>in</strong>es <strong>of</strong> geese. Considered was body weight on week 8 (BW8) <strong>and</strong> week 11 (BW11), number <strong>of</strong><br />
eggs produced (EP), egg weight (EW), percentage <strong>of</strong> fertility (PFE), <strong>and</strong> percentage <strong>of</strong> hatchability<br />
from eggs fertilized (PHC). Multitrait animal model was applied. Moderate to high heritability<br />
estimates were obta<strong>in</strong>ed for BW8, BW11 <strong>and</strong> EP <strong>in</strong> both l<strong>in</strong>es while lower for PFE <strong>and</strong> PHC. Highest<br />
genetic correlations were estimated between PFE <strong>and</strong> PHC <strong>and</strong> between the body weight <strong>traits</strong>. No<br />
clear genetic trends for any trait were identified. Generally, unfavourable relationships between<br />
productive <strong>and</strong> reproductive <strong>traits</strong> have been confirmed.<br />
KEYWORDS: heritability / genetic correlations / genetic trends / geese /<br />
multitrait animal model<br />
*Supported by the Polish M<strong>in</strong>istry <strong>of</strong> Science <strong>and</strong> Informative Technology, Grant No. 2 PO 6Z 05027<br />
**Scholarship holder from the Foundation for Polish Science (contract 113/2007).<br />
***Correspond<strong>in</strong>g author: tomasz@jay.au.poznan.pl<br />
71
A. Wolc et al.<br />
Over last decades the methodology <strong>of</strong> breed<strong>in</strong>g value prediction has highly been<br />
developed. Animal model enables unbiased estimation <strong>of</strong> variance components <strong>in</strong><br />
populations undergo<strong>in</strong>g selection provided all relationships <strong>and</strong> <strong>traits</strong> <strong>in</strong>cluded <strong>in</strong><br />
selection criteria are <strong>in</strong>volved. It makes simultaneous estimation <strong>of</strong> heritability <strong>and</strong><br />
genetic correlations possible with implicit correction for fixed effects <strong>and</strong> genetic<br />
trend. Due to <strong>in</strong>creas<strong>in</strong>g consumers’ dem<strong>and</strong>s also poultry breeders have recognized<br />
the need <strong>of</strong> implementation <strong>of</strong> more sophisticated statistical methods to breed<strong>in</strong>g value<br />
prediction as the more precise <strong>evaluation</strong> accelerates the genetic ga<strong>in</strong>. Feasibility <strong>of</strong><br />
accelerat<strong>in</strong>g progress through breed<strong>in</strong>g became also considered <strong>in</strong> waterfowl [Shrestha<br />
et al. 2004]. To our knowledge the estimates <strong>of</strong> genetic parametres <strong>of</strong> reproductive<br />
as well as productive <strong>traits</strong> <strong>of</strong> geese under multitrait animal model are not, so far,<br />
available <strong>in</strong> literature. Heritability <strong>of</strong> geese <strong>traits</strong> estimated via s<strong>in</strong>gle trait animal<br />
model was reported by Szwaczkowski et al. [2007].<br />
In light <strong>of</strong> the above the objective <strong>of</strong> this study was to estimate heritabilities <strong>and</strong><br />
genetic correlations among <strong>production</strong> <strong>and</strong> re<strong>production</strong> <strong>traits</strong> <strong>in</strong> <strong>two</strong> geese l<strong>in</strong>es <strong>and</strong><br />
evaluate their genetic trends over eight years <strong>of</strong> selection.<br />
Material <strong>and</strong> methods<br />
Considered were <strong>two</strong> l<strong>in</strong>es (W11 <strong>and</strong> W33) <strong>of</strong> White Koludzka geese. The breed<strong>in</strong>g<br />
programme for both is coord<strong>in</strong>ated by National Research-Breed<strong>in</strong>g Goose Center,<br />
Experimental Station Kołuda Wielka <strong>of</strong> the National Research Institute <strong>of</strong> Animal<br />
Production, Birds were selected based on classical selection <strong>in</strong>dex with genetic<br />
parametres estimated with<strong>in</strong> generation by Henderson’s method III us<strong>in</strong>g sire+dam<br />
model. The procedure was described by Wężyk [1978].<br />
Both l<strong>in</strong>es orig<strong>in</strong>ate from White Italian geese. The present W11 is recommended<br />
as maternal whereas W33 as paternal l<strong>in</strong>e for crossbreed<strong>in</strong>g schemes. The current<br />
study was based upon the records <strong>of</strong> 1707 W11 <strong>and</strong> 824 W33 birds hatched between<br />
1995 <strong>and</strong> 2003 year <strong>and</strong> accounted for the pedigree file. Environmental conditions,<br />
ma<strong>in</strong>ly feed<strong>in</strong>g <strong>and</strong> lighten<strong>in</strong>g programme did not considerably change over time.<br />
The follow<strong>in</strong>g <strong>production</strong> <strong>and</strong> re<strong>production</strong> <strong>traits</strong> were considered:<br />
– body weight at week 8 <strong>of</strong> age (BW8);<br />
– body weight at week 11 <strong>of</strong> age (BW11);<br />
– number <strong>of</strong> eggs yielded – egg <strong>production</strong> until 28th week <strong>of</strong> egg <strong>production</strong><br />
(EP);<br />
– egg weight (EW) – mean computed from all eggs laid by the female over week<br />
48, 49 <strong>and</strong> 50 <strong>of</strong> age;<br />
– percentage <strong>of</strong> eggs fertilized (PFE) as evaluated based on seven <strong>in</strong>dividual egg<br />
<strong>in</strong>cubations (per 3-4 eggs/week);<br />
– percentage <strong>of</strong> eggs hatched (PHC) from eggs fertilized as evaluated based on<br />
seven <strong>in</strong>dividual egg <strong>in</strong>cubations (per 3-4 eggs/week).<br />
72
<strong>Genetic</strong> <strong>evaluation</strong> <strong>of</strong> <strong>production</strong> <strong>and</strong> re<strong>production</strong> <strong>traits</strong> <strong>in</strong> geese<br />
Table 1. General characteristics <strong>of</strong> <strong>production</strong> <strong>and</strong> re<strong>production</strong> <strong>traits</strong> <strong>in</strong> <strong>two</strong><br />
l<strong>in</strong>es <strong>of</strong> geese<br />
L<strong>in</strong>e<br />
W11<br />
W33<br />
Trait<br />
Number <strong>of</strong><br />
observations<br />
Mean SD<br />
BW8-M (kg) a 270 4.29 ** 0.33<br />
BW8-F (kg) a 2477 3.98 ** 0.32<br />
BW11-M (kg) b 270 4.90 ** 0.19<br />
BW11-F (kg) b 2477 4.47 ** 0.32<br />
EP (pcs) 2364 46.87 ** 10.78<br />
EW (g) 2364 156.83 ** 13.67<br />
PFE (%) 1285 75.17 ns 19.52<br />
PHC (%) 805 69.23 ** 19.68<br />
BW8-M (kg) a 65 4.58 ** 0.30<br />
BW8-F (kg) a 1095 4.07 ** 0.33<br />
BW11-M (kg) b 65 5.29 ** 0.30<br />
BW11-F (kg) b 1095 4.62 ** 0.35<br />
EP (pcs) 994 44.41 ** 8.27<br />
EW (g) 335 161.16 ** 7.57<br />
PFE (%) 699 75.62 ns 24.98<br />
PHC (%) 660 62.40 ** 22.12<br />
M − males; F − females.<br />
**Significant differences between l<strong>in</strong>es (P≤0.01); ns − no significant<br />
difference between l<strong>in</strong>es.<br />
a,b Significant differences between sexes identified for both body weight <strong>traits</strong><br />
(jo<strong>in</strong>t analysis was performed <strong>in</strong>clud<strong>in</strong>g fixed effect <strong>of</strong> sex <strong>in</strong> the model).<br />
Descriptive statistics <strong>of</strong> the <strong>traits</strong> studied are given <strong>in</strong> Table 1. As expected, the<br />
means for productive <strong>traits</strong> reached significantly higher level <strong>in</strong> W33 (paternal) l<strong>in</strong>e<br />
whereas re<strong>production</strong> <strong>traits</strong> means were higher <strong>in</strong> W11 (maternal) l<strong>in</strong>e. The significance<br />
<strong>of</strong> differences between l<strong>in</strong>es was verified by ANOVA us<strong>in</strong>g the GLM procedure <strong>of</strong><br />
SAS [2002-2003]. Pearson correlation coefficients were calculated with the use <strong>of</strong> the<br />
CORR procedure <strong>of</strong> SAS [2002-2003].<br />
The follow<strong>in</strong>g multitrait animal model was employed to estimate variance <strong>and</strong><br />
covariance components as well as to predict genetic effects:<br />
where:<br />
y = (X ⊗ I)b + (Z ⊗ I)a + e<br />
y – N×1vector <strong>of</strong> observations <strong>of</strong> t <strong>traits</strong>;<br />
b – pt×1 vector <strong>of</strong> fixed effects (year <strong>of</strong> hatch<strong>in</strong>g for all <strong>traits</strong>, sex- for<br />
body weight, only);<br />
a – qt×1 vector <strong>of</strong> r<strong>and</strong>om additive genetic effects;<br />
e – N×1 vector <strong>of</strong> r<strong>and</strong>om errors;<br />
X – N×pt known design matrix <strong>of</strong> fixed effects;<br />
Z – N×qt known design matrix <strong>of</strong> r<strong>and</strong>om additive genetic effects;<br />
73
A. Wolc et al.<br />
I – identity matrix;<br />
⊗ – Kronecker product;<br />
N – total number <strong>of</strong> observations for all <strong>traits</strong>.<br />
The follow<strong>in</strong>g parametres describ<strong>in</strong>g genetic <strong>and</strong> phenotypic structure <strong>of</strong> the<br />
population were estimated:<br />
– heritability coefficients;<br />
– genetic correlation coefficients;<br />
– phenotypic correlation coefficients;<br />
– genetic trends.<br />
In order to achieve convergence <strong>of</strong> iteration process SIMPLEX <strong>and</strong> AIREML were<br />
comb<strong>in</strong>ed. The DXMUX programme [Meyer 2001] was used. <strong>Genetic</strong> trends were<br />
derived as changes <strong>in</strong> mean predicted breed<strong>in</strong>g values over time. St<strong>and</strong>ard deviations<br />
<strong>of</strong> heritability estimates were approximated accord<strong>in</strong>g to the formula described by<br />
Smith <strong>and</strong> Graser [1986].<br />
Results <strong>and</strong> discussion<br />
The estimates <strong>of</strong> genetic parametres for the populations studied are listed <strong>in</strong> Tables<br />
2 <strong>and</strong> 3. Except for PFE <strong>and</strong> PHC, moderate to high heritability coefficients (h 2 ) were<br />
estimated <strong>in</strong> both l<strong>in</strong>es.<br />
There are very few papers referr<strong>in</strong>g to genetic parametres <strong>of</strong> breed<strong>in</strong>g geese.<br />
Larzul et al. [2000] reported the h 2 <strong>of</strong> body weight at the age <strong>of</strong> 8 <strong>and</strong> 11 weeks to<br />
reach 0.64 <strong>and</strong> 0.68, respectively, with genetic correlations <strong>of</strong> 0.92, be<strong>in</strong>g similar to<br />
those estimated for geese bred <strong>in</strong> Canada where h 2 <strong>of</strong> body weight at different ages<br />
ranged from 0.41 to 0.77 [Shrestha <strong>and</strong> Grunder 2006], <strong>and</strong> <strong>in</strong> Pol<strong>and</strong>, where the<br />
respective h 2 was found to vary from 0.35 to 0.51 [Rosiński 2000]. Lower heritability<br />
<strong>of</strong> body weight (0.18) was reported by Yeh et al. [1999] for White Roman geese <strong>in</strong><br />
Taiwan. Szwaczkowski et al. [2007] apply<strong>in</strong>g a s<strong>in</strong>gle trait animal model, estimated<br />
Table 2. Heritability estimates (bolded <strong>and</strong> underl<strong>in</strong>ed) with st<strong>and</strong>ard errors <strong>and</strong> genetic (above<br />
diagonal) <strong>and</strong> phenotypic (below diagonal) correlation coefficients among <strong>production</strong> <strong>and</strong><br />
re<strong>production</strong> <strong>traits</strong> <strong>in</strong> W11 geese<br />
Trait BW8 BW11 EP EW PFE PHC<br />
BW8 0.64 (±0.05) 0.67 -0.10 0.24 -0.01 -0.03<br />
BW11 0.45** 0.50 (±0.05) -0.05 -0.02 -0.20 -0.15<br />
EP 0.20** 0.29** 0.47 (±0.06) -0.63 0.37 0.20<br />
EW 0.12** 0.12** -0.29** 0.49 (±0.06) -0.22 -0.25<br />
PFE 0.04 0.04 0.19** -0.07* 0.08 (±0.05) 0.96<br />
PHC 0.03 -0.05 0.03 -0.05 0.91** 0.09 (±0.06)<br />
74
<strong>Genetic</strong> <strong>evaluation</strong> <strong>of</strong> <strong>production</strong> <strong>and</strong> re<strong>production</strong> <strong>traits</strong> <strong>in</strong> geese<br />
Table 3. Heritability estimates (bolded <strong>and</strong> underl<strong>in</strong>ed) with st<strong>and</strong>ard errors <strong>and</strong> genetic (above<br />
diagonal) <strong>and</strong> phenotypic (below diagonal) correlation coefficients among <strong>production</strong> <strong>and</strong><br />
re<strong>production</strong> <strong>traits</strong> <strong>in</strong> W33 geese<br />
Trait BW8 BW11 EP EW PFE PHC<br />
BW8 0.76 (±0.09) 0.67 0.30 0.61 -0.31 -0.49<br />
BW11 0.72** 0.46 (±0.08) 0.02 0.44 -0.02 -0.29<br />
EP -0.01 0.32** 0.30 (±0.09) 0.84 -0.51 -0.25<br />
EW 0.35** 0.39** 0.32** 0.23 (±0.14) -0.48 -0.48<br />
PFE 0.00 -0.05 0.01 0.08 0.02 (±0.08) 0.85<br />
PHC -0.02 -0.08* 0.02 0.05 0.90** 0.05 (±0.08)<br />
**P≤0.01.<br />
the direct heritability <strong>of</strong> body weight <strong>in</strong> geese to range between 0.0001 <strong>and</strong> 0.55<br />
depend<strong>in</strong>g on the model used.<br />
Different body weight h 2 estimates given by different authors result from<br />
population structure (selected vs unselected), environmental conditions (domesticated<br />
vs wild birds), algorithm employed <strong>and</strong> statistical vs genetic model used [Larsson<br />
1993, Rosiński et al. 2000, Szwaczkowski 2007].<br />
Heritabilities <strong>of</strong> egg <strong>production</strong> <strong>traits</strong> estimated <strong>in</strong> the current report (Tab. 2 <strong>and</strong> 3)<br />
are higher than those (0.21-0.40) shown by Rosiński [2000] <strong>and</strong> Shrestha <strong>and</strong> Grunder<br />
[2006]. Lowest heritability estimates were obta<strong>in</strong>ed for reproductive <strong>traits</strong> (PFE <strong>and</strong><br />
PHC). It corresponds with the report by Shrestha <strong>and</strong> Grunder [2006]. Low h 2 values<br />
determ<strong>in</strong>e a limited possibility <strong>of</strong> genetic ga<strong>in</strong> <strong>in</strong> these <strong>traits</strong>. Lower estimates could<br />
also result from deviations from normality observed for these <strong>traits</strong> which may cause<br />
overestimation <strong>of</strong> residual variance. From theoretical perspective threshold animal<br />
model would be more appropriate for studies on fertility-related <strong>traits</strong>. However,<br />
l<strong>in</strong>ear-threshold analysis still creates many methodological <strong>and</strong> computational<br />
problems. Moreover, some authors [Jamrozik et al. 1991, Varona et al. 1999] did<br />
not confirm advantage <strong>of</strong> threshold model over l<strong>in</strong>ear one to analyse a discrete<br />
re<strong>production</strong> characters. Another approach proposed [e.g. Szwaczkowski et al. 2000]<br />
is data transformation with the use <strong>of</strong> the Bliss degree that can be directly applied<br />
for s<strong>in</strong>gle trait analysis. In case, however, <strong>of</strong> multitrait analysis, a multidimensional<br />
normal distribution should be assumed. Thus, simultaneous transformation <strong>of</strong> all <strong>traits</strong><br />
studied should be done.<br />
In this study genetic correlations were mostly <strong>in</strong> accordance with phenotypic ones.<br />
As expected, the highest genetic <strong>and</strong> phenotypic correlations were found between <strong>two</strong><br />
re<strong>production</strong> <strong>traits</strong> – fertility (PFE) <strong>and</strong> hatchability (PHC). Relatively high positive<br />
correlations have been observed for BW8 <strong>and</strong> BW11. Positive relationships were<br />
estimated between body weight <strong>and</strong> egg weight as well.<br />
Significant phenotypic correlations were also found between both body weights<br />
<strong>and</strong> EW, whereas the sign <strong>of</strong> relationship between EP <strong>and</strong> EW <strong>and</strong> egg <strong>production</strong><br />
75
A. Wolc et al.<br />
was <strong>in</strong>verse between the l<strong>in</strong>es. Correlations between EP <strong>and</strong> FER or PHC were<br />
<strong>in</strong>consistent which confirms results <strong>of</strong> Shrestha <strong>and</strong> Grunder [2006] concern<strong>in</strong>g<br />
fertility (0 to -0.40) <strong>and</strong> hatchability (0.38 to -0.12). Generally, the antagonistic<br />
correlations between productive <strong>and</strong> reproductive <strong>traits</strong> were found <strong>in</strong> the other species<br />
<strong>of</strong> poultry [Szwaczkowski 2003] <strong>and</strong> livestock [Roxström et al. 2001, Jagusiak 2005].<br />
More negative associations between productive <strong>and</strong> reproductive <strong>traits</strong> were found<br />
<strong>in</strong> paternal W33 compared with maternal W11 l<strong>in</strong>e. It seems that goose breed<strong>in</strong>g<br />
programmes need to consider both <strong>production</strong> <strong>and</strong> re<strong>production</strong> <strong>traits</strong> if fertility is to<br />
be ma<strong>in</strong>ta<strong>in</strong>ed <strong>and</strong> further <strong>in</strong>creased <strong>production</strong> achieved.<br />
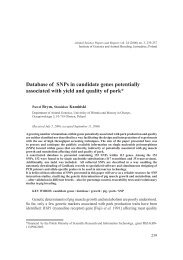
Fig. 1. <strong>Genetic</strong> trends <strong>in</strong> W11 geese.<br />
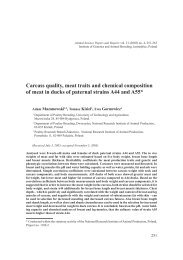
Fig. 2. <strong>Genetic</strong> trends <strong>in</strong> W33 geese.<br />
76
<strong>Genetic</strong> <strong>evaluation</strong> <strong>of</strong> <strong>production</strong> <strong>and</strong> re<strong>production</strong> <strong>traits</strong> <strong>in</strong> geese<br />
In neither l<strong>in</strong>e regularities <strong>of</strong> changes <strong>in</strong> mean breed<strong>in</strong>g values were recorded<br />
(Fig. 1 <strong>and</strong> 2). <strong>Genetic</strong> trend r<strong>and</strong>omly fluctuated around zero.<br />
Currently, genetic parametres <strong>in</strong> the analysed populations are estimated with<strong>in</strong><br />
generation based on sire+dam model. Such approach ignores <strong>in</strong>formation from<br />
previous generations <strong>and</strong> relationships between birds other than full <strong>and</strong> half-sib<br />
families. <strong>Genetic</strong> relationship between <strong>traits</strong> is taken <strong>in</strong>to account <strong>in</strong> the selection <strong>in</strong>dex.<br />
However, it is not properly accounted for <strong>in</strong> predict<strong>in</strong>g <strong>of</strong> breed<strong>in</strong>g value. Suboptimal<br />
methods <strong>of</strong> prediction the breed<strong>in</strong>g value may contribute to low selection accuracy<br />
<strong>and</strong> reduced genetic ga<strong>in</strong> expressed as lack <strong>of</strong> clear genetic trend for the studied <strong>traits</strong>.<br />
Therefore, as suggested by many authors for other species, the multitrait animal<br />
model methodology (<strong>in</strong>clud<strong>in</strong>g both productive <strong>and</strong> reproductive characters) should<br />
be implemented for breed<strong>in</strong>g value prediction <strong>in</strong> geese. To enable across-generation<br />
<strong>evaluation</strong> the unique <strong>and</strong> consistent number<strong>in</strong>g <strong>of</strong> birds would be necessary.<br />
Acknowledgement. The authors are grateful to Dr. Kar<strong>in</strong> Meyer for supply<strong>in</strong>g the<br />
set <strong>of</strong> DFREML programmes.<br />
1.<br />
2.<br />
3.<br />
4.<br />
5.<br />
6.<br />
7.<br />
8.<br />
9.<br />
10.<br />
11.<br />
References<br />
JAGUSIAK W., 2005 – Fertility measures <strong>in</strong> Polish Black-<strong>and</strong>-White cattle. 3. Phenotypic <strong>and</strong><br />
genetic correlations between fertility <strong>and</strong> milk <strong>production</strong> <strong>traits</strong>. Journal <strong>of</strong> Animal <strong>and</strong> Feed<br />
Sciences 15, 371-380.<br />
JAMROZIK J., SCHAEFFER L.R., BURNSIDE E.B., SULLIVAN B.P., 1991 – Threshold models<br />
applied to Holste<strong>in</strong> conformation <strong>traits</strong>. Journal <strong>of</strong> Dairy Science 74, 3196-3201.<br />
LARSSON K., 1993 – Inheritance <strong>of</strong> body size <strong>in</strong> the Barnacle Goose under different environmental<br />
conditions. Journal <strong>of</strong> Evolutionary Biology 6, 195-208.<br />
LARZUL C., ROUVIER R., ROUSSELOT-PAILLEY D., GUY G., 2000 – Estimation <strong>of</strong> genetic<br />
parameters for growth, carcass <strong>and</strong> overfeed<strong>in</strong>g <strong>traits</strong> <strong>in</strong> a white geese stra<strong>in</strong>. <strong>Genetic</strong>s, Selection,<br />
Evolution 32,415-427.<br />
MEYER K., 2001 – DFREML ver. 3.1. University <strong>of</strong> New Engl<strong>and</strong>, Australia.<br />
ROSIŃSKI A., 2000 – Analysis <strong>of</strong> direct <strong>and</strong> correlated effects <strong>of</strong> selection <strong>in</strong> <strong>two</strong> goose stra<strong>in</strong>s.<br />
Annales <strong>of</strong> Agricultural University <strong>of</strong> Poznan, Pol<strong>and</strong>, 309.<br />
ROXSTRŐM A., STRANDBERG E., BERGLUND B., EMANUELSON U., PHILIPSSON J.,<br />
2001 – <strong>Genetic</strong> <strong>and</strong> environmental correlations among female fertility <strong>traits</strong> <strong>and</strong> milk <strong>production</strong> <strong>in</strong><br />
different parities <strong>of</strong> Swedish Red <strong>and</strong> White dairy cattle. Acta Agriculturae Sc<strong>and</strong><strong>in</strong>avica, Section<br />
A, Animal Science 51, 7-14.<br />
SAS INSTITUTE INC., 2002-2003 – The SAS System for L<strong>in</strong>ux version 9.1, Cary, NC 27513-2414<br />
USA.<br />
SHRESTHA J.N.B, GRUNDER A.A., 2006 – Goose breed<strong>in</strong>g <strong>and</strong> <strong>production</strong> <strong>in</strong> Canada. CAB<br />
Reviews: Perspectives <strong>in</strong> Agriculture, Veter<strong>in</strong>ary Science, Nutrition <strong>and</strong> Natural Resources 1<br />
(007), 12.<br />
SHRESTHA J.N.B., GRUNDER A.A., DICKIE J.W., 2004 – Multi-trait selection for body weight,<br />
egg <strong>production</strong> <strong>and</strong> total fat <strong>in</strong> the Ch<strong>in</strong>ese <strong>and</strong> Synthetic stra<strong>in</strong>s <strong>of</strong> geese. Canadian Journal <strong>of</strong><br />
Animal Science 84, 197-209.<br />
SMITH S.P., GRASER H.U., 1986 – Estimat<strong>in</strong>g variance components <strong>in</strong> a class <strong>of</strong> mixed models by<br />
restricted maximum likelihood. Journal <strong>of</strong> Dairy Science 69, 1156-1165.<br />
77
A. Wolc et al.<br />
12. SZWACZKOWSKI T., 2003 – Use <strong>of</strong> Mixed Model Methodology <strong>in</strong> Poultry Breed<strong>in</strong>g: Estimation<br />
<strong>of</strong> <strong>Genetic</strong> Parametres. In: Poultry <strong>Genetic</strong>s, Breed<strong>in</strong>g <strong>and</strong> Biotechnology (W.M. Muir <strong>and</strong> S.E.<br />
Aggrey, Eds.). CAB International, 11, 165-201.<br />
13. SZWACZKOWSKI T., WĘŻYK S., PIOTROWSKI P., CYWA-BENKO K. 2000 – Direct <strong>and</strong><br />
maternal genetic <strong>and</strong> environmental effects for fertility <strong>and</strong> hatchability <strong>in</strong> lay<strong>in</strong>g hens. Archiv für<br />
Geflügelkunde 64, 115-120.<br />
14. SZWACZKOWSKI T., WĘŻYK S., STANISŁAWSKA-BARCZAK E., BADOWSKI J.,<br />
BIELIŃSKA H., WOLC A., 2007 – <strong>Genetic</strong> variability <strong>of</strong> body weight <strong>in</strong> <strong>two</strong> goose stra<strong>in</strong>s under<br />
long-term selection. Journal <strong>of</strong> Applied <strong>Genetic</strong>s 48, 253-260<br />
15. VARONA L., MISZTAL I., BERTRAND J.K., 1999 – Threshold-l<strong>in</strong>ear versus l<strong>in</strong>ear-l<strong>in</strong>ear<br />
analysis <strong>of</strong> birth weight <strong>and</strong> calv<strong>in</strong>g ease us<strong>in</strong>g an animal model: II. Comparison <strong>of</strong> models. Journal<br />
<strong>of</strong> Animal Science 77, 2003-2007.<br />
16. WĘŻYK S., 1978 – System SELEKT dla stad zarodowych drobiu (The SELEKT System for the<br />
pedigree poultry flocks). In Polish. Wyniki Prac Badawczych Zakładu Hodowli Drobiu Instytutu<br />
Zootechniki 7, 7-22.<br />
17. YEH L.T., CHIOU T.S., WANG S.D., WU K.C., CHANG H.L., CHENG Y.H., 1999 – Goose<br />
breed<strong>in</strong>g: progress <strong>and</strong> prospect for improvement <strong>of</strong> egg <strong>production</strong> <strong>in</strong> White Roman geese.<br />
Proceed<strong>in</strong>gs <strong>of</strong> the Symposium on Scientific Cooperation <strong>in</strong> Agriculture between INRA (France) <strong>and</strong><br />
COA (Taiwan, ROC). April 19-20, Toulouse, France, 117-122.<br />
Anna Wolc, Elżbieta Barczak, Stanisław Wężyk, Jakub Badowski,<br />
Hal<strong>in</strong>a Bielińska, Tomasz Szwaczkowski<br />
Wielocechowa ocena wartości genetycznej gęsi<br />
pod względem cech produkcyjnych i reprodukcyjnych<br />
S t r e s z c z e n i e<br />
Oszacowano odziedziczalność i korelacje genetyczne między cechami produkcyjnymi w dwóch<br />
rodach gęsi (BW8 i BW11). Ponadto wyznaczono trendy genetyczne i fenotypowe dla badanych cech, które<br />
obejmowały: masę ciała w 8 i 11 tygodniu życia (BW8 i BW11), nieśności (EP), masę jaja (EW), procent<br />
zapłodnienia (PFE) i procent wylęgu z jaj zapłodnionych (PHC). Analizę przeprowadzono za pomocą<br />
wielocechowego modelu zwierzęcia. Współczynniki odziedziczalności dla masy ciała i nieśności przyjęły<br />
średnie wartości w obu rodach. Najniższe wartości h 2 uzyskano dla cech reprodukcyjnych. Najwyższe<br />
dodatnie korelacje wykazano wśród cech reprodukcyjnych (PFE i PHC) oraz dwóch pomiarów masy ciała<br />
(BW8 i BW11). Trendy genetyczne we wszystkich badanych cechach były niewielkie i nieukierunkowane.<br />
Generalnie, przeprowadzone badania potwierdziły istnienie niekorzystnych zależności między cechami<br />
produkcyjnymi a reprodukcyjnymi.<br />
78