An assessment of the causes of malnutrition in Ethiopia: A ...
An assessment of the causes of malnutrition in Ethiopia: A ...
An assessment of the causes of malnutrition in Ethiopia: A ...

Create successful ePaper yourself
Turn your PDF publications into a flip-book with our unique Google optimized e-Paper software.
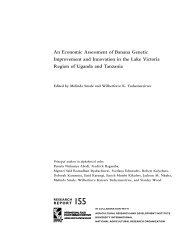
Figure 5.3: Trends <strong>in</strong> latr<strong>in</strong>e coverage <strong>in</strong> <strong>Ethiopia</strong>, 1970 – 2002.<br />
Coverage, %<br />
80<br />
70<br />
60<br />
50<br />
40<br />
30<br />
20<br />
10<br />
0<br />
Urban<br />
National<br />
Rural<br />
1965 1970 1975 1980 1985 1990 1995 2000 2005<br />
person per day for <strong>the</strong> country as a whole. The m<strong>in</strong>imum guidel<strong>in</strong>es for <strong>the</strong> provision <strong>of</strong> safe<br />
water are to have basic access to at least 20 liter per person per day when <strong>the</strong> water source is<br />
with<strong>in</strong> 100 to 1000 m <strong>of</strong> <strong>the</strong> residence, and 50 liters if <strong>the</strong> water source is with<strong>in</strong> 100 m <strong>of</strong> <strong>the</strong><br />
residence. Clearly, <strong>the</strong> water consumption <strong>of</strong> most <strong>Ethiopia</strong>ns does not meet <strong>the</strong>se m<strong>in</strong>imum<br />
targets.<br />
The geographical proximity <strong>of</strong> dr<strong>in</strong>k<strong>in</strong>g water sources is a key factor <strong>in</strong> determ<strong>in</strong><strong>in</strong>g<br />
<strong>the</strong> amount <strong>of</strong> dr<strong>in</strong>k<strong>in</strong>g water a household consumes. National data for <strong>Ethiopia</strong> <strong>in</strong>dicates that<br />
about 64 percent <strong>of</strong> <strong>the</strong> rural population has access with<strong>in</strong> 1 km from any source <strong>of</strong> water,<br />
while only 4 percent had to fetch water from more than 5 km away. The 2000 DHS <strong>of</strong><br />
<strong>Ethiopia</strong> <strong>in</strong>dicated 53 percent <strong>of</strong> urban households, 21 percent <strong>of</strong> rural households, and 26<br />
percent <strong>of</strong> all households had access to a safe water sources with<strong>in</strong> less than 15 m<strong>in</strong>utes<br />
walk<strong>in</strong>g distance. Accessibility for urban centers was found to be less than 200 meters.<br />
Although accessibility <strong>in</strong> rural and urban areas is very different, <strong>the</strong> average amount <strong>of</strong><br />
dr<strong>in</strong>k<strong>in</strong>g water consumed per day per <strong>in</strong>dividual <strong>in</strong> ei<strong>the</strong>r location is m<strong>in</strong>imal. The type <strong>of</strong><br />
water source and preferences, wait<strong>in</strong>g time, service fee, and source functionality could<br />
expla<strong>in</strong> <strong>the</strong> variation <strong>in</strong> <strong>the</strong> amount <strong>of</strong> water collected and consumed.<br />
5.3.3.4. Trends <strong>in</strong> latr<strong>in</strong>e provision <strong>in</strong> <strong>Ethiopia</strong><br />
The <strong>in</strong>discrim<strong>in</strong>ate contam<strong>in</strong>ation <strong>of</strong> <strong>the</strong> immediate environment by fecal matter<br />
transmits communicable diseases that affect <strong>the</strong> nutritional status <strong>of</strong> children. The provision<br />
<strong>of</strong> latr<strong>in</strong>e coverage <strong>in</strong> <strong>Ethiopia</strong> is one <strong>of</strong> <strong>the</strong> lowest <strong>in</strong> <strong>the</strong> world. A time series analysis<br />
<strong>in</strong>dicated that <strong>the</strong> association between time and latr<strong>in</strong>e coverage is very weak to detect any<br />
mean<strong>in</strong>gful change <strong>in</strong> <strong>Ethiopia</strong> (Figure 5.3). The weakest association was seen for rural areas.<br />
The <strong>in</strong>crease rate <strong>in</strong> <strong>the</strong> proportion <strong>of</strong> population coverage <strong>in</strong> latr<strong>in</strong>e use was less than 0.2<br />
percent per year over <strong>the</strong> last 30 years at national level. Current latr<strong>in</strong>e coverage for rural,<br />
urban, and <strong>the</strong> country as a whole is 7 percent, 68 percent and 15 percent, respectively.<br />
Latr<strong>in</strong>e use coverage is very low with <strong>in</strong>significant changes over time when compared to<br />
figures for similar countries <strong>in</strong> East Africa (WHO 2000).<br />
5.3.3.5. Waste management<br />
Waste management <strong>in</strong> its all aspect, whe<strong>the</strong>r solid or liquid waste, is very poor <strong>in</strong><br />
<strong>Ethiopia</strong>. The situation is much worse <strong>in</strong> urban areas where a significant amount <strong>of</strong> waste is<br />
produced and improperly handled. Although Addis Ababa and regional state capitals look to<br />
be <strong>in</strong> a better position to access waste management services and <strong>in</strong>frastructure, <strong>the</strong>re is real<br />
concern about <strong>the</strong> quality <strong>of</strong> <strong>the</strong> service. Generally, not more than 5 percent <strong>of</strong> <strong>the</strong> entire<br />
population has access to organized solid waste collection and disposal. In <strong>the</strong> capital city, an<br />
152