An assessment of the causes of malnutrition in Ethiopia: A ...
An assessment of the causes of malnutrition in Ethiopia: A ...
An assessment of the causes of malnutrition in Ethiopia: A ...

Create successful ePaper yourself
Turn your PDF publications into a flip-book with our unique Google optimized e-Paper software.
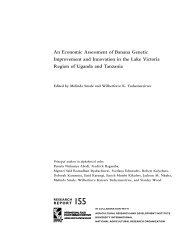
Figure 4.11: Stunt<strong>in</strong>g, wast<strong>in</strong>g, and underweight prevalence <strong>in</strong> preschoolers <strong>in</strong> <strong>Ethiopia</strong>,<br />
by age.<br />
Source: CSA, USAID, & ORC Macro 2001<br />
Contrary to <strong>the</strong> common misconception, child <strong>malnutrition</strong> is most commonly a<br />
reflection <strong>of</strong> poor car<strong>in</strong>g practices, not a shortage <strong>in</strong> food supply. Trends <strong>of</strong> childhood<br />
<strong>malnutrition</strong> <strong>in</strong>dicate that even though <strong>the</strong> rate <strong>of</strong> <strong>malnutrition</strong> seems to have decreased<br />
m<strong>in</strong>imally <strong>in</strong> 2000 from what it was <strong>in</strong> 1992, it is still <strong>the</strong> highest rate <strong>in</strong> sub-Sahara Africa.<br />
(<strong>Ethiopia</strong>n PROFILES Team & AED/L<strong>in</strong>kages 2005) Regardless <strong>of</strong> small variations from<br />
year to year, <strong>the</strong> high prevalence <strong>of</strong> stunt<strong>in</strong>g <strong>in</strong> under five children is an <strong>in</strong>dicator not only <strong>of</strong><br />
chronic food <strong>in</strong>security but also <strong>of</strong> <strong>the</strong> prevalence <strong>of</strong> poor car<strong>in</strong>g practices (Figure 4.12).<br />
The fact that car<strong>in</strong>g practices are poor <strong>in</strong> <strong>the</strong> country is reflected by Figure 4.13.<br />
Stunt<strong>in</strong>g is higher <strong>in</strong> <strong>the</strong> regions that are more fertile and productive as compared to <strong>the</strong><br />
drought prone and less-productive regions. For example, <strong>the</strong> highest rate <strong>of</strong> stunt<strong>in</strong>g was seen<br />
<strong>in</strong> <strong>the</strong> Amhara region (57 percent) followed by SNNP (55 percent), Tigray (55 percent), and<br />
Oromia (47 percent). Stunt<strong>in</strong>g is an <strong>in</strong>dicator <strong>of</strong> chronic <strong>malnutrition</strong> ra<strong>the</strong>r than acute food<br />
shortages, a factor <strong>of</strong> which is poor car<strong>in</strong>g practices <strong>in</strong> <strong>the</strong> community. This <strong>in</strong>dicates that<br />
Figure 4.12: Trends <strong>in</strong> <strong>malnutrition</strong> <strong>in</strong> under-fives <strong>in</strong> <strong>Ethiopia</strong>, 1982-2000<br />
70<br />
60<br />
50<br />
Stunt<strong>in</strong>g<br />
Wast<strong>in</strong>g<br />
Underweight<br />
percent<br />
40<br />
30<br />
20<br />
10<br />
0<br />
1982 1992 2000<br />
102