Impact Of Agricultural Market Reforms On Smallholder Farmers In ...
Impact Of Agricultural Market Reforms On Smallholder Farmers In ... Impact Of Agricultural Market Reforms On Smallholder Farmers In ...
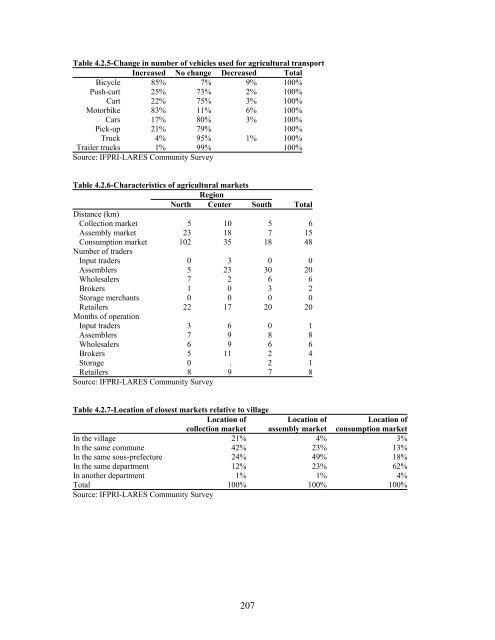
Table 4.2.5-Change in number of vehicles used for agricultural transport Increased No change Decreased Total Bicycle 85% 7% 9% 100% Push-cart 25% 73% 2% 100% Cart 22% 75% 3% 100% Motorbike 83% 11% 6% 100% Cars 17% 80% 3% 100% Pick-up 21% 79% 100% Truck 4% 95% 1% 100% Trailer trucks 1% 99% 100% Source: IFPRI-LARES Community Survey Table 4.2.6-Characteristics of agricultural markets Region North Center South Total Distance (km) Collection market 5 10 5 6 Assembly market 23 18 7 15 Consumption market 102 35 18 48 Number of traders Input traders 0 3 0 0 Assemblers 5 23 30 20 Wholesalers 7 2 6 6 Brokers 1 0 3 2 Storage merchants 0 0 0 0 Retailers 22 17 20 20 Months of operation Input traders 3 6 0 1 Assemblers 7 9 8 8 Wholesalers 6 9 6 6 Brokers 5 11 2 4 Storage 0 . 2 1 Retailers 8 9 7 8 Source: IFPRI-LARES Community Survey Table 4.2.7-Location of closest markets relative to village Location of Location of Location of collection market assembly market consumption market In the village 21% 4% 3% In the same commune 42% 23% 13% In the same sous-prefecture 24% 49% 18% In the same department 12% 23% 62% In another department 1% 1% 4% Total 100% 100% 100% Source: IFPRI-LARES Community Survey 207
Table 4.2.8-Frequency of closest markets Frequency Frequency Frequency collection market assembly market consumption market Daily 1% Every 2 days 4% 12% Every 3 days 4% 6% 4% Every 4 days 37% 47% 35% Every 5 days 33% 33% 32% Every 6 days 12% 6% 10% Every week 9% 9% 8% Total 100% 100% 100% Source: IFPRI-LARES Community Survey Table 4.2.9-Change in volume of markets Change in volume of collection market Change in volume of assembly market Change in volume of consumption market Increased 77% 83% 88% No change 14% 10% 8% Decreased 9% 7% 4% Total 100% 100% 100% Source: IFPRI-LARES Community Survey Table 4.2.10-Change in facilities of markets Increased No change Decreased Total Number of warehouses Collection market 51% 46% 3% 100% Assembly market 61% 39% 100% Consumption market 77% 21% 1% 100% Number of stores Collection market 13% 86% 1% 100% Assembly market 38% 62% 100% Consumption market 64% 36% 100% Number of telephones Collection market 7% 93% 100% Assembly market 9% 91% 100% Consumption market 31% 69% 100% Access to water Collection market 29% 69% 2% 100% Assembly market 35% 60% 5% 100% Consumption market 52% 45% 3% 100% Source: IFPRI-LARES Community Survey Table 4.2.11-Change in number of traders Change in number of input traders Change in number of assemblers Change in number of wholesalers Change in number of brokers Change in number of storage merchants Change in number of retailers Increased 1% 41% 24% 15% 2% 53% No change 98% 48% 72% 85% 97% 38% Decreased 1% 10% 4% 1% 1% 9% Total 100% 100% 100% 100% 100% 100% Source: IFPRI-LARES Community Survey 208
- Page 164 and 165: Table 4.1.75-Allocation of labor by
- Page 166 and 167: Table 4.1.82-Allocation of labor by
- Page 168 and 169: Table 4.1.89-Change in credit avail
- Page 170 and 171: Table 4.1.94-Percent of households
- Page 172 and 173: Table 4.1.98-Percent of households
- Page 174 and 175: Table 4.1.102-Area allocation by cr
- Page 176 and 177: Table 4.1.106-Area allocation by cr
- Page 178 and 179: Table 4.1.110-Marketed share of out
- Page 180 and 181: Table 4.1.114-Marketed share of out
- Page 182 and 183: Table 4.1.117-Regression for market
- Page 184 and 185: Table 4.1.120-Change in the type of
- Page 186 and 187: Table 4.1.128-Perceived change in r
- Page 188 and 189: Table 4.1.135-Main reason for stori
- Page 190 and 191: Table 4.1.140-Summary of food expen
- Page 192 and 193: Table 4.1.142-Percent of households
- Page 194 and 195: Table 4.1.144-Food consumption by e
- Page 196 and 197: Table 4.1.149-Results of regression
- Page 198 and 199: Table 4.1.152-Value of household as
- Page 200 and 201: Table 4.1.156-Value of household as
- Page 202 and 203: Table 4.1.160-Housing characteristi
- Page 204 and 205: Table 4.1.162-Housing characteristi
- Page 206 and 207: Table 4.1.165-Main source of water
- Page 208 and 209: Table 4.1.170-Source of information
- Page 210 and 211: Table 4.1.176-Source of information
- Page 212 and 213: Table 4.1.181-Regression for percei
- Page 216 and 217: Table 4.2.12-Availability and sourc
- Page 218 and 219: Table 4.2.21-Number of GFs per vill
- Page 220 and 221: Table 4.2.30-Percentage of villages
- Page 222 and 223: Table 4.2.34-Distribution of villag
- Page 224 and 225: Table 4.3.1-Distribution of GVs by
- Page 226 and 227: Table 4.3.9-Number of each type of
- Page 228 and 229: Table 4.3.12-Percentage of secretar
- Page 230 and 231: Table 4.3.19-Distribution of GVs by
- Page 232 and 233: Table 4.3.24-Percentage of inputs s
- Page 234 and 235: Table 4.3.32-Average value of curre
- Page 236 and 237: Table 4.3.40-Percentage of GVs in w
- Page 238 and 239: CHAPTER 5 - RESULTS FROM THE MALAWI
- Page 240 and 241: The weights are used to calculate a
- Page 242 and 243: On average, around 20 percent of th
- Page 244 and 245: agricultural work. Other less commo
- Page 246 and 247: 5.1.4 Time allocation In Malawi, as
- Page 248 and 249: attributed it to the fact that fert
- Page 250 and 251: insignificant. The coefficient on t
- Page 252 and 253: As in the results from the previous
- Page 254 and 255: most important sources of input on
- Page 256 and 257: applied for credit compared to 20 p
- Page 258 and 259: less than 1 mt per ha which are fai
- Page 260 and 261: 5.1.9 Agricultural marketing Market
- Page 262 and 263: Households that belong to a club al
Table 4.2.5-Change in number of vehicles used for agricultural transport<br />
<strong>In</strong>creased No change Decreased Total<br />
Bicycle 85% 7% 9% 100%<br />
Push-cart 25% 73% 2% 100%<br />
Cart 22% 75% 3% 100%<br />
Motorbike 83% 11% 6% 100%<br />
Cars 17% 80% 3% 100%<br />
Pick-up 21% 79% 100%<br />
Truck 4% 95% 1% 100%<br />
Trailer trucks 1% 99% 100%<br />
Source: IFPRI-LARES Community Survey<br />
Table 4.2.6-Characteristics of agricultural markets<br />
Region<br />
North Center South Total<br />
Distance (km)<br />
Collection market 5 10 5 6<br />
Assembly market 23 18 7 15<br />
Consumption market 102 35 18 48<br />
Number of traders<br />
<strong>In</strong>put traders 0 3 0 0<br />
Assemblers 5 23 30 20<br />
Wholesalers 7 2 6 6<br />
Brokers 1 0 3 2<br />
Storage merchants 0 0 0 0<br />
Retailers 22 17 20 20<br />
Months of operation<br />
<strong>In</strong>put traders 3 6 0 1<br />
Assemblers 7 9 8 8<br />
Wholesalers 6 9 6 6<br />
Brokers 5 11 2 4<br />
Storage 0 . 2 1<br />
Retailers 8 9 7 8<br />
Source: IFPRI-LARES Community Survey<br />
Table 4.2.7-Location of closest markets relative to village<br />
Location of<br />
Location of<br />
Location of<br />
collection market assembly market consumption market<br />
<strong>In</strong> the village 21% 4% 3%<br />
<strong>In</strong> the same commune 42% 23% 13%<br />
<strong>In</strong> the same sous-prefecture 24% 49% 18%<br />
<strong>In</strong> the same department 12% 23% 62%<br />
<strong>In</strong> another department 1% 1% 4%<br />
Total 100% 100% 100%<br />
Source: IFPRI-LARES Community Survey<br />
207


