Impact Of Agricultural Market Reforms On Smallholder Farmers In ...
Impact Of Agricultural Market Reforms On Smallholder Farmers In ... Impact Of Agricultural Market Reforms On Smallholder Farmers In ...
Table 4.1.106-Area allocation by crop and expenditure category Expenditure category (quintile) Poorest 2 3 4 Richest Maize 38% 45% 32% 31% 39% Sorghum/millet 11% 6% 7% 6% 4% Rice 1% 1% 0% 1% 0% Cowpeas 7% 8% 8% 8% 6% Groundnuts 4% 4% 5% 7% 7% Manioc 9% 9% 8% 8% 14% Yams 4% 3% 3% 3% 1% Sweet potatoes 0% 0% 0% 0% 0% Tomatoes 1% 2% 1% 2% 2% Okra 1% 1% 1% 2% 1% Hot pepper 1% 1% 1% 2% 2% Other vegetables 0% 0% 1% 2% 1% Cotton 17% 15% 25% 22% 13% Other crops 5% 5% 9% 8% 10% Total 100% 100% 100% 100% 100% Area (ha) 2.97 4.16 4.04 5.20 5.00 Source: IFPRI-LARES Small Farmer Survey. Note: Intercropped area divided equally among crops Table 4.1.107-Proportion of households growing each crop by farm size category Farm size category (quintile) Smallest 2 3 4 Largest Maize 75% 91% 92% 97% 97% Sorghum/millet 11% 26% 27% 42% 46% Rice . 5% 6% 11% 16% Cowpeas 30% 44% 50% 55% 75% Groundnuts 13% 22% 23% 33% 50% Manioc 53% 65% 65% 57% 63% Yams 11% 27% 29% 43% 62% Sweet potatoes 6% 10% 4% 3% 4% Tomatoes 10% 21% 23% 20% 33% Okra 4% 11% 19% 27% 46% Hot pepper 25% 11% 13% 11% 27% Other vegetables 23% 4% 9% 12% 20% Cotton 7% 21% 31% 46% 70% Other crops 11% 17% 27% 31% 38% Source: IFPRI-LARES Small Farmer Survey. 169
Table 4.1.108-Area allocation by crop and farm size category Farm size category (quintile) Smallest 2 3 4 Largest Maize 42% 52% 44% 40% 30% Sorghum/millet 4% 5% 5% 7% 6% Rice . 0% 0% 1% 1% Cowpeas 11% 8% 6% 6% 8% Groundnuts 5% 4% 4% 6% 6% Manioc 13% 11% 11% 9% 9% Yams 4% 3% 2% 3% 2% Sweet potatoes 1% 0% 0% 0% 0% Tomatoes 2% 2% 3% 2% 1% Okra 0% 1% 1% 2% 1% Hot pepper 4% 1% 1% 1% 2% Other vegetables 4% 0% 1% 1% 1% Cotton 5% 9% 13% 17% 23% Other crops 4% 3% 6% 7% 9% Total 100% 100% 100% 100% 100% Area (ha) .65 1.99 3.11 5.20 10.36 Source: IFPRI-LARES Small Farmer Survey. Note: Intercropped area divided equally among crops. Table 4.1.109-Summary of marketing patterns by crop Share of Share of Share of Value of Value of Sales as households growers households production sales percentage of growing (%) selling (%) selling (%) (1000 F/farm) (1000 F/farm) production Maize 89% 66% 58% 237 109 46% Sorghum/millet 36% 34% 13% 37 4 11% Rice 7% 69% 5% 4 1 43% Cowpeas 48% 66% 32% 33 17 53% Groundnuts 27% 95% 26% 31 23 74% Manioc 35% 76% 27% 154 129 84% Yams 34% 54% 18% 97 10 11% Sweet potatoes 5% 67% 3% 2 1 71% Tomatoes 19% 97% 19% 26 23 91% Okra 17% 69% 12% 4 2 69% Hot pepper 14% 93% 13% 10 8 85% Other vegetables 14% 88% 12% 21 20 95% Cotton 34% 100% 34% 192 192 100% Other crops 20% 75% 15% 27 23 85% Total . . . 880 570 65% Source: IFPRI/LARES Small Farmer Survey. 170
- Page 126 and 127: 4.3.2 Survey methods At the time of
- Page 128 and 129: officers have CM2 certificates. Thi
- Page 130 and 131: Suppliers The GV representatives we
- Page 132 and 133: Cotton area per GV ranges from 145
- Page 134 and 135: The largest cost items are schools
- Page 136 and 137: members and 10 percent of the membe
- Page 138 and 139: Table 4.1.1-Description of sample o
- Page 140 and 141: Table 4.1.7-Age, education, and lit
- Page 142 and 143: Table 4.1.13-Ethnic background of h
- Page 144 and 145: Table 4.1.19-Importance of each sou
- Page 146 and 147: Table 4.1.25-Number of plots and ar
- Page 148 and 149: Table 4.1.31-Land tenure by expendi
- Page 150 and 151: Table 4.1.37-Change in labor alloca
- Page 152 and 153: Table 4.1.42-Seed use by sex of hea
- Page 154 and 155: Table 4.1.47-Perceived change in av
- Page 156 and 157: Table 4.1.54-Share of producers of
- Page 158 and 159: Table 4.1.59-Fertilizer use by farm
- Page 160 and 161: Table 4.1.64-Characteristics of fer
- Page 162 and 163: Table 4.1.69-Change in fertilizer a
- Page 164 and 165: Table 4.1.75-Allocation of labor by
- Page 166 and 167: Table 4.1.82-Allocation of labor by
- Page 168 and 169: Table 4.1.89-Change in credit avail
- Page 170 and 171: Table 4.1.94-Percent of households
- Page 172 and 173: Table 4.1.98-Percent of households
- Page 174 and 175: Table 4.1.102-Area allocation by cr
- Page 178 and 179: Table 4.1.110-Marketed share of out
- Page 180 and 181: Table 4.1.114-Marketed share of out
- Page 182 and 183: Table 4.1.117-Regression for market
- Page 184 and 185: Table 4.1.120-Change in the type of
- Page 186 and 187: Table 4.1.128-Perceived change in r
- Page 188 and 189: Table 4.1.135-Main reason for stori
- Page 190 and 191: Table 4.1.140-Summary of food expen
- Page 192 and 193: Table 4.1.142-Percent of households
- Page 194 and 195: Table 4.1.144-Food consumption by e
- Page 196 and 197: Table 4.1.149-Results of regression
- Page 198 and 199: Table 4.1.152-Value of household as
- Page 200 and 201: Table 4.1.156-Value of household as
- Page 202 and 203: Table 4.1.160-Housing characteristi
- Page 204 and 205: Table 4.1.162-Housing characteristi
- Page 206 and 207: Table 4.1.165-Main source of water
- Page 208 and 209: Table 4.1.170-Source of information
- Page 210 and 211: Table 4.1.176-Source of information
- Page 212 and 213: Table 4.1.181-Regression for percei
- Page 214 and 215: Table 4.2.5-Change in number of veh
- Page 216 and 217: Table 4.2.12-Availability and sourc
- Page 218 and 219: Table 4.2.21-Number of GFs per vill
- Page 220 and 221: Table 4.2.30-Percentage of villages
- Page 222 and 223: Table 4.2.34-Distribution of villag
- Page 224 and 225: Table 4.3.1-Distribution of GVs by
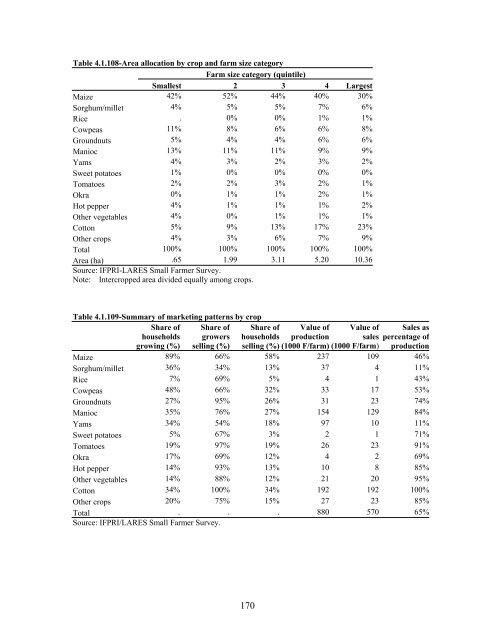
Table 4.1.108-Area allocation by crop and farm size category<br />
Farm size category (quintile)<br />
Smallest 2 3 4 Largest<br />
Maize 42% 52% 44% 40% 30%<br />
Sorghum/millet 4% 5% 5% 7% 6%<br />
Rice . 0% 0% 1% 1%<br />
Cowpeas 11% 8% 6% 6% 8%<br />
Groundnuts 5% 4% 4% 6% 6%<br />
Manioc 13% 11% 11% 9% 9%<br />
Yams 4% 3% 2% 3% 2%<br />
Sweet potatoes 1% 0% 0% 0% 0%<br />
Tomatoes 2% 2% 3% 2% 1%<br />
Okra 0% 1% 1% 2% 1%<br />
Hot pepper 4% 1% 1% 1% 2%<br />
Other vegetables 4% 0% 1% 1% 1%<br />
Cotton 5% 9% 13% 17% 23%<br />
Other crops 4% 3% 6% 7% 9%<br />
Total 100% 100% 100% 100% 100%<br />
Area (ha) .65 1.99 3.11 5.20 10.36<br />
Source: IFPRI-LARES Small Farmer Survey.<br />
Note: <strong>In</strong>tercropped area divided equally among crops.<br />
Table 4.1.109-Summary of marketing patterns by crop<br />
Share of Share of Share of Value of Value of Sales as<br />
households growers households production sales percentage of<br />
growing (%) selling (%) selling (%) (1000 F/farm) (1000 F/farm) production<br />
Maize 89% 66% 58% 237 109 46%<br />
Sorghum/millet 36% 34% 13% 37 4 11%<br />
Rice 7% 69% 5% 4 1 43%<br />
Cowpeas 48% 66% 32% 33 17 53%<br />
Groundnuts 27% 95% 26% 31 23 74%<br />
Manioc 35% 76% 27% 154 129 84%<br />
Yams 34% 54% 18% 97 10 11%<br />
Sweet potatoes 5% 67% 3% 2 1 71%<br />
Tomatoes 19% 97% 19% 26 23 91%<br />
Okra 17% 69% 12% 4 2 69%<br />
Hot pepper 14% 93% 13% 10 8 85%<br />
Other vegetables 14% 88% 12% 21 20 95%<br />
Cotton 34% 100% 34% 192 192 100%<br />
Other crops 20% 75% 15% 27 23 85%<br />
Total . . . 880 570 65%<br />
Source: IFPRI/LARES Small Farmer Survey.<br />
170


