

An Economic Assessment of Banana Genetic Improvement and ...
An Economic Assessment of Banana Genetic Improvement and ...
An Economic Assessment of Banana Genetic Improvement and ...

You also want an ePaper? Increase the reach of your titles
YUMPU automatically turns print PDFs into web optimized ePapers that Google loves.
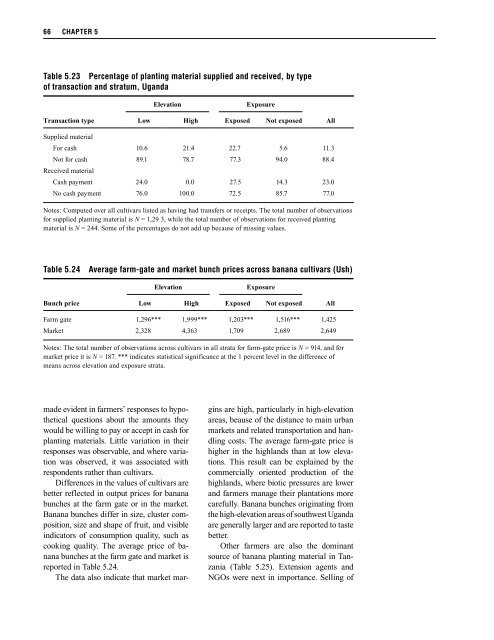
66 CHAPTER 5<br />
Table 5.23 Percentage <strong>of</strong> planting material supplied <strong>and</strong> received, by type<br />
<strong>of</strong> transaction <strong>and</strong> stratum, Ug<strong>and</strong>a<br />
Elevation<br />
Exposure<br />
Transaction type<br />
Low High Exposed Not exposed<br />
All<br />
Supplied material<br />
For cash 10.6 21.4 22.7 5.6 11.3<br />
Not for cash 89.1 78.7 77.3 94.0 88.4<br />
Received material<br />
Cash payment 24.0 0.0 27.5 14.3 23.0<br />
No cash payment 76.0 100.0 72.5 85.7 77.0<br />
Notes: Computed over all cultivars listed as having had transfers or receipts. The total number <strong>of</strong> observations<br />
for supplied planting material is N = 1,29 3, while the total number <strong>of</strong> observations for received planting<br />
material is N = 244. Some <strong>of</strong> the percentages do not add up because <strong>of</strong> missing values.<br />
Table 5.24 Average farm-gate <strong>and</strong> market bunch prices across banana cultivars (Ush)<br />
Elevation<br />
Exposure<br />
Bunch price Low High Exposed Not exposed<br />
All<br />
Farm gate 1,296*** 1,999*** 1,203*** 1,516*** 1,425<br />
Market 2,328 4,363 1,709 2,689 2,649<br />
Notes: The total number <strong>of</strong> observations across cultivars in all strata for farm-gate price is N = 914, <strong>and</strong> for<br />
market price it is N = 187. *** indicates statistical significance at the 1 percent level in the difference <strong>of</strong><br />
means across elevation <strong>and</strong> exposure strata.<br />
made evident in farmers’ responses to hypothetical<br />
questions about the amounts they<br />
would be willing to pay or accept in cash for<br />
planting materials. Little variation in their<br />
responses was observable, <strong>and</strong> where variation<br />
was observed, it was associated with<br />
respondents rather than cultivars.<br />
Differences in the values <strong>of</strong> cultivars are<br />
better reflected in output prices for banana<br />
bunches at the farm gate or in the market.<br />
<strong>Banana</strong> bunches differ in size, cluster composition,<br />
size <strong>and</strong> shape <strong>of</strong> fruit, <strong>and</strong> visible<br />
indicators <strong>of</strong> consumption quality, such as<br />
cooking quality. The average price <strong>of</strong> banana<br />
bunches at the farm gate <strong>and</strong> market is<br />
reported in Table 5.24. here> 5.24near


