

An Economic Assessment of Banana Genetic Improvement and ...
An Economic Assessment of Banana Genetic Improvement and ...
An Economic Assessment of Banana Genetic Improvement and ...

You also want an ePaper? Increase the reach of your titles
YUMPU automatically turns print PDFs into web optimized ePapers that Google loves.
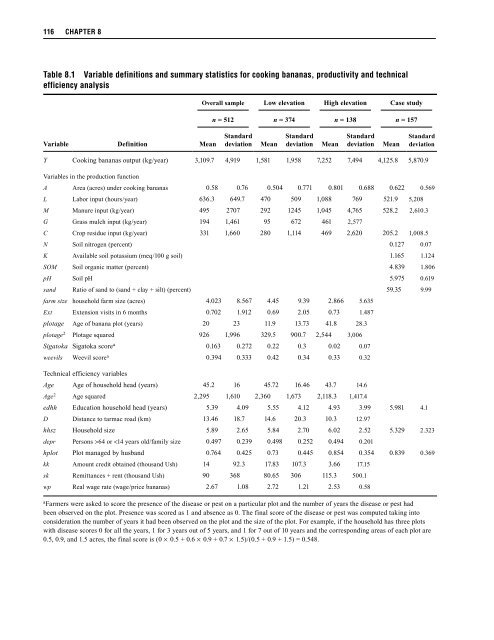
116 CHAPTER 8<br />
Table 8.1 Variable definitions <strong>and</strong> summary statistics for cooking bananas, productivity <strong>and</strong> technical<br />
efficiency analysis<br />
Overall sample Low elevation High elevation Case study<br />
n = 512 n = 374 n = 138 n = 157<br />
Variable<br />
Definition<br />
Mean<br />
St<strong>and</strong>ard<br />
deviation<br />
Mean<br />
St<strong>and</strong>ard<br />
deviation<br />
Mean<br />
St<strong>and</strong>ard<br />
deviation<br />
Mean<br />
St<strong>and</strong>ard<br />
deviation<br />
Y Cooking bananas output (kg/year) 3,109.7 4,919 1,581 1,958 7,252 7,494 4,125.8 5,870.9<br />
Variables in the production function<br />
A Area (acres) under cooking bananas 0.58 0.76 0.504 0.771 0.801 0.688 0.622 0.569<br />
L Labor input (hours/year) 636.3 649.7 470 509 1,088 769 521.9 5,208<br />
M Manure input (kg/year) 495 2707 292 1245 1,045 4,765 528.2 2,610.3<br />
G Grass mulch input (kg/year) 194 1,461 95 672 461 2,577<br />
C Crop residue input (kg/year) 331 1,660 280 1,114 469 2,620 205.2 1,008.5<br />
N Soil nitrogen (percent) 0.127 0.07<br />
K Available soil potassium (meq/100 g soil) 1.165 1.124<br />
SOM Soil organic matter (percent) 4.839 1.806<br />
pH Soil pH 5.975 0.619<br />
s<strong>and</strong> Ratio <strong>of</strong> s<strong>and</strong> to (s<strong>and</strong> + clay + silt) (percent) 59.35 9.99<br />
farm size household farm size (acres) 4.023 8.567 4.45 9.39 2.866 5.635<br />
Ext Extension visits in 6 months 0.702 1.912 0.69 2.05 0.73 1.487<br />
plotage Age <strong>of</strong> banana plot (years) 20 23 11.9 13.73 41.8 28.3<br />
plotage 2 Plotage squared 926 1,996 329.5 900.7 2,544 3,006<br />
Sigatoka Sigatoka score a 0.163 0.272 0.22 0.3 0.02 0.07<br />
weevils Weevil score a 0.394 0.333 0.42 0.34 0.33 0.32<br />
Technical efficiency variables<br />
Age Age <strong>of</strong> household head (years) 45.2 16 45.72 16.46 43.7 14.6<br />
Age 2 Age squared 2,295 1,610 2,360 1,673 2,118.3 1,417.4<br />
edhh Education household head (years) 5.39 4.09 5.55 4.12 4.93 3.99 5.981 4.1<br />
D Distance to tarmac road (km) 13.46 18.7 14.6 20.3 10.3 12.97<br />
hhsz Household size 5.89 2.65 5.84 2.70 6.02 2.52 5.329 2.323<br />
depr Persons >64 or


