An Economic Assessment of Banana Genetic Improvement and ...
An Economic Assessment of Banana Genetic Improvement and ... An Economic Assessment of Banana Genetic Improvement and ...
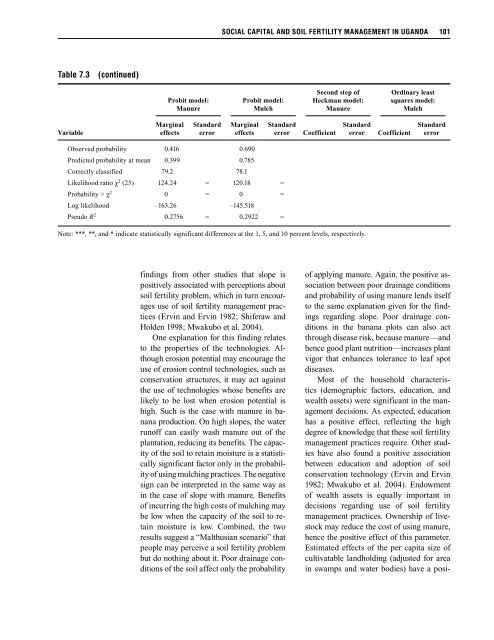
100 CHAPTER 7 Table 7.3 Factors influencing the probability and extent of use of soil fertility management practices Probit model: Manure Probit model: Mulch Second step of Heckman model: Manure Ordinary least squares model: Mulch Variable Marginal effects Standard error Marginal effects Standard error Coefficient Standard error Coefficient Standard error Farm characteristics (Ω F ) Elevation –0.177 0.112 –0.042 0.110 –0.053 0.088 –0.116** 0.059 Plot drainage 0.137** 0.069 –0.008 0.055 0.037 0.045 –0.018 0.032 Moisture retention capacity 0.087 0.083 –0.121* 0.074 0.026 0.047 0.010 0.039 Slope of the farm –0.144* 0.082 0.029 0.068 0.004 0.045 0.122*** 0.036 Number of banana mats 8.3 × 10 –5 0.0001 0.0003** 0.0001 0.0001 0.000 –0.0001*** 4.7 × 10 –5 Household characteristics (Ω HH ) Age –0.006*** 0.002 0.0001 0.002 –0.002 0.001 0.0002 0.001 Gender 0.001 0.068 –0.021 0.055 0.012 0.041 0.050* 0.030 Education 0.004 0.009 0.013* 0.008 –0.002 0.006 0.011*** 0.004 Household size 0.021 0.014 0.022*** 0.012 0.020** 0.010 0.010 0.007 Dependency ratio 0.062 0.160 –0.218* 0.121 0.021 0.104 0.100 0.076 Livestock unit 0.099*** 0.021 0.019 0.015 0.008 0.010 –0.005 0.008 Per capita cultivatable land 0.026 0.022 0.049* 0.030 0.003 0.010 0.022*** 0.008 Exogenous income (I ) 8.5 × 10 –7 1.4 × 10 –6 1.6 × 10 –6 2.1 × 10 –6 1.1 × 10 –6 * 4.7 × 10 –7 5.5 × 10 –7 4.6 × 10 –7 Market characteristics (Ω H ) Distance from paved roads –0.009 0.006 –0.014*** 0.005 0.001 0.004 0.002 0.002 Price to wage ratio 3.165*** 1.285 4.085*** 1.167 1.526*** 0.632 2.129*** 0.482 Diffusion parameters (Ω D ) Extension 0.022 0.017 0.013 0.019 0.020** 0.009 –0.003 0.007 Exposure 0.171*** 0.082 0.044 0.069 0.103** 0.051 0.054 0.039 Relative experience (τ) 1.084*** 0.227 0.830*** 0.154 –0.168 0.140 0.022 0.074 Social capital (Ω S ) Membership density 0.034 0.040 0.027 0.036 –0.068*** 0.025 0.038** 0.017 Leader heterogeneity 0.168*** 0.064 0.050 0.050 0.087** 0.040 0.076*** 0.031 Norms of decisionmaking 0.220*** 0.087 0.230*** 0.068 0.014 0.061 –0.015 0.046 Net labor transfers 6.8 × 10 –6 5.2 × 10 –6 –3.0 × 10 –6 3.7 × 10 –6 5.8 × 10 –7 3.12 × 10 –6 1.2 × 10 –6 3.63 × 10 –6 Net cash transfers 2.3 × 10 –6 * 1.23 × 10 –6 1.5 × 10 –7 9.3 × 10 –7 –6.2 × 10 –7 5.3 × 10 –7 1.6 × 10 –8 4.73 × 10 –7 Net others transfers 3.8 × 10 –6 ** 1.5 × 10 –6 1.5 × 10 –6 1.3 × 10 –6 –1.7 × 10 –6 * 9.8 × 10 –7 –3.4 × 10 –7 6.2 × 10 –7 Mills ratio 0.001** 0.000 7.7 × 10 –8 5.5 × 10 –8 Constant –0.086 0.461 –0.416 0.352 F (26, 104) 4.44 5.89 Probability > F 0 0 R 2 0.5258 0.4387 Adjusted R 2 0.4073 0.3642 Number of observations 332 = 332 = 131 223
SOCIAL CAPITAL AND SOIL FERTILITY MANAGEMENT IN UGANDA 101 Table 7.3 (continued) Probit model: Manure Probit model: Mulch Second step of Heck man model: Manure Ordinary least squares model: Mulch Variable Marginal effects Standard error Marginal effects Standard error Coefficient Standard error Coefficient Standard error Observed probability 0.416 0.690 Predicted probability at mean 0.399 0.785 Correctly classified 79.2 78.1 Likelihood ratio χ 2 (25) 124.24 = 120.18 = Probability > χ 2 0 = 0 = Log likelihood –163.26 –145.518 Pseudo R 2 0.2756 = 0.2922 = Note: ***, **, and * indicate statistically significant differences at the 1, 5, and 10 percent levels, respectively. findings from other studies that slope is positively associated with perceptions about soil fertility problem, which in turn encourages use of soil fertility management practices (Ervin and Ervin 1982; Shiferaw and Holden 1998; Mwakubo et al. 2004). One explanation for this finding relates to the properties of the technologies. Although erosion potential may encourage the use of erosion control technologies, such as conservation structures, it may act against the use of technologies whose benefits are likely to be lost when erosion potential is high. Such is the case with manure in banana production. On high slopes, the water runoff can easily wash manure out of the plantation, reducing its benefits. The capacity of the soil to retain moisture is a statistically significant factor only in the probability of using mulching practices. The negative sign can be interpreted in the same way as in the case of slope with manure. Benefits of incurring the high costs of mulching may be low when the capacity of the soil to retain moisture is low. Combined, the two results suggest a “Malthusian scenario” that people may perceive a soil fertility problem but do nothing about it. Poor drainage conditions of the soil affect only the probability of applying manure. Again, the positive association between poor drainage conditions and probability of using manure lends itself to the same explanation given for the findings regarding slope. Poor drainage conditions in the banana plots can also act through disease risk, because manure—and hence good plant nutrition—increases plant vigor that enhances tolerance to leaf spot diseases. Most of the household characteristics (demographic factors, education, and wealth assets) were significant in the management decisions. As expected, education has a positive effect, reflecting the high degree of knowledge that these soil fertility management practices require. Other studies have also found a positive association between education and adoption of soil conservation technology (Ervin and Ervin 1982; Mwakubo et al. 2004). Endowment of wealth assets is equally important in decisions regarding use of soil fertility management practices. Ownership of livestock may reduce the cost of using manure, hence the positive effect of this parameter. Estimated effects of the per capita size of cultivatable landholding (adjusted for area in swamps and water bodies) have a posi-
- Page 66 and 67: here> 5.3near here>
- Page 68 and 69: 52 CHAPTER 5 Table 5.4 Percentage o
- Page 70 and 71: 54 CHAPTER 5 Table 5.7 Percentage o
- Page 72 and 73: here> 9near 5. here> 10near 5. 56 C
- Page 74 and 75: here> 12near 5. 58 CHAPTER 5 Table
- Page 76 and 77: 60 CHAPTER 5 Table 5.14 Number and
- Page 78 and 79: here> 18near 5. 62 CHAPTER 5 Table
- Page 80 and 81: 64 CHAPTER 5 Table 5.20 Average num
- Page 82 and 83: 66 CHAPTER 5 Table 5.23 Percentage
- Page 84 and 85: 68 CHAPTER 5 Table 5.26 Average dis
- Page 86 and 87: 70 CHAPTER 5 considerably higher in
- Page 89: Part III. Economic Assessment of Te
- Page 92 and 93: 76 CHAPTER 6 The agricultural house
- Page 94 and 95: 78 CHAPTER 6 grow, but have grown i
- Page 96 and 97: 80 CHAPTER 6 Table 6.2 Summary stat
- Page 98 and 99: 82 CHAPTER 6 tion. More frequent vi
- Page 100 and 101: 84 CHAPTER 6 Table 6.4 Prototype ho
- Page 102 and 103: 86 CHAPTER 6 Table 6.5 Characterist
- Page 104 and 105: 88 CHAPTER 6 References Cameron, A.
- Page 106 and 107: 90 CHAPTER 7 by-products of other f
- Page 108 and 109: here> 1near 7. 92 CHAPTER 7 Table 7
- Page 110 and 111: 94 CHAPTER 7 ity in the two technol
- Page 112 and 113: 96 CHAPTER 7 Table 7.2 Definition o
- Page 114 and 115: 98 CHAPTER 7 The direct link betwee
- Page 118 and 119: 102 CHAPTER 7 tive sign but are onl
- Page 120 and 121: 104 CHAPTER 7 fertility management
- Page 122 and 123: 106 CHAPTER 7 participatory decisio
- Page 124 and 125: 108 CHAPTER 7 Stevens, J. P. 2002.
- Page 126 and 127: 110 CHAPTER 8 defined as a function
- Page 128 and 129: 112 CHAPTER 8 inputs or implement c
- Page 130 and 131: 114 CHAPTER 8 Crop output is determ
- Page 132 and 133: 116 CHAPTER 8 Table 8.1 Variable de
- Page 134 and 135: here> 8.6near here> 8.2near 8.3nea
- Page 136 and 137: 120 CHAPTER 8 Table 8.4 Production
- Page 138 and 139: 122 CHAPTER 8 during the SOM decomp
- Page 140 and 141: 124 CHAPTER 8 Supplementary Tables
- Page 142 and 143: 126 CHAPTER 8 Table 8A.3 Production
- Page 144 and 145: 128 CHAPTER 8 Thomas, G. W. 1982. E
- Page 146 and 147: 130 CHAPTER 9 (Nkuba et al. 1999).
- Page 148 and 149: 132 CHAPTER 9 be reduced through la
- Page 150 and 151: 134 CHAPTER 9 Table 9.2 Summary sta
- Page 152 and 153: 136 CHAPTER 9 Table 9.3 Coefficient
- Page 154 and 155: 138 CHAPTER 9 Table 9.4 Mean compar
- Page 156 and 157: 140 CHAPTER 9 References Anandajaya
- Page 158 and 159: 142 CHAPTER 10 Table 10.1 Ugandan c
- Page 160 and 161: 144 CHAPTER 10 (Kangire and Rutherf
- Page 162 and 163: 146 CHAPTER 10 Table 10.4 Predomina
- Page 164 and 165: here> 7near 10. 148 CHAPTER 10 Tabl
SOCIAL CAPITAL AND SOIL FERTILITY MANAGEMENT IN UGANDA 101<br />
Table 7.3 (continued)<br />
Probit model:<br />
Manure<br />
Probit model:<br />
Mulch<br />
Second step <strong>of</strong><br />
Heck man model:<br />
Manure<br />
Ordinary least<br />
squares model:<br />
Mulch<br />
Variable<br />
Marginal<br />
effects<br />
St<strong>and</strong>ard<br />
error<br />
Marginal<br />
effects<br />
St<strong>and</strong>ard<br />
error<br />
Coefficient<br />
St<strong>and</strong>ard<br />
error<br />
Coefficient<br />
St<strong>and</strong>ard<br />
error<br />
Observed probability 0.416 0.690<br />
Predicted probability at mean 0.399 0.785<br />
Correctly classified 79.2 78.1<br />
Likelihood ratio χ 2 (25) 124.24 = 120.18 =<br />
Probability > χ 2 0 = 0 =<br />
Log likelihood –163.26 –145.518<br />
Pseudo R 2 0.2756 = 0.2922 =<br />
Note: ***, **, <strong>and</strong> * indicate statistically significant differences at the 1, 5, <strong>and</strong> 10 percent levels, respectively.<br />
findings from other studies that slope is<br />
positively associated with perceptions about<br />
soil fertility problem, which in turn encourages<br />
use <strong>of</strong> soil fertility management practices<br />
(Ervin <strong>and</strong> Ervin 1982; Shiferaw <strong>and</strong><br />
Holden 1998; Mwakubo et al. 2004).<br />
One explanation for this finding relates<br />
to the properties <strong>of</strong> the technologies. Although<br />
erosion potential may encourage the<br />
use <strong>of</strong> erosion control technologies, such as<br />
conservation structures, it may act against<br />
the use <strong>of</strong> technologies whose benefits are<br />
likely to be lost when erosion potential is<br />
high. Such is the case with manure in banana<br />
production. On high slopes, the water<br />
run<strong>of</strong>f can easily wash manure out <strong>of</strong> the<br />
plantation, reducing its benefits. The capacity<br />
<strong>of</strong> the soil to retain moisture is a statistically<br />
significant factor only in the probability<br />
<strong>of</strong> using mulching practices. The negative<br />
sign can be interpreted in the same way as<br />
in the case <strong>of</strong> slope with manure. Benefits<br />
<strong>of</strong> incurring the high costs <strong>of</strong> mulching may<br />
be low when the capacity <strong>of</strong> the soil to retain<br />
moisture is low. Combined, the two<br />
results suggest a “Malthusian scenario” that<br />
people may perceive a soil fertility problem<br />
but do nothing about it. Poor drainage conditions<br />
<strong>of</strong> the soil affect only the probability<br />
<strong>of</strong> applying manure. Again, the positive association<br />
between poor drainage conditions<br />
<strong>and</strong> probability <strong>of</strong> using manure lends itself<br />
to the same explanation given for the findings<br />
regarding slope. Poor drainage conditions<br />
in the banana plots can also act<br />
through disease risk, because manure—<strong>and</strong><br />
hence good plant nutrition—increases plant<br />
vigor that enhances tolerance to leaf spot<br />
diseases.<br />
Most <strong>of</strong> the household characteristics<br />
(demographic factors, education, <strong>and</strong><br />
wealth assets) were significant in the management<br />
decisions. As expected, education<br />
has a positive effect, reflecting the high<br />
degree <strong>of</strong> knowledge that these soil fertility<br />
management practices require. Other studies<br />
have also found a positive association<br />
between education <strong>and</strong> adoption <strong>of</strong> soil<br />
conservation technology (Ervin <strong>and</strong> Ervin<br />
1982; Mwakubo et al. 2004). Endowment<br />
<strong>of</strong> wealth assets is equally important in<br />
decisions regarding use <strong>of</strong> soil fertility<br />
management practices. Ownership <strong>of</strong> livestock<br />
may reduce the cost <strong>of</strong> using manure,<br />
hence the positive effect <strong>of</strong> this parameter.<br />
Estimated effects <strong>of</strong> the per capita size <strong>of</strong><br />
cultivatable l<strong>and</strong>holding (adjusted for area<br />
in swamps <strong>and</strong> water bodies) have a posi-


