

Techniques d'observation spectroscopique d'astéroïdes
Techniques d'observation spectroscopique d'astéroïdes
Techniques d'observation spectroscopique d'astéroïdes

You also want an ePaper? Increase the reach of your titles
YUMPU automatically turns print PDFs into web optimized ePapers that Google loves.
Spectral properties of (854), (1333), and (3623) 5<br />
Table 3. Modified Gaussian Model applied to (854) Frostia and (1333) Cevenola. The best fit of this tool is summarized as follows:<br />
number of bands, the center of the band, the Full Width at Half Maximum value, the absorption strength, and the slope of the continuum.<br />
Asteroid Number of Center of Band FWHM Strength (log Continuum<br />
Bands (µm) (µm) reflectance) slope<br />
0.922 0.162 -0.359<br />
1.032 0.202 -0.173<br />
(854) Frostia 5 1.248 0.150 -0.064 -5.10 E-05<br />
1.933 0.522 -0.414<br />
2.330 0.546 -0.223<br />
0.482 0.278 -0.196<br />
0.851 0.239 -0.100<br />
(1333) Cevenola 6 0.916 0.184 -0.099 -7.12 E-06<br />
1.045 0.177 -0.118<br />
1.220 0.459 -0.097<br />
2.041 0.570 -0.130<br />
tel-00785991, version 1 - 7 Feb 2013<br />
previous work done by Sunshine et al. (2004) on the S-type<br />
asteroids. The non-uniqueness of mineralogical solution obtained<br />
from spectral modeling justifies the omission of minor<br />
components. The major part of the best mineralogical solutions<br />
from the literature (for the same sample) are reliable<br />
in a limit of few percent. Even at this level of confidence, the<br />
mineralogy is not unique. Thus, our approach is justified.<br />
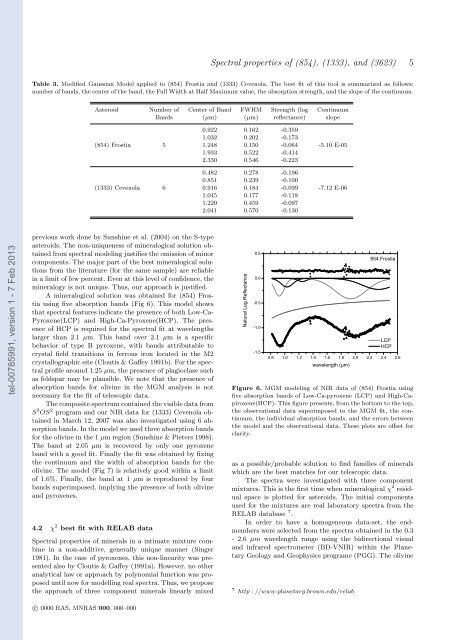
A mineralogical solution was obtained for (854) Frostia<br />
using five absorption bands (Fig 6). This model shows<br />
that spectral features indicate the presence of both Low-Ca-<br />
Pyroxene(LCP) and High-Ca-Pyroxene(HCP). The presence<br />
of HCP is required for the spectral fit at wavelengths<br />
larger than 2.1 µm. This band over 2.1 µm is a specific<br />
behavior of type B pyroxene, with bands attributable to<br />
crystal field transitions in ferrous iron located in the M2<br />
crystallographic site (Cloutis & Gaffey 1991b). For the spectral<br />
profile around 1.25 µm, the presence of plagioclase such<br />
as feldspar may be plausible. We note that the presence of<br />
absorption bands for olivine in the MGM analysis is not<br />
necessary for the fit of telescopic data.<br />
The composite spectrum contained the visible data from<br />
S 3 OS 2 program and our NIR data for (1333) Cevenola obtained<br />
in March 12, 2007 was also investigated using 6 absorption<br />
bands. In the model we used three absorption bands<br />
for the olivine in the 1 µm region (Sunshine & Pieters 1998).<br />
The band at 2.05 µm is recovered by only one pyroxene<br />
band with a good fit. Finally the fit was obtained by fixing<br />
the continuum and the width of absorption bands for the<br />
olivine. The model (Fig 7) is relatively good within a limit<br />
of 1.6%. Finally, the band at 1 µm is reproduced by four<br />
bands superimposed, implying the presence of both olivine<br />
and pyroxenes.<br />
4.2 χ 2 best fit with RELAB data<br />
Spectral properties of minerals in a intimate mixture combine<br />
in a non-additive, generally unique manner (Singer<br />
1981). In the case of pyroxenes, this non-linearity was presented<br />
also by Cloutis & Gaffey (1991a). However, no other<br />
analytical law or approach by polynomial function was proposed<br />
until now for modelling real spectra. Thus, we propose<br />
the approach of three component minerals linearly mixed<br />
Natural Log Reflectance<br />
0.5<br />
0.0<br />
-0.5<br />
-1.0<br />
-1.5<br />
854 Frostia<br />
LCP<br />
HCP<br />
0.8 1.0 1.2 1.4 1.6 1.8 2.0 2.2 2.4 2.6<br />
wavelength (µm)<br />
Figure 6. MGM modeling of NIR data of (854) Frostia using<br />
five absorption bands of Low-Ca-pyroxene (LCP) and High-Capiroxene(HCP).<br />
This figure presents, from the bottom to the top,<br />
the observational data superimposed to the MGM fit, the continuum,<br />
the individual absorption bands, and the errors between<br />
the model and the observational data. These plots are offset for<br />
clarity.<br />
as a possible/probable solution to find families of minerals<br />
which are the best matches for our telescopic data.<br />
The spectra were investigated with three component<br />
mixtures. This is the first time when mineralogical χ 2 residual<br />
space is plotted for asteroids. The initial components<br />
used for the mixtures are real laboratory spectra from the<br />
RELAB database 7 .<br />
In order to have a homogeneous data-set, the endmembers<br />
were selected from the spectra obtained in the 0.3<br />
- 2.6 µm wavelength range using the bidirectional visual<br />
and infrared spectrometer (BD-VNIR) within the Planetary<br />
Geology and Geophysics programe (PGG). The olivine<br />
7 http : //www.planetary.brown.edu/relab<br />
c○ 0000 RAS, MNRAS 000, 000–000


