

OES Annual Report 2012 - Ocean Energy Systems
OES Annual Report 2012 - Ocean Energy Systems
OES Annual Report 2012 - Ocean Energy Systems

You also want an ePaper? Increase the reach of your titles
YUMPU automatically turns print PDFs into web optimized ePapers that Google loves.
124<br />
ÌÌ<br />
Foundations / Moorings – In offshore wind, foundations make up approximately 20% of the total Capex,<br />
uninstalled. This is likely to be similar for tidal farms, with fixed foundation requirements, but potentially less<br />
for wave farms, with mooring system requirements.<br />
ÌÌ<br />
Electrical Connection – In offshore wind, electrical components make up 15% of the total Capex,<br />
uninstalled. This is expected to be similar for wave farms, due to similar distances from shore, but perhaps<br />
less for tidal farms, which can be close to shore.<br />
ÌÌ<br />
Installation – In offshore wind, the installation of foundations, electrical cables and turbines makes up<br />
approximately 20-25% of the total Capex. This is expected to be similar for tidal farms but perhaps less for<br />
wave farms depending on WEC installation strategy.<br />
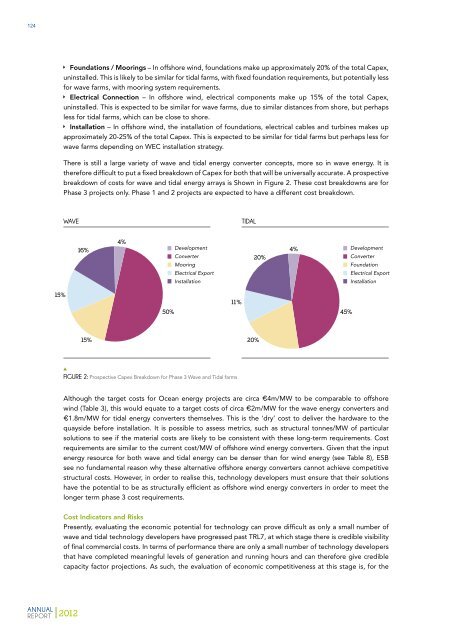
There is still a large variety of wave and tidal energy converter concepts, more so in wave energy. It is<br />
therefore difficult to put a fixed breakdown of Capex for both that will be universally accurate. A prospective<br />
breakdown of costs for wave and tidal energy arrays is Shown in Figure 2. These cost breakdowns are for<br />
Phase 3 projects only. Phase 1 and 2 projects are expected to have a different cost breakdown.<br />
WAVE<br />
TIDAL<br />
16%<br />
4%<br />
Development<br />
Converter<br />
Mooring<br />
Electrical Export<br />
Installation<br />
20%<br />
4%<br />
Development<br />
Converter<br />
Foundation<br />
Electrical Export<br />
Installation<br />
15%<br />
50%<br />
11%<br />
45%<br />
15%<br />
20%<br />
FIGURE 2: Prospective Capex Breakdown for Phase 3 Wave and Tidal farms<br />
Although the target costs for <strong>Ocean</strong> energy projects are circa €4m/MW to be comparable to offshore<br />
wind (Table 3), this would equate to a target costs of circa €2m/MW for the wave energy converters and<br />
€1.8m/MW for tidal energy converters themselves. This is the ‘dry’ cost to deliver the hardware to the<br />
quayside before installation. It is possible to assess metrics, such as structural tonnes/MW of particular<br />
solutions to see if the material costs are likely to be consistent with these long-term requirements. Cost<br />
requirements are similar to the current cost/MW of offshore wind energy converters. Given that the input<br />
energy resource for both wave and tidal energy can be denser than for wind energy (see Table 8), ESB<br />
see no fundamental reason why these alternative offshore energy converters cannot achieve competitive<br />
structural costs. However, in order to realise this, technology developers must ensure that their solutions<br />
have the potential to be as structurally efficient as offshore wind energy converters in order to meet the<br />
longer term phase 3 cost requirements.<br />
Cost Indicators and Risks<br />
Presently, evaluating the economic potential for technology can prove difficult as only a small number of<br />
wave and tidal technology developers have progressed past TRL7, at which stage there is credible visibility<br />
of final commercial costs. In terms of performance there are only a small number of technology developers<br />
that have completed meaningful levels of generation and running hours and can therefore give credible<br />
capacity factor projections. As such, the evaluation of economic competitiveness at this stage is, for the<br />
ANNUAL<br />
REPORT <strong>2012</strong>


