

OES Annual Report 2012 - Ocean Energy Systems
OES Annual Report 2012 - Ocean Energy Systems
OES Annual Report 2012 - Ocean Energy Systems

You also want an ePaper? Increase the reach of your titles
YUMPU automatically turns print PDFs into web optimized ePapers that Google loves.
123<br />
05 / DEVELOPMENT OF THE INTERNATIONAL<br />
OCEAN ENERGY INDUSTRY: PERFORMANCE<br />
IMPROVEMENTS AND COST REDUCTIONS<br />
ESB OCEAN PROJECT INDICATIVE PROJECT REQUIRED TRL LEVEL REQUIRED COST ENVELOPE<br />
Phase 1 Project Pre-Commercial Array (5-10MW) TRL 8 Table 1(b)<br />
Phase 2 Project Small Commercial Array (25MW+) TRL 9 Table 2<br />
Phase 3 Project Large Scale Array (50MW+) TRL 9 Table 3<br />
TABLE 6: TRL and Economic Requirements for ESB <strong>Ocean</strong> <strong>Energy</strong> Projects<br />
<strong>Ocean</strong> <strong>Energy</strong> Cost Trajectories<br />
Based on the cost envelopes in Tables 1 to 3, it is possible to extract realistic cost trajectories that ocean<br />
energy must achieve for commercial acceptability. For example, consider a wave energy technology that has<br />
been verified to TRL8 and is assessed to have a potential capacity factor of 25% (based on the application of<br />
specifications such as IEC 62600-100 and 62600-101 as well a realistic allowance for availability). Assuming<br />
that investors are happy that annual operational expenditure (Opex) can be kept at or below €250k per<br />
MW per year then the affordable capital expenditure (Capex) according to table 1(b) is €6.24m/MW. If this<br />
is sufficient to fund a phase 1 project, then as the industry grows for subsequent projects there is potential<br />
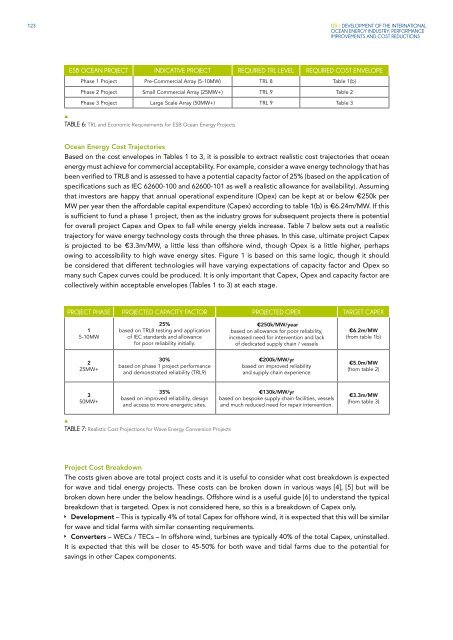
for overall project Capex and Opex to fall while energy yields increase. Table 7 below sets out a realistic<br />
trajectory for wave energy technology costs through the three phases. In this case, ultimate project Capex<br />
is projected to be €3.3m/MW, a little less than offshore wind, though Opex is a little higher, perhaps<br />
owing to accessibility to high wave energy sites. Figure 1 is based on this same logic, though it should<br />
be considered that different technologies will have varying expectations of capacity factor and Opex so<br />
many such Capex curves could be produced. It is only important that Capex, Opex and capacity factor are<br />
collectively within acceptable envelopes (Tables 1 to 3) at each stage.<br />
PROJECT PHASE PROJECTED CAPACITY FACTOR PROJECTED OPEX TARGET CAPEX<br />
1<br />
5-10MW<br />
25%<br />
based on TRL8 testing and application<br />
of IEC standards and allowance<br />
for poor reliability initially.<br />
€250k/MW/year<br />
based on allowance for poor reliability,<br />
increased need for intervention and lack<br />
of dedicated supply chain / vessels<br />
€6.2m/MW<br />
(from table 1b)<br />
2<br />
25MW+<br />
30%<br />
based on phase 1 project performance<br />
and demonstrated reliability (TRL9)<br />
€200k/MW/yr<br />
based on improved reliability<br />
and supply chain experience<br />
€5.0m/MW<br />
(from table 2)<br />
3<br />
50MW+<br />
35%<br />
based on improved reliability, design<br />
and access to more energetic sites.<br />
€130k/MW/yr<br />
based on bespoke supply chain facilities, vessels<br />
and much reduced need for repair intervention.<br />
€3.3m/MW<br />
(from table 3)<br />
TABLE 7: Realistic Cost Projections for Wave <strong>Energy</strong> Conversion Projects<br />
Project Cost Breakdown<br />
The costs given above are total project costs and it is useful to consider what cost breakdown is expected<br />
for wave and tidal energy projects. These costs can be broken down in various ways [4], [5] but will be<br />
broken down here under the below headings. Offshore wind is a useful guide [6] to understand the typical<br />
breakdown that is targeted. Opex is not considered here, so this is a breakdown of Capex only.<br />
ÌÌ<br />
Development – This is typically 4% of total Capex for offshore wind, it is expected that this will be similar<br />
for wave and tidal farms with similar consenting requirements.<br />
ÌÌ<br />
Converters – WECs / TECs – In offshore wind, turbines are typically 40% of the total Capex, uninstalled.<br />
It is expected that this will be closer to 45-50% for both wave and tidal farms due to the potential for<br />
savings in other Capex components.


