OES Annual Report 2012 - Ocean Energy Systems
OES Annual Report 2012 - Ocean Energy Systems OES Annual Report 2012 - Ocean Energy Systems
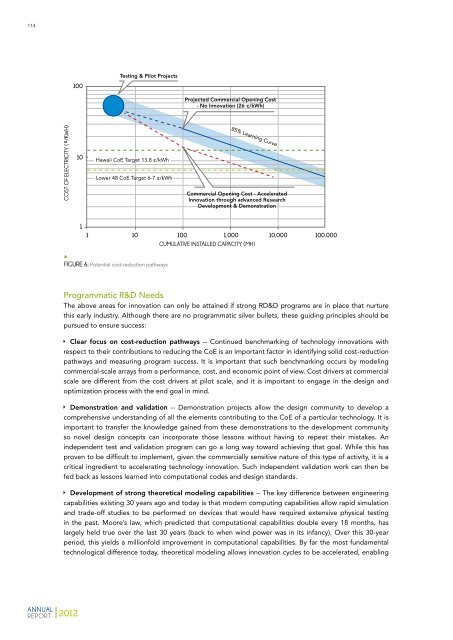
113 05 / DEVELOPMENT OF THE INTERNATIONAL OCEAN ENERGY INDUSTRY: PERFORMANCE IMPROVEMENTS AND COST REDUCTIONS Improve reliability -- The system reliability drives O&M costs because it dictates intervention cycles and also replacement part cost. It is expected that with deployment experience, these system will become more reliable and robust over time. If the above improvements are applied to the baseline CoE profile of 27 cents/kWh at commercial scale, it would allow a cost reduction on the order of almost 50 percent over present cost to a CoE of about 15.5 cents/kWh, as illustrated in Figure 5. Given the uncertainties in the prediction of the baseline cost of +/- 30 percent, the range of CoE values that could be achieved is on the order of 10 – 20 cents/kWh. 30 28 26 24 COE (CENTS/KWH) 22 20 18 16 14 12 10 POWER CAPTURE ALTERNATE MATERIALS RELIABILITY MARINE OPERATION FIGURE 5: Contribution to cost reduction of different cost centers. Cost Reductions in the US Context Two scenarios were developed to illustrate how the cost reduction could be established in the US marketplace. The first scenario (the blue lines in Figure 6) shows how the cost would decline from today’s levels to the commercial opening cost level predicted by this study if the technologies stayed the same. Cost reductions in this case are largely based on economies of scale (going from 5 MW plants to 50 MW plants) and improvements in device reliability (eliminating the high failure rates typical in pilot and demonstration projects). From the projected opening cost, an 85 percent learning curve indicates predicted cost reductions as the cumulative installed capacity base grows beyond 100 MW. Figure 6 shows that the breakeven target for the lower 48 states, at which no subsidies would be required, occurs at about 50,000 MW cumulative global installed capacity. This point is very similar to the deployed capacity levels at which land-based wind started to become very competitive. The second scenario (the red line in Figure 6) shows what would happen if an accelerated research, development, and deployment (RD&D) strategy were pursued. Such an accelerated program could potentially reduce the CoE to a level of about 15 ¢/kWh within the first 100 MW of cumulative installed capacity. Cost projections extending out from the 100 MW point were assumed to follow a more traditional learning curve with an 85 percent progress ratio. Figure 6 shows that the CoE would become competitive in Hawaii at a cumulative deployed capacity of less than 200 MW. The learning in this early adopter market would allow costs to be further reduced without any required subsidies, and therefore would minimize the public investment into the technology space. At a cumulative installed capacity of about 3,000 MW, wave power would then reach grid parity with the US mainland (lower 48 states and Alaska).
114 Testing & Pilot Projects 100 Projected Commercial Opening Cost - No Innovation (26 ¢/kWh) COST OF ELECTRICITY (¢/KWH) 10 Hawaii CoE Target 13.8 ¢/kWh Lower 48 CoE Target 6-7 ¢/kWh 85% Learning Curve Commercial Opening Cost - Accelerated Innovation through advanced Research Development & Demonstration 1 1 10 100 1,000 10,000 100,000 CUMULATIVE INSTALLED CAPACITY (MH) FIGURE 6: Potential cost-reduction pathways Programmatic R&D Needs The above areas for innovation can only be attained if strong RD&D programs are in place that nurture this early industry. Although there are no programmatic silver bullets, these guiding principles should be pursued to ensure success: ÌÌ Clear focus on cost-reduction pathways -- Continued benchmarking of technology innovations with respect to their contributions to reducing the CoE is an important factor in identifying solid cost-reduction pathways and measuring program success. It is important that such benchmarking occurs by modeling commercial-scale arrays from a performance, cost, and economic point of view. Cost drivers at commercial scale are different from the cost drivers at pilot scale, and it is important to engage in the design and optimization process with the end goal in mind. ÌÌ Demonstration and validation -- Demonstration projects allow the design community to develop a comprehensive understanding of all the elements contributing to the CoE of a particular technology. It is important to transfer the knowledge gained from these demonstrations to the development community so novel design concepts can incorporate those lessons without having to repeat their mistakes. An independent test and validation program can go a long way toward achieving that goal. While this has proven to be difficult to implement, given the commercially sensitive nature of this type of activity, it is a critical ingredient to accelerating technology innovation. Such independent validation work can then be fed back as lessons learned into computational codes and design standards. ÌÌ Development of strong theoretical modeling capabilities -- The key difference between engineering capabilities existing 30 years ago and today is that modern computing capabilities allow rapid simulation and trade-off studies to be performed on devices that would have required extensive physical testing in the past. Moore’s law, which predicted that computational capabilities double every 18 months, has largely held true over the last 30 years (back to when wind power was in its infancy). Over this 30-year period, this yields a millionfold improvement in computational capabilities. By far the most fundamental technological difference today, theoretical modeling allows innovation cycles to be accelerated, enabling ANNUAL REPORT 2012
- Page 71 and 72: 62 Voith Hydro Wavegen in Inverness
- Page 73 and 74: 64 NORWAY Carl Gustaf Rye-Florentz
- Page 75 and 76: 66 -off units with a total of 240 k
- Page 77 and 78: 68 MEXICO Sergio M. Alcocer 1 , Ger
- Page 79 and 80: 70 RESEARCH & DEVELOPMENT Governmen
- Page 81 and 82: 72 SPAIN José Luis Villate TECNALI
- Page 83 and 84: 74 A new R&D project on wave energy
- Page 85 and 86: 76 The Oceanic Platform of the Cana
- Page 87 and 88: 78 ITALY Gerardo Montanino GSE INTR
- Page 89 and 90: 80 Participation in Collaborative I
- Page 91 and 92: 82 Administration (Regione Sicilian
- Page 93 and 94: 84 RESEARCH & DEVELOPMENT Governmen
- Page 95 and 96: 86 producers of electricity from bi
- Page 97 and 98: 88 Blue Energy Blue Energy is an in
- Page 99 and 100: 90 renewable energy technologies, i
- Page 101 and 102: 92 REPUBLIC OF KOREA Keyyong Hong K
- Page 103 and 104: 94 Relevant Documents Released The
- Page 105 and 106: 96 The HyTide 110-5.3 horizontal ax
- Page 107 and 108: 98 Functional Zoning (2011-2020) wo
- Page 109 and 110: 100 TECHNOLOGY DEMONSTRATION Operat
- Page 111 and 112: 102 RESEARCH & DEVELOPMENT Governme
- Page 113 and 114: 104 FRANCE Georgina Grenon 1 and Ya
- Page 116 and 117: 05/ DEVELOPMENT OF THE INTERNATIONA
- Page 118 and 119: 109 05 / DEVELOPMENT OF THE INTERNA
- Page 120 and 121: 111 05 / DEVELOPMENT OF THE INTERNA
- Page 124 and 125: 115 05 / DEVELOPMENT OF THE INTERNA
- Page 126 and 127: 117 05 / DEVELOPMENT OF THE INTERNA
- Page 128 and 129: 119 05 / DEVELOPMENT OF THE INTERNA
- Page 130 and 131: 121 05 / DEVELOPMENT OF THE INTERNA
- Page 132 and 133: 123 05 / DEVELOPMENT OF THE INTERNA
- Page 134 and 135: 125 05 / DEVELOPMENT OF THE INTERNA
- Page 136 and 137: 127 05 / DEVELOPMENT OF THE INTERNA
- Page 138 and 139: 129 05 / DEVELOPMENT OF THE INTERNA
- Page 140 and 141: 131 05 / DEVELOPMENT OF THE INTERNA
- Page 142 and 143: 133 05 / DEVELOPMENT OF THE INTERNA
- Page 144 and 145: 135 05 / DEVELOPMENT OF THE INTERNA
- Page 146 and 147: 06/ STATISTICAL OVERVIEW OF OCEAN E
- Page 148 and 149: 139 06 / STATISTICAL OVERVIEW OF OC
- Page 150 and 151: 141 06 / STATISTICAL OVERVIEW OF OC
- Page 152 and 153: 143 06 / STATISTICAL OVERVIEW OF OC
- Page 154 and 155: 145 06 / STATISTICAL OVERVIEW OF OC
- Page 156 and 157: 147 06 / STATISTICAL OVERVIEW OF OC
- Page 158: OCEAN ENERGY SYSTEMS (OES) www.ocea
114<br />
Testing & Pilot Projects<br />
100<br />
Projected Commercial Opening Cost<br />
- No Innovation (26 ¢/kWh)<br />
COST OF ELECTRICITY (¢/KWH)<br />
10<br />
Hawaii CoE Target 13.8 ¢/kWh<br />
Lower 48 CoE Target 6-7 ¢/kWh<br />
85% Learning Curve<br />
Commercial Opening Cost - Accelerated<br />
Innovation through advanced Research<br />
Development & Demonstration<br />
1<br />
1 10 100 1,000 10,000 100,000<br />
CUMULATIVE INSTALLED CAPACITY (MH)<br />
FIGURE 6: Potential cost-reduction pathways<br />
Programmatic R&D Needs<br />
The above areas for innovation can only be attained if strong RD&D programs are in place that nurture<br />
this early industry. Although there are no programmatic silver bullets, these guiding principles should be<br />
pursued to ensure success:<br />
ÌÌ<br />
Clear focus on cost-reduction pathways -- Continued benchmarking of technology innovations with<br />
respect to their contributions to reducing the CoE is an important factor in identifying solid cost-reduction<br />
pathways and measuring program success. It is important that such benchmarking occurs by modeling<br />
commercial-scale arrays from a performance, cost, and economic point of view. Cost drivers at commercial<br />
scale are different from the cost drivers at pilot scale, and it is important to engage in the design and<br />
optimization process with the end goal in mind.<br />
ÌÌ<br />
Demonstration and validation -- Demonstration projects allow the design community to develop a<br />
comprehensive understanding of all the elements contributing to the CoE of a particular technology. It is<br />
important to transfer the knowledge gained from these demonstrations to the development community<br />
so novel design concepts can incorporate those lessons without having to repeat their mistakes. An<br />
independent test and validation program can go a long way toward achieving that goal. While this has<br />
proven to be difficult to implement, given the commercially sensitive nature of this type of activity, it is a<br />
critical ingredient to accelerating technology innovation. Such independent validation work can then be<br />
fed back as lessons learned into computational codes and design standards.<br />
ÌÌ<br />
Development of strong theoretical modeling capabilities -- The key difference between engineering<br />
capabilities existing 30 years ago and today is that modern computing capabilities allow rapid simulation<br />
and trade-off studies to be performed on devices that would have required extensive physical testing<br />
in the past. Moore’s law, which predicted that computational capabilities double every 18 months, has<br />
largely held true over the last 30 years (back to when wind power was in its infancy). Over this 30-year<br />
period, this yields a millionfold improvement in computational capabilities. By far the most fundamental<br />
technological difference today, theoretical modeling allows innovation cycles to be accelerated, enabling<br />
ANNUAL<br />
REPORT <strong>2012</strong>


