OES Annual Report 2012 - Ocean Energy Systems
OES Annual Report 2012 - Ocean Energy Systems OES Annual Report 2012 - Ocean Energy Systems
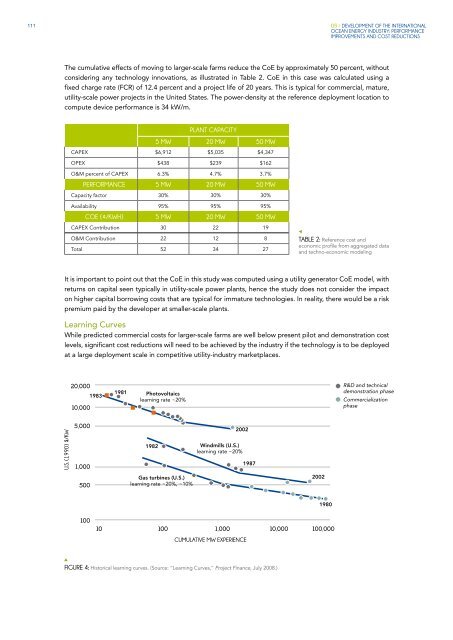
111 05 / DEVELOPMENT OF THE INTERNATIONAL OCEAN ENERGY INDUSTRY: PERFORMANCE IMPROVEMENTS AND COST REDUCTIONS The cumulative effects of moving to larger-scale farms reduce the CoE by approximately 50 percent, without considering any technology innovations, as illustrated in Table 2. CoE in this case was calculated using a fixed charge rate (FCR) of 12.4 percent and a project life of 20 years. This is typical for commercial, mature, utility-scale power projects in the United States. The power-density at the reference deployment location to compute device performance is 34 kW/m. PLANT CAPACITY 5 MW 20 MW 50 MW CAPEX $6,912 $5,035 $4,347 OPEX $438 $239 $162 O&M percent of CAPEX 6.3% 4.7% 3.7% PERFORMANCE 5 MW 20 MW 50 MW Capacity factor 30% 30% 30% Availability 95% 95% 95% COE (¢/KWH) 5 MW 20 MW 50 MW CAPEX Contribution 30 22 19 O&M Contribution 22 12 8 Total 52 34 27 TABLE 2: Reference cost and economic profile from aggregated data and techno-economic modeling It is important to point out that the CoE in this study was computed using a utility generator CoE model, with returns on capital seen typically in utility-scale power plants, hence the study does not consider the impact on higher capital borrowing costs that are typical for immature technologies. In reality, there would be a risk premium paid by the developer at smaller-scale plants. Learning Curves While predicted commercial costs for larger-scale farms are well below present pilot and demonstration cost levels, significant cost reductions will need to be achieved by the industry if the technology is to be deployed at a large deployment scale in competitive utility-industry marketplaces. 20,000 1983 10,000 1981 Photovoltaics learning rate ~20% R&D and technical demonstration phase Commercialization phase U.S. (1990) $/KW 5,000 1,000 1982 2002 Windmills (U.S.) learning rate ~20% 1987 500 Gas turbines (U.S.) learning rate ~20%, ~10% 2002 1980 100 10 100 1,000 10,000 100,000 CUMULATIVE MW EXPERIENCE FIGURE 4: Historical learning curves. (Source: “Learning Curves,” Project Finance, July 2008.)
112 Learning curves are typically used when predicting longer-term cost reductions for an industry. For each doubling of the deployed capacity, a certain percentage cost reduction is attained. Similar renewable energy technologies have historically attained learning rates on the order of 70–90 percent. Wind technology, for example, which is the most closely related analog, has demonstrated progress ratios on the order of 85 percent. It is important to understand that these cumulative cost reductions are tied to a wide range of factors that can drive cost down, including manufacturing scale, operational efficiencies, improved reliability and availability, and fundamental design changes. (See Figure 4.) Globally only a limited number of wave energy devices have been deployed, with a cumulative installed capacity of less than 10MW. Furthermore, the wave technology space is characterized by a wide range of different technical approaches, typical for an emerging technology with limited deployments and very similar to wind about 20 years ago. The limited global deployment also means that no technology lock-in has occurred, which is typical for more-established technology sectors. Technology lock-in occurs as a particular technology approach is perfected, manufacturing capacity is built up, and it becomes increasingly more difficult for an alternate technology-topology to enter the market place and compete effectively. A typical example is wind technology, where the 3-bladed, upwind, variable-pitch turbine technology has become the dominant technology. The lack of a technology lock-in makes transformational technology shifts easier to accommodate in the marketplace and opens up the possibility for rapid cost-reduction pathways. Technology Areas Contributing to CoE Reduction Within the following set of cost-reduction categories, we used in-house techno-economic models to evaluate how much the CoE from wave energy could be reduced within the near-term, based on the improvement potential of technologies now under development: Development of efficient operation and maintenance strategies -- Although O&M strategies used in the offshore industry are often adapted for wave energy, they are frequently inefficient and costly. Developing and optimizing O&M strategies and relying on custom vessels specifically built to carry out wave energy operations could allow for a significant reduction in the O&M costs of these devices. Furthermore, recent advances in unmanned vehicle technology (for both surface and underwater vehicles) could allow the use of these vehicles to perform routine inspection and maintenance tasks, a significant opportunity for cost reduction. Early adopter commercial arrays could be used as test-beds for such intervention technologies. Improving device power capture --The total costs of most wave power machines today are dominated by structural costs. Specifically, these devices show a poor ratio of power output to the structural cost of the absorber. Most of the wave energy devices deployed today are tuned by adjusting the damping on the power takeoff slowly from sea state to sea state. Many of the device concepts studied to date show significant potential to improve power capture if optimal tuning strategies can be applied. To accomplish this improvement, three different areas of technology innovation are needed -- ÌÌ The ability to accurately predict waves in the open ocean on a time horizon of 30 seconds ÌÌ Development of control strategies ÌÌ Development of power-conversion systems that allow the implementation of rapid-tuning techniques Reducing structural overdesign through improved load-prediction tools -- Most design standards used in the offshore industry are very conservative, leading to a tendency of overdesigning the structure. This overdesign is a direct result of the uncertainties in predicting the driving-load cases for which the structures must be designed. An improved understanding of these loads could significantly reduce required safety factors and hence the total material (and cost) of these devices. Use of alternate materials -- Prototype devices are mostly built from steel today. While steel is a great material choice for building one-off devices and can easily be repaired and modified if needed, it is labor intensive to manufacture and hence expensive. In many cases, composites and concrete could be used instead, providing significant opportunities to reduce labor and material costs in the manufacturing process. ANNUAL REPORT 2012
- Page 69 and 70: 60 GERMANY Jochen Bard Fraunhofer I
- Page 71 and 72: 62 Voith Hydro Wavegen in Inverness
- Page 73 and 74: 64 NORWAY Carl Gustaf Rye-Florentz
- Page 75 and 76: 66 -off units with a total of 240 k
- Page 77 and 78: 68 MEXICO Sergio M. Alcocer 1 , Ger
- Page 79 and 80: 70 RESEARCH & DEVELOPMENT Governmen
- Page 81 and 82: 72 SPAIN José Luis Villate TECNALI
- Page 83 and 84: 74 A new R&D project on wave energy
- Page 85 and 86: 76 The Oceanic Platform of the Cana
- Page 87 and 88: 78 ITALY Gerardo Montanino GSE INTR
- Page 89 and 90: 80 Participation in Collaborative I
- Page 91 and 92: 82 Administration (Regione Sicilian
- Page 93 and 94: 84 RESEARCH & DEVELOPMENT Governmen
- Page 95 and 96: 86 producers of electricity from bi
- Page 97 and 98: 88 Blue Energy Blue Energy is an in
- Page 99 and 100: 90 renewable energy technologies, i
- Page 101 and 102: 92 REPUBLIC OF KOREA Keyyong Hong K
- Page 103 and 104: 94 Relevant Documents Released The
- Page 105 and 106: 96 The HyTide 110-5.3 horizontal ax
- Page 107 and 108: 98 Functional Zoning (2011-2020) wo
- Page 109 and 110: 100 TECHNOLOGY DEMONSTRATION Operat
- Page 111 and 112: 102 RESEARCH & DEVELOPMENT Governme
- Page 113 and 114: 104 FRANCE Georgina Grenon 1 and Ya
- Page 116 and 117: 05/ DEVELOPMENT OF THE INTERNATIONA
- Page 118 and 119: 109 05 / DEVELOPMENT OF THE INTERNA
- Page 122 and 123: 113 05 / DEVELOPMENT OF THE INTERNA
- Page 124 and 125: 115 05 / DEVELOPMENT OF THE INTERNA
- Page 126 and 127: 117 05 / DEVELOPMENT OF THE INTERNA
- Page 128 and 129: 119 05 / DEVELOPMENT OF THE INTERNA
- Page 130 and 131: 121 05 / DEVELOPMENT OF THE INTERNA
- Page 132 and 133: 123 05 / DEVELOPMENT OF THE INTERNA
- Page 134 and 135: 125 05 / DEVELOPMENT OF THE INTERNA
- Page 136 and 137: 127 05 / DEVELOPMENT OF THE INTERNA
- Page 138 and 139: 129 05 / DEVELOPMENT OF THE INTERNA
- Page 140 and 141: 131 05 / DEVELOPMENT OF THE INTERNA
- Page 142 and 143: 133 05 / DEVELOPMENT OF THE INTERNA
- Page 144 and 145: 135 05 / DEVELOPMENT OF THE INTERNA
- Page 146 and 147: 06/ STATISTICAL OVERVIEW OF OCEAN E
- Page 148 and 149: 139 06 / STATISTICAL OVERVIEW OF OC
- Page 150 and 151: 141 06 / STATISTICAL OVERVIEW OF OC
- Page 152 and 153: 143 06 / STATISTICAL OVERVIEW OF OC
- Page 154 and 155: 145 06 / STATISTICAL OVERVIEW OF OC
- Page 156 and 157: 147 06 / STATISTICAL OVERVIEW OF OC
- Page 158: OCEAN ENERGY SYSTEMS (OES) www.ocea
111<br />
05 / DEVELOPMENT OF THE INTERNATIONAL<br />
OCEAN ENERGY INDUSTRY: PERFORMANCE<br />
IMPROVEMENTS AND COST REDUCTIONS<br />
The cumulative effects of moving to larger-scale farms reduce the CoE by approximately 50 percent, without<br />
considering any technology innovations, as illustrated in Table 2. CoE in this case was calculated using a<br />
fixed charge rate (FCR) of 12.4 percent and a project life of 20 years. This is typical for commercial, mature,<br />
utility-scale power projects in the United States. The power-density at the reference deployment location to<br />
compute device performance is 34 kW/m.<br />
PLANT CAPACITY<br />
5 MW 20 MW 50 MW<br />
CAPEX $6,912 $5,035 $4,347<br />
OPEX $438 $239 $162<br />
O&M percent of CAPEX 6.3% 4.7% 3.7%<br />
PERFORMANCE 5 MW 20 MW 50 MW<br />
Capacity factor 30% 30% 30%<br />
Availability 95% 95% 95%<br />
COE (¢/KWH) 5 MW 20 MW 50 MW<br />
CAPEX Contribution 30 22 19<br />
O&M Contribution 22 12 8<br />
Total 52 34 27<br />
TABLE 2: Reference cost and<br />
economic profile from aggregated data<br />
and techno-economic modeling<br />
It is important to point out that the CoE in this study was computed using a utility generator CoE model, with<br />
returns on capital seen typically in utility-scale power plants, hence the study does not consider the impact<br />
on higher capital borrowing costs that are typical for immature technologies. In reality, there would be a risk<br />
premium paid by the developer at smaller-scale plants.<br />
Learning Curves<br />
While predicted commercial costs for larger-scale farms are well below present pilot and demonstration cost<br />
levels, significant cost reductions will need to be achieved by the industry if the technology is to be deployed<br />
at a large deployment scale in competitive utility-industry marketplaces.<br />
20,000<br />
1983<br />
10,000<br />
1981<br />
Photovoltaics<br />
learning rate ~20%<br />
R&D and technical<br />
demonstration phase<br />
Commercialization<br />
phase<br />
U.S. (1990) $/KW<br />
5,000<br />
1,000<br />
1982<br />
2002<br />
Windmills (U.S.)<br />
learning rate ~20%<br />
1987<br />
500<br />
Gas turbines (U.S.)<br />
learning rate ~20%, ~10%<br />
2002<br />
1980<br />
100<br />
10 100<br />
1,000<br />
10,000 100,000<br />
CUMULATIVE MW EXPERIENCE<br />
FIGURE 4: Historical learning curves. (Source: “Learning Curves,” Project Finance, July 2008.)


