Voting advice applications and party choice: evidence from ...
Voting advice applications and party choice: evidence from ...
Voting advice applications and party choice: evidence from ...

You also want an ePaper? Increase the reach of your titles
YUMPU automatically turns print PDFs into web optimized ePapers that Google loves.
Int. J. Electronic Governance, Vol. 5, Nos. 3/4, 2012 367<br />
<strong>Voting</strong> <strong>advice</strong> <strong>applications</strong> <strong>and</strong> <strong>party</strong> <strong>choice</strong>:<br />
<strong>evidence</strong> <strong>from</strong> smartvote users in Switzerl<strong>and</strong><br />
Andreas Ladner, Jan Fivaz* <strong>and</strong><br />
Joëlle Pianzola<br />
IDHEAP,<br />
University of Lausanne,<br />
Lausanne, Switzerl<strong>and</strong><br />
Email: <strong>and</strong>reas.ladner@idheap.unil.ch<br />
Email: fivaz@nccr-democracy.uzh.ch<br />
Email: pianzola@nccr-democracy.uzh.ch<br />
*Corresponding author<br />
Abstract: Online voting <strong>advice</strong> <strong>applications</strong> (VAAs) have become popular<br />
across Europe with millions of voters using them during electoral campaigns.<br />
Despite their popularity, little is known about their impact on their users’<br />
electoral <strong>choice</strong>s. Based on survey data <strong>from</strong> voters using the Swiss VAA<br />
smartvote, we present findings on the direct impact on the actual votes of VAA<br />
users <strong>and</strong> whether the voting recommendations led them to adapt their previous<br />
vote <strong>choice</strong>s. Our findings suggest that there is a tendency toward swing voting<br />
among smartvote users, most prominently among younger voters. Moreover,<br />
we find that smartvote users who were very surprised by the outcome of<br />
their voting recommendations were also more inclined to change their <strong>party</strong><br />
<strong>choice</strong>s. Furthermore, we examine the directional change of the initial voting<br />
preferences of those voters who stated that the tool had influenced their voting<br />
decisions. Our findings are valid only for a self-selected sample of smartvote<br />
users; thus, we discuss necessary steps for improvement in future VAA<br />
research.<br />
Keywords: e-democracy; VAAs; elections; electoral <strong>choice</strong>; smartvote; voting<br />
recommendation; decision-making; swing-voting.<br />
Reference to this paper should be made as follows: Ladner, A., Fivaz, J. <strong>and</strong><br />
Pianzola, J. (2012) ‘<strong>Voting</strong> <strong>advice</strong> <strong>applications</strong> <strong>and</strong> <strong>party</strong> <strong>choice</strong>: <strong>evidence</strong><br />
<strong>from</strong> smartvote users in Switzerl<strong>and</strong>’, Int. J. Electronic Governance, Vol. 5,<br />
Nos. 3/4, pp.367–387.<br />
Biographical notes: Andreas Ladner is Professor for Political Institutions <strong>and</strong><br />
Swiss Public Administration at the autonomous university institute IDHEAP<br />
in Lausanne. His areas of research include political parties, municipalities,<br />
institutional change, <strong>and</strong> e-democracy. He has conducted several major<br />
research projects of the Swiss National Science Foundation <strong>and</strong> authored books<br />
<strong>and</strong> articles on these topics. His latest book analyses the influence of municipal<br />
size on the quality of democracy in Swiss municipalities. Actually he leads the<br />
research project on the voting assistance application (VAA) smartvote. He also<br />
regularly comments Swiss politics in the media.<br />
Jan Fivaz is writing his PhD in Political Science at the Autonomous University<br />
Institute IDHEAP in Lausanne. He is also working at as a research assistant at<br />
the University of Bern. His areas of research consist of electoral behaviour,<br />
Copyright © 2012 Inderscience Enterprises Ltd.
368 A. Ladner, J. Fivaz <strong>and</strong> J. Pianzola<br />
political parties, political representation, <strong>and</strong> eDemocracy. In 2009, he obtained<br />
a Master of Arts in History, Political Science <strong>and</strong> Economics. Since 2003, he<br />
has been involved in the development of the voting <strong>advice</strong> application (VAA)<br />
smartvote.<br />
Joëlle Pianzola studied Political Science, English Linguistics <strong>and</strong> European<br />
Law at the University of Bern <strong>and</strong> University of Helsinki. She is currently<br />
writing her PhD in Political Science at IDHEAP, University of Lausanne. Her<br />
research interests are electoral behaviour, political psychology, democratic<br />
processes <strong>and</strong> e-democracy.<br />
This paper is an revised <strong>and</strong> exp<strong>and</strong>ed version of a paper titled ‘Impact of<br />
voting <strong>advice</strong> <strong>applications</strong> on voters’ decision-making’ presented at the<br />
conference ‘Internet, Politics, Policy 2010: An Impact Assessment’, Oxford,<br />
16–17 September.<br />
1 Introduction<br />
<strong>Voting</strong> <strong>advice</strong> <strong>applications</strong> (VAAs) have become increasingly popular over the last<br />
several years. Today, they have established themselves as essential parts of most major<br />
electoral campaigns. During the 2007 electoral campaign in Switzerl<strong>and</strong>, the VAA<br />
smartvote (http://www.smartvote.ch) was used by about 375,000 voters (Fivaz <strong>and</strong><br />
Nadig, 2010; Ladner et al., 2010). In relation to the 2.4 million voters who participated in<br />
the election, this means that about 15% of voters used smartvote prior to their electoral<br />
decision-making.<br />
Similar developments can be observed in a number of other countries. In Germany,<br />
for instance, the VAA Wahl-O-Mat (http://www.wahl-o-mat.de) delivered 6.2 million<br />
voting recommendations for the 2009 elections, which corresponds to about 12% of the<br />
electorate (Garzia, 2010). The Netherl<strong>and</strong>s are probably the country where VAAs are<br />
most popular. In the weeks before the 2010 elections, the VAA Stemwijzer<br />
(http://www.stemwijzer.nl) delivered 4.2 million voting recommendations, while the<br />
VAA Kieskompas (http://www.kieskompas.nl) added another 1.5 million to the total of<br />
5.7 million voting recommendations (Louwerse <strong>and</strong> Rosema, 2011). Thus, the number of<br />
voting recommendations issued in 2010 corresponds to more than 50% of Dutch voters.<br />
With regard to this widespread popularity, it is not surprising that, in recent years,<br />
VAA-related research has drawn attention more <strong>and</strong> more to the question of whether<br />
VAAs affect the electoral decisions of their users. Several studies have conducted online<br />
surveys among VAA users <strong>and</strong> asked them directly whether the received voting<br />
recommendations had an impact on their <strong>party</strong> <strong>choice</strong>s. In the Swiss case, about 70% of<br />
users stated that they were affected by the VAA smartvote in their vote <strong>choice</strong>s (Ladner<br />
et al., 2010b). This is an unusually high figure <strong>and</strong> might be due to the complexity of the<br />
Swiss electoral system <strong>and</strong> the far-reaching possibilities involved in the voting process<br />
compared to other countries.<br />
Therefore, the smartvote users were asked more precisely how the smartvote<br />
recommendations affected their voting decisions. Only 15% of those who were<br />
influenced stated that they had adopted the recommendations in their entirety <strong>and</strong> copied<br />
them onto the ballot papers. The other users adopted the recommendations only partially.
<strong>Voting</strong> <strong>advice</strong> <strong>applications</strong> <strong>and</strong> <strong>party</strong> <strong>choice</strong> 369<br />
For instance, they listed c<strong>and</strong>idates <strong>from</strong> different lists on their ballot papers (so-called<br />
“panaschieren” or split voting), or they listed c<strong>and</strong>idates twice <strong>and</strong> thus gave them two<br />
votes (so-called “kumulieren” or cumulative voting) (Ladner et al., 2010).<br />
Therefore, the Swiss results need to be interpreted against the background of the<br />
specific Swiss electoral system, <strong>and</strong> they cannot be directly compared with results <strong>from</strong><br />
other countries. In other countries, VAA users were asked whether the use of VAAs had<br />
led to voting for a <strong>party</strong> other than the one originally intended. The resulting figures vary<br />
strongly depending on the country. In the Netherl<strong>and</strong>s, between 10% (Kleinnijenhuis<br />
et al., 2008) <strong>and</strong> 15% of users (Aarts <strong>and</strong> van der Kolk, 2007) claimed to have adjusted<br />
their electoral decisions due to the recommendations received. For Germany, this figure<br />
is 6% (Marschall, 2005), <strong>and</strong> for Finl<strong>and</strong>, it is as low as 3% (Mykkänen <strong>and</strong> Moring,<br />
2006).<br />
The VAA researchers themselves view these findings rather critically. Most of the<br />
cited studies are based on pre-electoral surveys. Correspondingly, what is captured are<br />
voting intentions <strong>and</strong> not real voting decisions. A Belgian study captured both voting<br />
intentions <strong>and</strong> voting decisions for the users of the VAA Do De Stemtest! by means of<br />
comparing data <strong>from</strong> pre- <strong>and</strong> post-electoral surveys. Among those users who said that<br />
the Stemtest had convinced them to vote for another <strong>party</strong>, only two-thirds effectively did<br />
so in the end. This study, thus, concludes that the evaluation of voting intentions is a very<br />
unreliable measure of the impact of VAAs. Post-electoral questioning leads to more<br />
reliable results (Walgrave et al., 2008). In addition, there is also the problem of an overreporting<br />
effect – a problem inherent to all survey-based research.<br />
Considering this critique on the direct measurement of a VAA’s impact, we decided<br />
to try to measure the potential impact of VAAs by means of an indirect impact<br />
measurement. In this study, we will examine whether those users who stated that they<br />
were influenced by the voting recommendations have a higher probability of swingvoting<br />
in elections.<br />
In the following section, we present a few theoretical insights into the question of<br />
why it can be expected that VAAs affect their users’ electoral decision-making. The third<br />
section contains information about the datasetused, <strong>and</strong> the following sections present<br />
our empirical analyses. We conclude with a discussion <strong>and</strong> outlook for future VAA<br />
research.<br />
2 Theoretical considerations<br />
Since there is hardly any theoretical-oriented literature on VAAs to be found, we are<br />
bound to apply findings <strong>and</strong> debates <strong>from</strong> the general literature on electoral behaviour to<br />
gain some theoretical foundations concerning the question of the expected influence of<br />
VAAs on their users’ electoral decision-making.<br />
What determines the electoral <strong>choice</strong>s of voters? State-of-the-art theories on electoral<br />
behaviour stress – besides other factors such as <strong>party</strong> attachment <strong>and</strong> affection for<br />
c<strong>and</strong>idates– the crucial role of issue voting (Niemi <strong>and</strong> Weisberg, 2001, p.14). A large<br />
number of studies have shown the decisive importance of political parties’ issue positions<br />
on a voter’s electoral <strong>choice</strong>s [e.g. Alvarez <strong>and</strong> Nagler, 2000; Powell, 2000; Kriesi <strong>and</strong><br />
Sciarini, 2003 (for the case of Switzerl<strong>and</strong>), <strong>and</strong> Schoen <strong>and</strong> Weiss, 2005].
370 A. Ladner, J. Fivaz <strong>and</strong> J. Pianzola<br />
Klein (2006, p.595) emphasises the importance of issue voting <strong>and</strong> describes,<br />
according to normative democratic theories, the ideal voter as follows: the ideal voter<br />
informs himself carefully about all the pressing political issues <strong>and</strong> the positions of<br />
political parties toward them. Then the voter compares the parties’ positions with his<br />
own preferences <strong>and</strong> makes voting decisions based on this matching. Klein concludes<br />
that the services provided by VAAs come very close to this normative ideal for electoral<br />
decision-making.<br />
All VAAs are based on the concept of issue voting or, to be more precise, on the<br />
well-known proximity model of Downs (1957). Downs’ original model had a simple<br />
setting that was based on an election with only one issue dimension (usually the left-right<br />
dimension) <strong>and</strong> only two competing c<strong>and</strong>idates. According to Downs, a voter will vote<br />
for the c<strong>and</strong>idate that is closest to one’s own position on the particular issue dimension.<br />
Downs’ model fits quite well for elections within the electoral system in the USA. Over<br />
the following years, the model was adapted to more complex electoral systems such as<br />
those in European countries (e.g. constituencies with more than one seat, <strong>party</strong> systems<br />
with more than two parties, or electoral systems with open lists; see Cox,1997). The<br />
model was also extended in the direction of including multiple issue dimensions instead<br />
of only one.<br />
By adapting the model to more complex electoral <strong>and</strong> <strong>party</strong> systems beyond that of<br />
the USA, the model itself increased in complexity. Today, the proximity-voting model is<br />
often criticised on the grounds that the average voter is not willing to or even capable<br />
of gathering <strong>and</strong> processing all the necessary information to perform the dem<strong>and</strong>ed<br />
comparison of policy positions. This might be feasible in the rather simplified original<br />
model, but clearly not in elections with multiple parties debating on a large number of<br />
political issues (Rabinowitz <strong>and</strong> MacDonald, 1989).<br />
This critique concerning voters’ limited information-collecting <strong>and</strong> informationprocessing<br />
capacities opens a link to VAAs because they seem to offer an interesting<br />
solution. VAAs reduce voters’ information <strong>and</strong> transaction costs at large (Jeitziner,<br />
2004). They provide easily accessible information on the policy positions of political<br />
parties <strong>and</strong> not only for one issue but for a large number of issues. Supported by a VAA,<br />
everyone should be capable of conducting his own personalised issue-matching with all<br />
the relevant political parties within a couple of minutes. Given the large number of voters<br />
using VAAs, they are obviously offering services that are needed <strong>and</strong> appreciated by<br />
voters.<br />
This leads us to our assumption that VAAs have an impact on the electoral <strong>choice</strong>s of<br />
the voters using them. This assumption is supported by an observation about voters’<br />
<strong>party</strong> attachment. Party attachment is seen within the social-psychological theory of<br />
voting as one of the main factors to explain voting decisions (e.g. Schoen <strong>and</strong> Weiss,<br />
2005). Voters use a close <strong>party</strong> identification as a kind of a shortcut or cue that allows<br />
them to reduce both the complexity <strong>and</strong> the cost of making a voting decision. However,<br />
the last ten to 20 years have shown a constant decline in voters’ <strong>party</strong> attachments in<br />
almost all advanced democracies. Voters’ ties to parties are loosening (e.g. there has been<br />
a decline in <strong>party</strong> memberships or growth in distrust of parties). Furthermore, their<br />
electoral behaviour has become more volatile <strong>and</strong> led to an increase in swing-voting<br />
(Dalton <strong>and</strong> Wattenberg, 2000; Dalton, 2006). Because of this evident decline, the<br />
explanatory power of <strong>party</strong> attachment for electoral <strong>choice</strong> seems questionable, <strong>and</strong> it<br />
leads to the assumption that voters might be more open to seeking new cues with respect<br />
to their voting decisions.
<strong>Voting</strong> <strong>advice</strong> <strong>applications</strong> <strong>and</strong> <strong>party</strong> <strong>choice</strong> 371<br />
Finally, research on the impact of electoral systems on electoral behaviour <strong>and</strong><br />
electoral outcome offers some support for our assumption concerning the impact of<br />
VAAs. In his seminal work, Duverger (1959) stated that electoral systems based on<br />
proportional representation lead to <strong>party</strong> systems with more than two parties. More recent<br />
research supports this view <strong>and</strong> could further show that, with an increasing number of<br />
seats per electoral district, the number of parties <strong>and</strong> c<strong>and</strong>idates is also increasing (Cox,<br />
1997). In addition, the findings presented by Ezrow (2010) indicate that larger electoral<br />
districts also lead to more niche parties, which address issues that are more or less<br />
neglected by the traditional parties. To sum up, proportional representation combined<br />
with the increasing size of electoral districts leads to a large <strong>and</strong> growing offer of parties<br />
– <strong>from</strong> quantitative as well as thematic perspectives – on which voters can base their<br />
electoral decisions. These exp<strong>and</strong>ed offerings again make it more difficult <strong>and</strong> timeconsuming<br />
for voters to find suitable parties or c<strong>and</strong>idates to vote for (Sartori, 1968; Cox,<br />
1997). Thus, it is reasonable to assume that, at least in large districts, VAAs could offer<br />
some assistance in this regard.<br />
Even though there are – as we could show – several good reasons to assume that<br />
VAAs affect voters’ electoral <strong>choice</strong>s, the findings of the few existing empirical studies<br />
on this topic show contradictory results. Walgrave et al. (2008) analysed the Belgian<br />
VAA Stemtest (“Do the Vote Test”) <strong>and</strong> its impact on voters during the 2004 election<br />
campaign in Belgium. They found <strong>evidence</strong> that the Stemtest affected Belgian voters in<br />
their electoral <strong>choice</strong>s but only on a very modest level. These findings about the limited<br />
effect of VAAs are somewhat in contrast to those of other studies. Both Kleinnijenhuis et<br />
al. (2007) <strong>and</strong> Rusuuvirta <strong>and</strong> Rosema (2009) found <strong>evidence</strong> that, in elections in the<br />
Netherl<strong>and</strong>s, VAAs played an important role <strong>and</strong> had a clear impact on the voting<br />
decisions of Dutch voters.<br />
In our study, we trace the possibility of whether the information about parties <strong>and</strong><br />
c<strong>and</strong>idates provided by smartvote influences people in their voting decisions <strong>and</strong> whether<br />
this influence might eventually lead voters to rethink their initial <strong>party</strong> preferences.<br />
Although we cannot make any causal claims regarding the relationship between the VAA<br />
voting recommendations <strong>and</strong> the final vote <strong>choice</strong>s of voters, we can nevertheless<br />
examine whether we find higher occurrences of swing-voting among those smartvote<br />
users who report that they were, in fact, receptive toward the voting <strong>advice</strong> given to them<br />
by smartvote.<br />
3 Data<br />
Against the background of the 2007 Swiss parliamentary elections, the NCCR Democracy<br />
research project conducted two surveys among the users of smartvote. 1 The first survey<br />
started before the election. After receiving their voting recommendations, users were<br />
asked to participate in the additional NCCR survey by clicking on a link that led them to<br />
a special website where they could fill out the pre-election survey, which included<br />
questions about socio-demographic characteristics, voting behaviour in previous<br />
elections, <strong>and</strong> voting intentions with regard to the upcoming election. Some days after the<br />
election, the respondents received an e-mail <strong>and</strong> were asked to fill out the post-election<br />
survey, which focused on actual voting behaviour in the 2007 elections. In total, 4331<br />
users completed this survey.<br />
In addition, a second post-election survey was conducted. This second survey<br />
comprised both parts of the first survey <strong>and</strong> was conducted after the election. Smartvote<br />
offers its users the opportunity to create their own user accounts on the website to save
372 A. Ladner, J. Fivaz <strong>and</strong> J. Pianzola<br />
their answers <strong>and</strong> results <strong>and</strong> to receive additional services. In 2007, a total of 80,225<br />
users owned such accounts. A few days after the elections, all smartvote users with a user<br />
account received an e-mail <strong>and</strong> were asked to support the NCCR research project <strong>and</strong> to<br />
participate in this second survey, <strong>and</strong> 13,959 of them did so.<br />
Data <strong>from</strong> both surveys could be merged into one combined dataset comprising<br />
18,290 respondents in total. Although the data contains a large number of respondents,<br />
we cannot claim that it is representative with regard to the entire population of smartvote<br />
users. That the data stems <strong>from</strong> a self-selected group of smartvote users has to be kept in<br />
mind with regard to the empirical analysis.<br />
To determine the validity of our data, we cross-checked the socio-demographic<br />
profile of smartvote users with the findings of several previous studies. First, we checked<br />
our socio-demographic profile of smartvote users with the profile of a previous study<br />
conducted by Fivaz <strong>and</strong> Nadig (2010). Instead of the NCCR survey data, they used data<br />
<strong>from</strong> the Swiss electoral study (Selects), a representative telephone-based survey. We<br />
found a very similar pattern in both profiles of smartvote users. Furthermore, we also<br />
compared our profile with those of VAA users in other countries (Marchall, 2005;<br />
Marschall <strong>and</strong> Schmidt, 2010; Wall et al., 2009) <strong>and</strong> again found similar patterns. In our<br />
own data as well as in all available studies, the typical VAA user is male, young, <strong>and</strong><br />
well-educated. He also has a high interest in politics <strong>and</strong> exhibits above-average political<br />
activity.<br />
Therefore, we can assume that this dataset is of sufficient quality for the results to be<br />
comparable to those of VAA research <strong>from</strong> other countries. Our aim is not to draw any<br />
general conclusions with regard to the overall impact of smartvote on the elections but,<br />
rather, to remain in the realm of how the tool affected those who actually used it <strong>and</strong><br />
answered our surveys.<br />
4 First analyses: direct impact measurement<br />
The post-electoral surveys conducted among smartvote users contained a number of<br />
questions aimed directly at measuring the potential impact of smartvote. Survey<br />
participants were asked whether the use of smartvote had a direct influence on their<br />
voting decisions or not <strong>and</strong>, if so, how exactly smartvote affected their decisions.<br />
Asked directly, 67% of the respondents stated that smartvote had affected their voting<br />
decisions. These findings differ to a large extent <strong>from</strong> results of similar studies for<br />
Germany, the Netherl<strong>and</strong>s, <strong>and</strong> Belgium. According to Marschall (2005), in Germany,<br />
only 6% of voters using a VAA were directly affected in their electoral decision, <strong>and</strong> in<br />
Belgium, VAAs had an impact only on a small percentage of their users (Walgrave et al.,<br />
2008). Research results for the Netherl<strong>and</strong>s show higher values (Aarts <strong>and</strong> van der Kolk,<br />
2007), but at 15%, there is still a significant difference <strong>from</strong> the 67% we found for<br />
Switzerl<strong>and</strong>. We will return to this aspect later.<br />
In the following tables, we present descriptive statistics about the influence of<br />
smartvote on different user groups. Table 1 shows the share of influenced users with<br />
regard to age, gender, <strong>and</strong> educational level.<br />
Table 1 shows that there are only minor differences between voters with regard to<br />
educational level or gender. The largest differences by far can be found between the<br />
several age groups. The influence of smartvote on voting decisions is strongest among<br />
young voters.
<strong>Voting</strong> <strong>advice</strong> <strong>applications</strong> <strong>and</strong> <strong>party</strong> <strong>choice</strong> 373<br />
Table 1 Influence of smartvote on voting decisions – Part 1<br />
Age groups<br />
Share of smartvote users (voters) influenced in their voting decisions<br />
Yes (%) No (%) N (=100%)<br />
18–24 71 29 3346<br />
25–34 73 27 4759<br />
35–44 68 32 3461<br />
45–54 59 41 2400<br />
55–64 54 46 1637<br />
65+ 48 52 711<br />
Gender<br />
Male 65 35 11,382<br />
Female 70 30 4968<br />
Educational Level<br />
Low 69 31 490<br />
Middle 66 34 5850<br />
High 67 33 9774<br />
Source: NCCR “Democracy”, IP16 “smart-voting 2.0” (http://www.nccr-democracy.<br />
uzh.ch/research/module5/smart-voting/smart-voting)<br />
One distinct aspect of the Swiss electoral system is the large variance between the<br />
electoral districts (cantons) with regard to their size. The number of seats (M) per<br />
constituency differs between one <strong>and</strong> 34. Subsequently, the number of c<strong>and</strong>idates (C)<br />
running for a seat also differs to a large degree. In Table 2, we compare the ratio between<br />
C <strong>and</strong> M – in other words, the number of c<strong>and</strong>idates per seat – with the impact of<br />
smartvote on its users. The more c<strong>and</strong>idates are running for a seat, the more information<br />
has to be gathered <strong>and</strong> processed by voters. Thus, the aforementioned information<br />
problem of voters is most pressing in those constituencies with the highest C/M ratio.<br />
Due to this factor, we assume that the influence of VAAs is stronger in constituencies<br />
with more c<strong>and</strong>idates running for a seat.<br />
Table 2 Influence of smartvote on voting decisions – Part 2<br />
C/M ratio*<br />
Share of smartvote users (voters) influenced in their voting decisions<br />
Yes (%) No (%) N (=100%)<br />
1 22 78 46<br />
3 13 87 16<br />
4 33 67 42<br />
7 52 48 103<br />
8 31 69 99<br />
9 54 46 474<br />
10 50 50 221
374 A. Ladner, J. Fivaz <strong>and</strong> J. Pianzola<br />
Table 2<br />
Influence of smartvote on voting decisions – Part 2 (continued)<br />
C/M ratio*<br />
Share of smartvote users (voters) influenced in their voting decisions<br />
Yes (%) No (%) N (=100%)<br />
11 59 41 1087<br />
12 60 40 2514<br />
13 72 28 1147<br />
16 68 32 1448<br />
18 62 38 407<br />
19 66 34 1453<br />
20 72 28 3376<br />
24 72 28 3941<br />
Total 67 33 16,374<br />
Source: NCCR “Democracy”, IP16 “smart-voting 2.0” (http://www.nccr-democracy.<br />
uzh.ch/research/module5/smart-voting/smart-voting)<br />
Notes: *C/M-ratio: the numerical relation between the number of c<strong>and</strong>idates (C) <strong>and</strong><br />
the number of seats (M) in a particular constituency. The higher the C/M ratio<br />
is, the more c<strong>and</strong>idates are competing against each other per seat.<br />
Indeed, Table 2 supports our assumption. The higher the C/M ratio in a constituency is,<br />
the more smartvote users were affected in their voting decisions by the voting<br />
recommendations they received.<br />
With regard to the Swiss electoral system, voters have multiple options at their<br />
disposal to express their political preferences on the ballots. Hence, voters using<br />
smartvote were also asked how, in particular, they were affected in their electoral <strong>choice</strong>s<br />
(see Table 3).<br />
Table 3<br />
Influence of smartvote on voting decisions (in percentage)<br />
Yes (%) No (%) N (=100%)<br />
Did you copy the smartvote recommendations<br />
without any changes onto your voting list?<br />
Based on the smartvote recommendations, did<br />
you vote for c<strong>and</strong>idates <strong>from</strong> different lists (votesplitting)?<br />
Based on the smartvote recommendations, did you<br />
vote for parties <strong>and</strong> c<strong>and</strong>idates that you would<br />
otherwise not have voted for?<br />
Based on the smartvote recommendations, did you<br />
abstain <strong>from</strong> voting for parties <strong>and</strong> c<strong>and</strong>idates you<br />
would otherwise have voted for?<br />
15 85 10,650<br />
61 39 10,580<br />
67 33 10,559<br />
35 65 10,372<br />
Source: NCCR “Democracy”, IP16 “smart-voting 2.0” (http://www.nccr-democracy.<br />
uzh.ch/research/module5/smart-voting/smart-voting).<br />
According to Table 3, only a small number of voters copied the voting recommendations<br />
without any changes onto their ballots. This indicates that VAAs do not produce a kind<br />
of an “instant voter” whose voting decisions are completely computer-generated without<br />
reflection on the results. In fact, the opposite seems to be the case. As we can see <strong>from</strong>
<strong>Voting</strong> <strong>advice</strong> <strong>applications</strong> <strong>and</strong> <strong>party</strong> <strong>choice</strong> 375<br />
Table 3, most of the voters used the voting recommendations to refine their ballots. Due<br />
to smartvote, they split their votes more often <strong>and</strong> also voted more often for c<strong>and</strong>idates<br />
that they otherwise would have overlooked. These findings are in line with <strong>evidence</strong><br />
<strong>from</strong> another study, which could show that users do not trust smartvote blindly but that<br />
they use it as a starting point for gathering further information about the c<strong>and</strong>idates<br />
ranking highest in their voting recommendations (Fivaz <strong>and</strong> Nadig, 2010). For our later<br />
analysis, it is particularly interesting to see that two-thirds of users indicated that they<br />
voted for parties or c<strong>and</strong>idates that they otherwise would not have voted for. We will<br />
follow up on this tendency when we assess whether those who were influenced by the<br />
tool in their decisions actually changed their vote <strong>choice</strong>s to another <strong>party</strong> – an impact<br />
that would have the strongest consequences for the elections in general.<br />
So far, the survey answers of users show that some smartvote users had been strongly<br />
influenced by the tool in their voting decisions. Even though not all users are affected to<br />
the same degree, the impact on all groups of users is on, an average, several times higher<br />
than that observed in other countries. Whether this is due to country specifics of the<br />
election process, the tool, or simply an artefact of the self-selected sample cannot be<br />
determined at this point. The next section offers a more in-depth analysis of potential<br />
impacts of the tool on voters by focusing on actual changes in the voting behaviour of<br />
users.<br />
5 In-depth analyses: swing voters among smartvote users<br />
As presented in the previous section, a large majority of smartvote users in our sample<br />
stated that the tool affected their vote <strong>choice</strong>s. However, we likewise mentioned that we<br />
do not know whether this influence was actually exercised at the polls. As Walgrave<br />
et al.’s (2008) study on the 2004 Belgian elections suggests, VAAs seem to affect<br />
people’s vote intentions <strong>and</strong>, to a lesser degree, their actual vote <strong>choice</strong>s. According to<br />
the authors, people tend to report that the voting recommendations affected their vote<br />
intention but do not exhibit this change of mind at the polls. Since the chance of overreporting<br />
the effects of the tool is great, we will now use a different indicator to measure<br />
the potential influences of smartvote on people’s voting behaviour. Instead of the direct<br />
question used in the preceding section, we will use swing-voting as an alternative,<br />
indirect impact measurement. As outlined earlier, a majority of users stated that they<br />
ended up voting for someone that they would not have considered before using the tool.<br />
Our question is, therefore, whether we can observe an effective vote change among those<br />
users who reported that the tool influenced their vote <strong>choice</strong>s.<br />
Swing voters are defined as voters who changed their <strong>party</strong> <strong>choice</strong>s in 2007 compared<br />
to their <strong>party</strong> <strong>choice</strong>s in the previous elections. Since the voting recommendations are<br />
based on extensive policy congruence, chances are that these services reveal a matching<br />
outcome that is different <strong>from</strong> what people might have expected. Furthermore, since they<br />
gain additional information, it is likely that this might alter the perception that people<br />
have of parties or c<strong>and</strong>idates. If they then place enough trust in the tool <strong>and</strong> are<br />
convinced by the outcome, they might be inclined to adapt their initial <strong>choice</strong>s<br />
accordingly. At the same time, it is also likely that those who do not have clear-cut<br />
preferences with regard to their <strong>party</strong> <strong>choice</strong>s or are uncertain about which <strong>party</strong> they
376 A. Ladner, J. Fivaz <strong>and</strong> J. Pianzola<br />
should vote for are more amenable toward the services provided by VAAs. The<br />
following table presents the bivariate association between those voters who reported that<br />
the tool had influenced their vote <strong>choice</strong>s <strong>and</strong> swing-voting.<br />
Table 4<br />
Swing voters influenced by smartvote in their voting decisions<br />
Reported to be influenced by smartvote in their votes <strong>choice</strong>s<br />
Yes (%) No (%) N(=100%)<br />
Swing voters<br />
Yes 73 27 4426<br />
No 56 44 7082<br />
Total 63 37 11,508<br />
Source: NCCR “Democracy”, IP16 “smart-voting 2.0” (http://www.nccr-democracy.<br />
uzh.ch/research/module5/smart-voting/smart-voting).<br />
As expected, those who stated that they were influenced by the voting recommendations<br />
in their vote <strong>choice</strong>s are also more likely to swing-vote (73% vs. 56%). In the next step,<br />
we will assess whether being influenced by the smartvote voting recommendations holds<br />
as a significant predictor for vote change if we control for relevant covariates. Through a<br />
logistic regression, we ascertain the probability of vote change based on the influence<br />
that smartvote had on users. The aim is to determine whether the previous illustrated<br />
differences can be maintained if we take other relevant factors into account. It has to be<br />
stressed beforeh<strong>and</strong> that any findings hold only for the sample at h<strong>and</strong>.<br />
The dependent variable in our logistic regression is vote change between elections.<br />
The dichotomised variable takes on the value of 1 if respondents changed their vote<br />
<strong>choice</strong>s in comparison to the previous elections <strong>and</strong> 0 if they did not change their vote<br />
<strong>choice</strong>s. The variable “influenced by voting recommendations” is also binary <strong>and</strong><br />
indicates whether voters reported that smartvote affected their vote <strong>choice</strong>s. We also<br />
assess how much the nature of the voting recommendations influences the probability of<br />
swing-voting. We asked participants whether the voting recommendations they received<br />
met their expectations or whether they were surprised by the results they got. The<br />
reception of the voting recommendations was measured on a 4-point scale; thus, three<br />
dummies <strong>and</strong> their respective reference categories are used as covariates in the model.<br />
We expect that, on average, the likelihood of swing-voting increases with the surprise of<br />
a voter about the voting recommendations. The reasoning behind this is as follows: if a<br />
voter is surprised by the voting recommendations, the recommended parties/c<strong>and</strong>idates<br />
most likely differ <strong>from</strong> that of voters’ initial <strong>party</strong> preferences (otherwise, she would not<br />
be surprised). If the voter is convinced by the voting recommendations, she might adapt<br />
her initial <strong>choice</strong>s <strong>and</strong> vote in accordance with the voting recommendations (swingvoting<br />
if this occurs on the <strong>party</strong> level). At the same time, surprising voting<br />
recommendations might also cause the opposite reaction in that the voter dismisses it<br />
altogether. In any case, a voter who receives voting recommendations that meets her<br />
expectations is most likely simply strengthened in going along with her initial <strong>party</strong><br />
<strong>choice</strong>s (thus yielding no swing-voting). On average, therefore, we expect that surprising<br />
voting recommendations is more likely to trigger swing-voting than expected results in<br />
the voting recommendations.
<strong>Voting</strong> <strong>advice</strong> <strong>applications</strong> <strong>and</strong> <strong>party</strong> <strong>choice</strong> 377<br />
A further important (continuous) covariate that we take into account is age. We show,<br />
based on direct measurement, that the impact of smartvote on voting decisions decreases<br />
with the increasing age of the voters (see Table 1). This finding is supported by a<br />
previous study, which also found <strong>evidence</strong> that younger voters were more likely to be<br />
influenced by the voting recommendations in their vote <strong>choice</strong>s (Fivaz <strong>and</strong> Nadig, 2010,<br />
p.182). This could result <strong>from</strong> the fact that political preferences tend to become more<br />
consolidated with increasing age <strong>and</strong> are, thus, less amenable to newly encountered<br />
information. At the same time, younger users are more familiar with online-based<br />
communication <strong>and</strong> information <strong>and</strong> might, thus, be less sceptical with regard to its<br />
services. Whatever the case, similar mechanisms might be at play in terms of a higher<br />
tendency to adapt <strong>party</strong> preferences among younger voters. Hence, we not only expect<br />
that younger voters are more likely to adapt initial <strong>party</strong> preferences but we also expect<br />
age to condition the effect that the voting recommendations have on swing voting. In<br />
other words, the assumption is that the probability of swing-voting among those who<br />
were influenced by the voting recommendations compared to those who were not is<br />
higher among younger voters than among older voters. Therefore, we add an interaction<br />
term (age*influenced by voting recommendation) in our model to examine whether the<br />
influence of the voting recommendations on swing-voting is moderated by age.<br />
Further covariates that could boost the probability of vote change are political<br />
ideology <strong>and</strong> multiple vote propensities. Voters in the middle of the political spectrum<br />
are expected to be more inclined to switch between available parties. Multiple vote<br />
propensities measure whether a voter has an inclination to vote for more than one <strong>party</strong><br />
with a very high likelihood. The “vote propensity question” in election surveys asks<br />
voters to indicate the likelihood that they will ever vote for specific parties on an 11-point<br />
scale (Van der Eijk et al., 2006; Van der Eijk <strong>and</strong> Franklin, 2009). Those voters who<br />
indicate high likelihoods (vote propensities higher than 8) for one or more <strong>party</strong> besides<br />
their most preferred one are coded as voters with multiple vote propensities. This binary<br />
covariate is of utmost importance since it controls to some degree the fact that voters<br />
with several <strong>party</strong> preferences might be more inclined to swing-vote <strong>and</strong> more<br />
susceptible tothe services provided by VAAs. A binary measure for <strong>party</strong> attachment is<br />
included since we expect that strong <strong>party</strong> followers are less likely to adapt their vote<br />
intentions.<br />
To control for contextual circumstances, we included variables that measure the<br />
degree of competition in the different constituencies in Switzerl<strong>and</strong>. The ratio of<br />
competing c<strong>and</strong>idates per available seat indicates the degree of variation for <strong>choice</strong>s – the<br />
higher the competition is for the available seat, the bigger the <strong>choice</strong> set <strong>and</strong> the higher<br />
the probability are for deciding on a c<strong>and</strong>idate <strong>from</strong> a different <strong>party</strong>. Thus, we controlled<br />
for the variation within cantons by including 14 dummies for the 15 different district<br />
magnitudes in our model. We also controlled for socio-demographic indicators such as<br />
gender, education, <strong>and</strong> income. Table 5 contains the corresponding results (the full model<br />
including all 14 dummies <strong>and</strong> 15 district seizes is attached in the Appendix A).<br />
In logistic regressions with interactions present, the interpretation of the results<br />
differs substantially <strong>from</strong> a regular regression. Without elaborating on the technicalities<br />
behind it (cf. Norton et al., 2004), the sign <strong>and</strong> the significance of the interaction<br />
coefficient <strong>and</strong> the corresponding single coefficients cannot be directly interpreted <strong>from</strong><br />
the model. Thus, as recommended by Long <strong>and</strong> Freese (2006), we plot predicted<br />
probabilities based on the main variables of interest <strong>and</strong> their interaction (influenced by
378 A. Ladner, J. Fivaz <strong>and</strong> J. Pianzola<br />
the voting recommendations, age, <strong>and</strong> the respective interaction). Figure 1 illustrates the<br />
predicted probabilities for swing-voting for those who were influenced by the smartvote<br />
voting recommendations (black dots) versus those who were not influenced by it (blue<br />
dots) for different age levels. The vertical confidence intervals indicate the relative<br />
significance of the predicted point estimates.<br />
Table 5<br />
Logit predictions for <strong>party</strong> change<br />
Independent variables<br />
Influenced by voting recommendations<br />
Age<br />
Age*influenced by voting recommendations<br />
Rather unsurprised by voting recommendations<br />
Rather surprised by voting recommendations<br />
Very surprised by voting recommendations<br />
Multiple vote propensities<br />
Party attachment<br />
Ideology (centre vs. left/right)<br />
Gender<br />
Educational level<br />
Income level<br />
Vote change<br />
0.60*<br />
(0.31)<br />
–0.01***<br />
(0.00)<br />
–0.006<br />
(0.007)<br />
0.12<br />
(0.11)<br />
0.18<br />
(0.14)<br />
0.69***<br />
(0.28)<br />
0.30***<br />
(0.11)<br />
–0.44***<br />
(0.09)<br />
0.36***<br />
(0.09)<br />
–0.11<br />
(0.10)<br />
0.00<br />
(0.06)<br />
–0.02<br />
(0.03)<br />
Constant<br />
–0.39<br />
(0.83)<br />
Observations 2551<br />
Log likelihood –1620<br />
Log likelihood 0 –1705<br />
AIC 3295<br />
Correctly predicted cases 64%<br />
Source: NCCR “Democracy”, IP16 “smart-voting 2.0” (http://www.nccr-democracy.<br />
uzh.ch/research/module5/smart-voting/smart-voting).<br />
Notes: St<strong>and</strong>ard errors in parentheses; *** p
<strong>Voting</strong> <strong>advice</strong> <strong>applications</strong> <strong>and</strong> <strong>party</strong> <strong>choice</strong> 379<br />
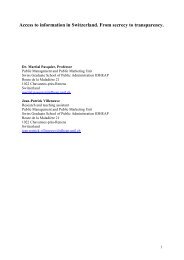
Figure 1 Predicted probabilities for vote change for influenced vs. not-influenced smartvote<br />
users based on specific values for age (see online version for colours)<br />
Predicted Probabilities for Vote Change<br />
.2 .3 .4 .5 .6<br />
20 30 40 50 60 70<br />
Age<br />
Not influenced<br />
Influenced<br />
95% CI<br />
95% CI<br />
Source: NCCR “Democracy”, IP16 “smart-voting 2.0” (http://www.nccr-democracy.<br />
uzh.ch/research/module5/smart-voting/smart-voting). Author’s calculations.<br />
Note: Predicted probabilities for vote change among those who were influenced <strong>and</strong><br />
those who were not influenced at specific values for age, averaged over the<br />
remaining covariates.<br />
Figure 1 illustrates that young voters who were influenced by the voting recommendations<br />
have a higher probability than older voters to change their vote <strong>choice</strong>s. Moreover, the<br />
probability of swing-voting is higher among those who were influenced by the voting<br />
recommendations than among those who were not influenced in their vote <strong>choice</strong>s. The<br />
confidence intervals around the point estimates indicate that the difference between the<br />
two groups is significant, with the exception of the age groups of 60 <strong>and</strong> 70. This is most<br />
likely due to the small sample size in these categories, which make a precise estimation<br />
more difficult (indicated by the larger confidence intervals). The exact values of the point<br />
estimates are not relevant in this context since they are dependent <strong>and</strong> vary according to<br />
the values set for the covariates. We are interested only in the differences <strong>and</strong><br />
significance of the point estimates, which, in our case, remain stable even if we specify<br />
different values for the remaining covariates. In sum, the estimated model indicates that<br />
the probability for swing voting is higher among those smartvote users who indicated that<br />
they were influenced by the voting recommendations <strong>and</strong> more so for younger users than<br />
for older users.
380 A. Ladner, J. Fivaz <strong>and</strong> J. Pianzola<br />
Furthermore, the model indicates that voters who were surprised by the voting<br />
recommendations they received were more likely to swing-vote compared to those who<br />
were not surprised by them. The probability of swing-voting, however, significantly<br />
increases only for those who were very surprised by the voting recommendations, but not<br />
so for those who were only somewhat surprised by it. Although still a far stretch, this<br />
result suggests that voters who were particularly surprised by the recommended parties<br />
<strong>and</strong> c<strong>and</strong>idates they received might have been inclined to adapt their initial vote <strong>choice</strong>s<br />
accordingly.<br />
As expected, voters in the middle of the political spectrum <strong>and</strong> voters with multiple<br />
vote propensities are more likely to swing vote, while <strong>party</strong> attachment decreases the<br />
likelihood of swing-voting. The number of c<strong>and</strong>idates running per seat also matters, with<br />
higher competition increasing the likelihood of swing-voting among voters in that<br />
constituency. The remaining socio-demographic variables are not significant predictors.<br />
Although the explanatory power of the model is rather weak given the model fit<br />
measures, the number of correctly predicted cases based on the model is substantially<br />
higher compared to r<strong>and</strong>om chance (64% vs. 39%). In this paper, we are mainly<br />
interested in detecting theorised implications while being aware that there is still variance<br />
to be explained. In general, we do not make any claims about effects but remain in the<br />
realm of predictions. The data at h<strong>and</strong> stems <strong>from</strong> a non-r<strong>and</strong>om, self-selected sample of<br />
smartvote users, limiting any sort of interpretation to that specific sample. To improve<br />
the analysis, experimental data or measures to correct for self-selection need to be<br />
taken; only then can any general claims be made. For now, we acknowledge these<br />
shortcomings.<br />
All things considered, the model supports our assumption that voters see smartvote as<br />
a serious <strong>and</strong> useful tool for their decision-making, one that can affect their actual vote.<br />
Thus, the findings in this section go along with those of the previous section. One<br />
argument that might strengthen our findings is that, due to the definition of swing-voting,<br />
we had to exclude those voters who were not eligible to vote in 2003 (the youngest<br />
users). Since it is this age cohort in particular that uses smartvote most frequently <strong>and</strong> is<br />
also most amenable to the tool, we can expect that an analysis that takes those voters into<br />
account as well finds even stronger support for an influence of the tool on decisionmaking.<br />
Another argument that might weaken our findings is that our specific sample<br />
might lead to such strong results. Chances are that convinced <strong>and</strong> highly enthusiastic<br />
smartvote users might have self-selected themselves into taking our survey; thus, we<br />
report a strong influence of the tool among a strongly influenced sample of smartvote<br />
users. For now, we can conclude only that some young smartvote users <strong>and</strong> those who<br />
were most surprised by the voting recommendations have a higher probability of<br />
changing their vote <strong>choice</strong>s between elections.<br />
6 Party change: winners <strong>and</strong> losers<br />
Since our findings suggest that influenced smartvote users are prone to change their vote<br />
<strong>choice</strong>s, our next <strong>and</strong> last step in this analysis is to take a look at the direction of their<br />
vote change. Table 6 shows the flow of votes between the elections of 2003 <strong>and</strong> 2007 for<br />
those voters who were influenced in their vote <strong>choice</strong>s by smartvote.
<strong>Voting</strong> <strong>advice</strong> <strong>applications</strong> <strong>and</strong> <strong>party</strong> <strong>choice</strong> 381<br />
Table 6<br />
Party change between the 2003 <strong>and</strong> 2007 elections among those who were influenced<br />
in their vote decisions by smartvote<br />
Party voted<br />
for in 2003<br />
Party voted for in 2007<br />
CVP FDP SVP SP GPS GLP<br />
Total<br />
CVP<br />
FDP<br />
SVP<br />
SP<br />
GPS<br />
Total<br />
N 59 17 55 41 62 234<br />
% 25.2 7.3 23.5 17.5 26.5 100.0<br />
N 152 99 46 45 135 477<br />
% 31.9 20.8 9.6 9.4 28.3 100.0<br />
N 48 89 19 9 23 188<br />
% 25.5 47.3 10.1 4.8 12.2 100.0<br />
N 135 137 22 728 251 1273<br />
% 10.6 10.8 1.7 57.2 19.7 100.0<br />
N 28 16 6 178 117 345<br />
% 8.1 4.6 1.7 51.6 33.9 100.0<br />
N 363 301 144 298 823 588 2517<br />
% 14.4 12.0 5.7 11.8 32.7 23.4 100.0<br />
Source: NCCR “Democracy”, IP16 “smart-voting 2.0” (http://www.nccr-democracy.<br />
uzh.ch/research/module5/smart-voting/smart-voting).<br />
Notes: Only the major five parties in Switzerl<strong>and</strong> plus the Green-liberals are included<br />
in this table. CVP = Christian-democrats; FDP = Liberal-democrats; SVP =<br />
National-conservatives; SP = Social Democrats; GPS = Greens; GLP = Greenliberals.<br />
The Green-liberals is a new <strong>party</strong> <strong>and</strong> did not run in the 2003<br />
elections.<br />
With regard to the five major parties in Switzerl<strong>and</strong>, a remarkable number of smartvote<br />
users changed their vote to the Green-liberals, a newly founded <strong>party</strong> that ran for seats in<br />
a national election for the first time in 2007. In general, the percentage values indicate<br />
that the major flow of votes is restricted to parties with similar ideological positions. The<br />
largest movement of voters can be found between the Greens <strong>and</strong> the Social Democrats<br />
on the left side of the political spectrum <strong>and</strong> between the Liberals <strong>and</strong> the Nationalconservatives<br />
on the right side. The Christian-democrats, as the classic centre <strong>party</strong>, gains<br />
<strong>and</strong> loses voters to both sides. In contrast, the flows of voters between the parties on the<br />
poles are rather small.2<br />
If we look at the votes received <strong>and</strong> lost by the different parties due to smartvote<br />
users, we find on the winning side the Green-liberals (plus 588 votes) followed by the<br />
Greens (plus 478 votes) <strong>and</strong> the Christian-democrats (plus 129 votes). Among the losing<br />
parties are, first, the Social Democrats (minus 975 votes), followed by the Liberaldemocrats<br />
(minus 176 votes) <strong>and</strong> the National-conservatives (minus 44 votes). These<br />
findings should not be overrated due to the aforementioned problems of the data sample,<br />
but they indicate to some degree which <strong>party</strong> gained <strong>and</strong> which <strong>party</strong> lost votes through<br />
smartvote.
382 A. Ladner, J. Fivaz <strong>and</strong> J. Pianzola<br />
According to our data, there are substantially more left-wing voters among smartvote<br />
users than right-wing voters. Previous research also showed that the typical smartvote<br />
user differs noticeably <strong>from</strong> the typical voter: the smartvote user is younger, better<br />
educated, with a clearly above average political knowledge <strong>and</strong> interest, <strong>and</strong> is<br />
predominantly male (Fivaz <strong>and</strong> Nadig, 2010). Hence, to establish the real extent of the<br />
impact on the election, we would have to know more about the entire population of<br />
smartvote users.<br />
7 Conclusions<br />
VAAs have become increasingly popular <strong>and</strong> emerged as indispensable elements in<br />
electoral campaigns (Marschall <strong>and</strong> Schmidt, 2010). Until now, only a few studies have<br />
focused on the impact of VAAs on the actual voting decisions of their users. In this<br />
paper, we addressed the question of whether the smartvote voting recommendations<br />
influenced people’s vote <strong>choice</strong>s <strong>and</strong> whether it led them to vote for another <strong>party</strong> than<br />
they chose in previous elections.<br />
We showed that a considerable portion of smartvote users were affected by the voting<br />
recommendations in their vote <strong>choice</strong>s. The measured impact in our study is clearly<br />
stronger compared to findings for other countries (Marschall, 2005; Aarts <strong>and</strong> van der<br />
Kolk, 2007; Walgrave et al., 2008; Rusuuvirta <strong>and</strong> Rosema, 2009). In our analysis, we<br />
moved <strong>from</strong> direct survey questions about the impact of the voting recommendations to<br />
an indirect measure of vote change to assess the influence of smartvote on users. Our<br />
estimates show that voters who reported that they were influenced by the VAA had a<br />
significant higher probability of swing-voting, particularly the younger voters. Moreover,<br />
voters who were surprised by the voting recommendations they received also show a<br />
higher likelihood to change their initial voting preference.<br />
Since our data stems <strong>from</strong> a self-selected, non-representative sample, we refrain <strong>from</strong><br />
making any statements other than probability claims. Among those smartvote users who<br />
participated in our survey, clear patterns emerged with regard to who was most<br />
influenced by the tool <strong>and</strong> whose voting decisions were influenced by the voting<br />
recommendations. Whether these findings hold for the entire population of smartvote<br />
users <strong>and</strong> whether those voters would have adapted their vote <strong>choice</strong>s even if they had<br />
not used the tool cannot be determined at this point. Hence, we conclude with a few<br />
suggestions for future VAA research.<br />
First, it is necessary to improve the quality of the available data. Most studies use<br />
data <strong>from</strong> online surveys among VAA users. Thus, self-selection into the sample has the<br />
great potential to bias the results. A representative sample of VAA users would greatly<br />
improve the data quality <strong>and</strong> the subsequent findings; however, for causal claims, further<br />
steps are needed. The best way to approach the question of how VAAs might exert an<br />
impact on their users is to conduct an experiment. The ability to r<strong>and</strong>omly assign study<br />
participants to both users <strong>and</strong> non-users enables researchers to arrive at causal claims –<br />
the most sought-after goal in science. Although it is theoretically the best way forward, in<br />
social science settings, the r<strong>and</strong>om experiment is often plagued by real-world obstacles<br />
such as non-compliance. A further approach would be to increasingly invest in
<strong>Voting</strong> <strong>advice</strong> <strong>applications</strong> <strong>and</strong> <strong>party</strong> <strong>choice</strong> 383<br />
examining the self-selection process that causes voters to use VAAs <strong>and</strong> model the<br />
procedure accordingly (Heckman, 1978, 1979). Further investments can be made in the<br />
realm of comparative research, which would imply stronger international collaboration in<br />
VAA research. A first step could be to develop comparable questionnaires <strong>and</strong> data sets.<br />
For the moment, we can see that some people are highly susceptible to the voting<br />
recommendations that they receive through smartvote <strong>and</strong> that those users tend to change<br />
their vote <strong>choice</strong>s. If this influence of VAAs on individual electoral decisions can be<br />
confirmed in future studies, questions with regard to the quality of VAAs become<br />
increasingly relevant.<br />
Acknowledgements<br />
The article was written within the project IP16 “smart-voting 2.0”, which belongs to the<br />
National Center of Competence in Research “Challenges to Democracy in the 21st<br />
Century” (NCCR Democracy; http://www.nccr-democracy.uzh.ch) <strong>and</strong> is funded by the<br />
Swiss National Science Foundation (SNSF).<br />
References<br />
Alvarez, M. <strong>and</strong> Nagler, J. (2000) ‘A new approach for modelling strategic voting in multi<strong>party</strong><br />
elections’, British Journal of Political Science, Vol. 30, pp.57–75.<br />
Aarts, K. <strong>and</strong> van der Kolk, H. (2007) ‘The parliamentary election in the Netherl<strong>and</strong>s,<br />
22 November 2006’, Electoral Studies, Vol. 26, pp.797–837.<br />
Cox, G.W. (1997) Making Votes Count. Strategic Coordination in the World's Electoral Systems,<br />
Cambridge University Press, Cambridge.<br />
Dalton, R.J. (2006) Citizen Politics. Public Opinion <strong>and</strong> Political Parties in Advanced Industrial<br />
Democracies, CQ Press, Washington, D.C.<br />
Dalton, R.J. <strong>and</strong> Wattenberg, M. (2000) Parties without Partisans. Political Change in Advanced<br />
Industrial Democracies, Oxford University Press, Oxford.<br />
Downs, A. (1957) An Economic Theory of Democracy, Harper <strong>and</strong> Brothers, New York.<br />
Duverger, M. (1954) Political Parties, Wiley, New York.<br />
Ezrow, L. (2010) Linking Citizens <strong>and</strong> Parties. How Electoral Systems Matter for Political<br />
Representation, Oxford University Press, Oxford.<br />
Fivaz, J. <strong>and</strong> Nadig, G. (2010) ‘Impact of internet-based instruments on civic literacy <strong>and</strong> voter<br />
turnout’, Policy & Internet, Vol. 2, No. 4, pp.167–200.<br />
Garzia, D. (2010) ‘The effects of VAAs on users’ voting behaviour: an overview’, in: Cedroni, L.<br />
<strong>and</strong> Garzia, D. (Eds): <strong>Voting</strong> Advice Applications in Europe. The State of the Art, Scripta<br />
Web, Naples, pp.13–33.<br />
Heckman, J.J. (1979) ‘Sample selection bias as a specification error’, Econometrica, Vol. 47,<br />
pp.153–161.<br />
Heckman, J. J. (1978) ‘Dummy endogenous variables in a simultaneous equation system’,<br />
Econometrica, Vol. 46, No. 6, pp.931–959.<br />
Jeitziner, B. (2004) ‘Wahlen im Internetzeitalter. Informationsvermittler als politische Berater von<br />
Wählern und Politikern’, in Schaltegger, C.A. <strong>and</strong> Schaltegger, S.C. (Eds): Perspektiven der<br />
Wirtschaftspolitik. Festschrift zum 65. Geburtstag von Prof. Dr. René L. Frey, vdf<br />
Hochschulverlag, Zurich, pp.47–64.
384 A. Ladner, J. Fivaz <strong>and</strong> J. Pianzola<br />
Klein, M. (2006) ‘Jenseits von Distanz und Richtung. Die Verbundmessung von Politikpräferenzen<br />
im Vergleich mit dem Distanz- und Richtungsmodell des Wählens – empirische Befunde<br />
eines Methodenexperiments’, Politische Vierteljahresschrift, Vol. 47, No. 4, pp.595–617.<br />
Kleinnijenhuis, J., Scholten, O., van Atteveldt, W., van Hoof, A., Krouwel, A., Oegema, D., de<br />
Ridder, J. A., Ruigrok, N. <strong>and</strong> Takens, J. (2007) Nederl<strong>and</strong> vijfstromenl<strong>and</strong>. De rol van de<br />
media en stemwijzers bij de verkiezingen van 2006, Uitgeverij Bert Bakker, Amsterdam.<br />
Kriesi, H. <strong>and</strong> Sciarini, P. (2003) ‘Auswirkungen von Sachpräferenzen auf die Wahlentscheidung’,<br />
in Sciarini, P., Hardmeier, S. <strong>and</strong> Vatter, A. (Eds): Schweizer Wahlen 1999, Haupt, Bern,<br />
pp.321–328.<br />
Ladner, A., Felder, G. <strong>and</strong> Fivaz, J. (2010) ‘More than Toys? A First Assessment of <strong>Voting</strong> Advice<br />
Applications in Switzerl<strong>and</strong>’, in Cedroni L. <strong>and</strong> Garcia D. (Eds): <strong>Voting</strong> Advice Applications<br />
in Europe. The State of the Art, ScriptaWeb, Naples, pp.91–123.<br />
Ladner, A., Fivaz, J. <strong>and</strong> Pianzola, J. (2010b) ‘Impact of <strong>Voting</strong> Advice Applications on Voters’<br />
Decision-Making’, Paper Presented at the Conference Internet, Politics, Policy 2010: An<br />
Impact Assessment, 16–17 September, Oxford, UK.<br />
Ladner, A., Schwarz, D. <strong>and</strong> Fivaz, J. (2008) Die Positionierung der Nationalratsk<strong>and</strong>idierenden<br />
2007. Eine explorative Analyse der Antworten auf die Fragen der Online-Wahlhilfe smartvote,<br />
IDHEAP, Chavannes-Lausanne.<br />
Long, S. <strong>and</strong> Freese, J. (2006) Regression Models for Categorical Dependent Variables Using<br />
Stata, Stata Press, College Station, Texas.<br />
Louwerse, T. <strong>and</strong> Rosema, M. (2011) ‘The Design Effect of <strong>Voting</strong> Advice Applications:<br />
Comparing Methods of Calculating Results’, Paper Presented at the 6th European Consortium<br />
for Political Research (ECPR) General Conference, 25–27 August 2011, Reykjavik, Icel<strong>and</strong>.<br />
Marschall, S. <strong>and</strong> Schmidt, C.K. (2010) ‘The impact of voting indicators: the case of the German<br />
Wahl-O-Mat’, in Cedroni, L. <strong>and</strong> Garzia D. (Eds): <strong>Voting</strong> Advice Applications in Europe.<br />
The State of the Art, ScriptaWeb, Naples, pp.61–86.<br />
Marschall, St. (2005) ‘Idee und Wirkung des Wahl-O-Mat’, Aus Politik und Zeitgeschichte,<br />
Vol. 51, pp.41–46.<br />
Mykkänen, J. <strong>and</strong> Moring T. (2006) ‘Dealigned Politics Comes of Age? The Effects of Online<br />
C<strong>and</strong>idate Selectors on Finnish Voters’, Paper Presented at the Conference of Politics on the<br />
Internet: New Forms of Media for Political Action, 24–25 November, Tampere, Finl<strong>and</strong>.<br />
Niemi, R.G. <strong>and</strong> Weisberg, H.F. (Eds) (2001) Controversies in <strong>Voting</strong> Behavior, CQ Press,<br />
Washington, D.C.<br />
Norton, E.C., Wang, H. <strong>and</strong> Chunrong, A. (2004) ‘Computing Interaction Effects <strong>and</strong> St<strong>and</strong>ard<br />
Errors in Logit <strong>and</strong> Probit Models’, The Stata Journal, Vol. 4, No. 2, pp.154–167.<br />
Powell, G.B. Jr. (2000) Elections as Instruments of Democracy. Majoritarian <strong>and</strong> Proportional<br />
Visions, Yale University Press, New Haven/CT.<br />
Rabinowitz, G. <strong>and</strong> Macdonald, S.E. (1989) ‘A directional theory of issue voting’, American<br />
Political Science Review, Vol. 83, No. 1, pp.93–121.<br />
Ruusuvirta, O. <strong>and</strong> Rosema, M. (2009) ‘Do Online Vote Selectors Influence Electoral Participation<br />
<strong>and</strong> the Direction of the Vote?’, Paper Presented at the 5 th European Consortium for Political<br />
Research (ECPR) General Conference,10–12 September 2009, Potsdam, Germany.<br />
Sartori, G. (1968) ‘Political Development <strong>and</strong> Political Engineering’, in Montgomery, J.D. <strong>and</strong><br />
Hirschmann, A.O. (Eds): Public Policy, Harvard University Press, Cambridge, MA.<br />
Schoen, H. <strong>and</strong> Weiss, C. (2005) ‘Der sozialpsychologische Ansatz zur Erklärung von<br />
Wahlverhalten’, in Falter, J.W. <strong>and</strong> Schoen, H. (Eds): H<strong>and</strong>buch Wahlforschung, VS Verlag<br />
für Sozialwissenschaften Wiesbaden, pp.187–242.<br />
Walgrave, S., van Aelst, P. <strong>and</strong> Nuytemans, M. (2008) ‘Do the Vote Test: The Electoral Effects of<br />
a Popular Vote Advice Application at the 2004 Belgian Elections’, Acta Politica, Vol. 43,<br />
pp.50–70.
<strong>Voting</strong> <strong>advice</strong> <strong>applications</strong> <strong>and</strong> <strong>party</strong> <strong>choice</strong> 385<br />
Wall, M., Sudulich, M. L., Costello, R. <strong>and</strong> Enrique Leon, E. (2009) ‘Picking Your Party Online –<br />
An Investigation of Irel<strong>and</strong>’s First Online <strong>Voting</strong> Advice Application’, Information Polity,<br />
Vol. 14, pp.203–218.<br />
Van der Eijk, C., van der Brug, W., Kroh, M. <strong>and</strong> Franklin, M. (2006) ‘Rethinking the Dependent<br />
Variable in <strong>Voting</strong> Behavior: On the Measurement <strong>and</strong> Analysis of Electoral Utilities’,<br />
Electoral Studies, Vol. 25, No. 3, pp.424–447.<br />
Van der Eijk, C. <strong>and</strong> Franklin, M. (2009) Elections <strong>and</strong> Voters, Palgrave McMillan, Basingstoke.<br />
Notes<br />
1 For more details about the project, see http://www.nccr-democracy.uzh.ch.<br />
2 The parties’ positioning within the political space was carried out on the basis of the parties’<br />
answers to the VAAs questionnaire. The analysis used a two-dimensional political space<br />
with the left-right axis <strong>and</strong> a liberal-conservative axis (for details, see Ladner et al., 2008,<br />
pp.29–35).
386 A. Ladner, J. Fivaz <strong>and</strong> J. Pianzola<br />
Appendix A<br />
Full logit model for predictions for <strong>party</strong> change<br />
Independent variables<br />
Influenced by voting recommendation<br />
Age<br />
Age*influenced by voting recommendation<br />
Rather not surprised by voting recommendation<br />
Rather surprised by voting recommendation<br />
Very surprised by voting recommendation<br />
Multiple vote propensities<br />
Party attachment<br />
Ideology (centre vs. left/right)<br />
Gender<br />
Educational level<br />
Income level<br />
District size 2<br />
District size 3<br />
District size 4<br />
District size 5<br />
District size 6<br />
District size 7<br />
Vote change<br />
0.60*<br />
(0.31)<br />
–0.01***<br />
(0.00)<br />
–0.006<br />
(0.007)<br />
0.12<br />
(0.11)<br />
0.18<br />
(0.14)<br />
0.69***<br />
(0.28)<br />
0.30***<br />
(0.11)<br />
–0.44***<br />
(0.09)<br />
0.36***<br />
(0.09)<br />
–0.11<br />
(0.10)<br />
0.00<br />
(0.06)<br />
–0.02<br />
(0.03)<br />
0.27<br />
(0.86)<br />
–0.42<br />
(0.83)<br />
–0.41<br />
(0.86)<br />
–0.31<br />
(0.76)<br />
–0.21<br />
(0.80)<br />
–0.18<br />
(0.75)
<strong>Voting</strong> <strong>advice</strong> <strong>applications</strong> <strong>and</strong> <strong>party</strong> <strong>choice</strong> 387<br />
Appendix A<br />
Full logit model for predictions for <strong>party</strong> change (continued)<br />
District size 8<br />
District size 9<br />
District size 10<br />
District size 11<br />
District size 12<br />
District size 13<br />
District size 14<br />
District size 15<br />
Independent variables<br />
Vote change<br />
–0.17<br />
(0.82)<br />
–0.25<br />
(0.78)<br />
0.23<br />
(0.78)<br />
0.32<br />
(0.76)<br />
–0.07<br />
(0.76)<br />
–0.07<br />
(0.75)<br />
–0.09<br />
(0.75)<br />
–0.37<br />
(0.75)<br />
Constant<br />
–0.39<br />
(0.83)<br />
Observations 2551<br />
Loglikelihood –1620<br />
Loglikelihood 0 –1705<br />
AIC 3295<br />
Correctly predicted cases 64%<br />
Notes:<br />
St<strong>and</strong>ard errors in parentheses; *** p