LanTEK® II Series Manual - Ideal Industries Inc.
LanTEK® II Series Manual - Ideal Industries Inc.
LanTEK® II Series Manual - Ideal Industries Inc.

You also want an ePaper? Increase the reach of your titles
YUMPU automatically turns print PDFs into web optimized ePapers that Google loves.
Chapter 5<br />
Autotest<br />
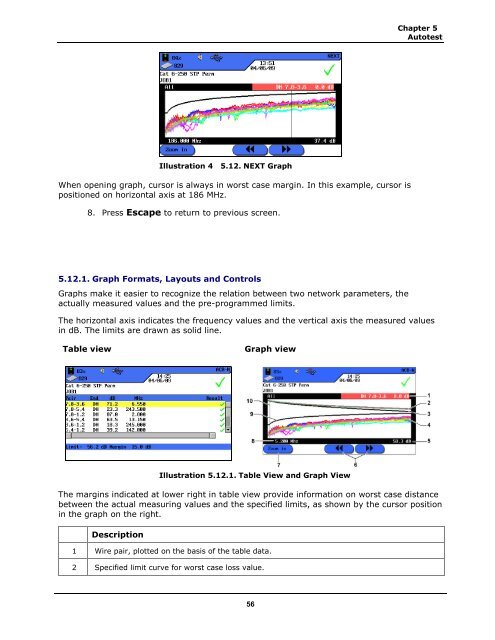
Illustration 4 5.12. NEXT Graph<br />
When opening graph, cursor is always in worst case margin. In this example, cursor is<br />
positioned on horizontal axis at 186 MHz.<br />
8. Press Escape to return to previous screen.<br />
5.12.1. Graph Formats, Layouts and Controls<br />
Graphs make it easier to recognize the relation between two network parameters, the<br />
actually measured values and the pre-programmed limits.<br />
The horizontal axis indicates the frequency values and the vertical axis the measured values<br />
in dB. The limits are drawn as solid line.<br />
Table view<br />
Graph view<br />
Illustration 5.12.1. Table View and Graph View<br />
The margins indicated at lower right in table view provide information on worst case distance<br />
between the actual measuring values and the specified limits, as shown by the cursor position<br />
in the graph on the right.<br />
Description<br />
1 Wire pair, plotted on the basis of the table data.<br />
2 Specified limit curve for worst case loss value.<br />
56