The Digital Opportunity Index (DOI) - ITU
The Digital Opportunity Index (DOI) - ITU The Digital Opportunity Index (DOI) - ITU
Figure 3.1d: How Digital Opportunity relates to national economic performance The chart shows the relationship between DOI and national wealth, as indicated by GDP per capita, using a logarithmic scale. 1.0 0.8 0.6 Estonia Lithuania Bulgaria Chile Korea (Rep.) Taiwan, China Singapore Japan Denmark Qatar Digital Opportunity Index 0.4 Jamaica Kuwait Morocco Oman Senegal 0.2 Rwanda Timor-Leste Burundi Vietnam Cuba Pakistan Equatorial Guinea Vanuatu 0.0 Niger Chad 2.5 3 3.5 4 4.5 5 $100 $1,000 $10,000 $100,00 0 Log Gross Log National GDP per Income capita (logarithmic scale) Note: Economies shown above the line have a higher DOI score than would be predicted by their GDP per capita. Economies below the line have a lower DOI score than would be predicted by their GDP per capita. Source: ITU/UNCTAD/KADO Digital Opportunity Platform. World Information Society Report 2007 39
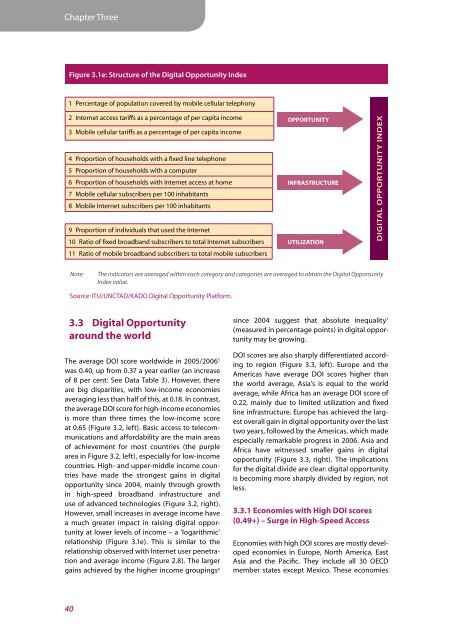
Statistical Chapter Three Annex Figure 3.1e: Structure of the Digital Opportunity Index 1 Percentage of population covered by mobile cellular telephony 2 Internet access tariffs as a percentage of per capita income 3 Mobile cellular tariffs as a percentage of per capita income 4 Proportion of households with a fixed line telephone 5 Proportion of households with a computer 6 Proportion of households with Internet access at home 7 Mobile cellular subscribers per 100 inhabitants 8 Mobile Internet subscribers per 100 inhabitants 9 Proportion of individuals that used the Internet 10 Ratio of fixed broadband subscribers to total Internet subscribers 11 Ratio of mobile broadband subscribers to total mobile subscribers OPPORTUNITY INFRASTRUCTURE UTILIZATION DIGITAL OPPORTUNITY INDEX Note: The indicators are averaged within each category and categories are averaged to obtain the Digital Opportunity Index value. Source: ITU/UNCTAD/KADO Digital Opportunity Platform. 3.3 Digital Opportunity around the world The average DOI score worldwide in 2005/2006 5 was 0.40, up from 0.37 a year earlier (an increase of 8 per cent: See Data Table 3). However, there are big disparities, with low-income economies averaging less than half of this, at 0.18. In contrast, the average DOI score for high-income economies is more than three times the low-income score at 0.65 (Figure 3.2, left). Basic access to telecommunications and affordability are the main areas of achievement for most countries (the purple area in Figure 3.2, left), especially for low-income countries. High- and upper-middle income countries have made the strongest gains in digital opportunity since 2004, mainly through growth in high-speed broadband infrastructure and use of advanced technologies (Figure 3.2, right). However, small increases in average income have a much greater impact in raising digital opportunity at lower levels of income – a ‘logarithmic’ relationship (Figure 3.1e). This is similar to the relationship observed with Internet user penetration and average income (Figure 2.8). The larger gains achieved by the higher income groupings 6 since 2004 suggest that absolute inequality 7 (measured in percentage points) in digital opportunity may be growing. DOI scores are also sharply differentiated according to region (Figure 3.3, left). Europe and the Americas have average DOI scores higher than the world average, Asia’s is equal to the world average, while Africa has an average DOI score of 0.22, mainly due to limited utilization and fixed line infrastructure. Europe has achieved the largest overall gain in digital opportunity over the last two years, followed by the Americas, which made especially remarkable progress in 2006. Asia and Africa have witnessed smaller gains in digital opportunity (Figure 3.3, right). The implications for the digital divide are clear: digital opportunity is becoming more sharply divided by region, not less. 3.3.1 Economies with High DOI scores (0.49+) – Surge in High-Speed Access Economies with high DOI scores are mostly developed economies in Europe, North America, East Asia and the Pacific. They include all 30 OECD member states except Mexico. These economies 40
- Page 1 and 2: Statistical Chapter Three Annex cha
- Page 3 and 4: Statistical Chapter Three Annex Fig
- Page 5: Statistical Chapter Three Annex Fig
- Page 9 and 10: Statistical Chapter Three Annex Fig
- Page 11 and 12: Statistical Chapter Three Annex For
- Page 13 and 14: Statistical Chapter Three Annex 3.4
- Page 15 and 16: Statistical Chapter Three Annex ers
- Page 17 and 18: Statistical Chapter Three Annex Fig
- Page 19 and 20: Statistical Chapter Three Annex Som
- Page 21 and 22: Statistical Chapter Three Annex 9 N
Statistical Chapter Three Annex<br />
Figure 3.1e: Structure of the <strong>Digital</strong> <strong>Opportunity</strong> <strong>Index</strong><br />
1 Percentage of population covered by mobile cellular telephony<br />
2 Internet access tariffs as a percentage of per capita income<br />
3 Mobile cellular tariffs as a percentage of per capita income<br />
4 Proportion of households with a fixed line telephone<br />
5 Proportion of households with a computer<br />
6 Proportion of households with Internet access at home<br />
7 Mobile cellular subscribers per 100 inhabitants<br />
8 Mobile Internet subscribers per 100 inhabitants<br />
9 Proportion of individuals that used the Internet<br />
10 Ratio of fixed broadband subscribers to total Internet subscribers<br />
11 Ratio of mobile broadband subscribers to total mobile subscribers<br />
OPPORTUNITY<br />
INFRASTRUCTURE<br />
UTILIZATION<br />
DIGITAL OPPORTUNITY INDEX<br />
Note:<br />
<strong>The</strong> indicators are averaged within each category and categories are averaged to obtain the <strong>Digital</strong> <strong>Opportunity</strong><br />
<strong>Index</strong> value.<br />
Source: <strong>ITU</strong>/UNCTAD/KADO <strong>Digital</strong> <strong>Opportunity</strong> Platform.<br />
3.3 <strong>Digital</strong> <strong>Opportunity</strong><br />
around the world<br />
<strong>The</strong> average <strong>DOI</strong> score worldwide in 2005/2006 5<br />
was 0.40, up from 0.37 a year earlier (an increase<br />
of 8 per cent: See Data Table 3). However, there<br />
are big disparities, with low-income economies<br />
averaging less than half of this, at 0.18. In contrast,<br />
the average <strong>DOI</strong> score for high-income economies<br />
is more than three times the low-income score<br />
at 0.65 (Figure 3.2, left). Basic access to telecommunications<br />
and affordability are the main areas<br />
of achievement for most countries (the purple<br />
area in Figure 3.2, left), especially for low-income<br />
countries. High- and upper-middle income countries<br />
have made the strongest gains in digital<br />
opportunity since 2004, mainly through growth<br />
in high-speed broadband infrastructure and<br />
use of advanced technologies (Figure 3.2, right).<br />
However, small increases in average income have<br />
a much greater impact in raising digital opportunity<br />
at lower levels of income – a ‘logarithmic’<br />
relationship (Figure 3.1e). This is similar to the<br />
relationship observed with Internet user penetration<br />
and average income (Figure 2.8). <strong>The</strong> larger<br />
gains achieved by the higher income groupings 6<br />
since 2004 suggest that absolute inequality 7<br />
(measured in percentage points) in digital opportunity<br />
may be growing.<br />
<strong>DOI</strong> scores are also sharply differentiated according<br />
to region (Figure 3.3, left). Europe and the<br />
Americas have average <strong>DOI</strong> scores higher than<br />
the world average, Asia’s is equal to the world<br />
average, while Africa has an average <strong>DOI</strong> score of<br />
0.22, mainly due to limited utilization and fixed<br />
line infrastructure. Europe has achieved the largest<br />
overall gain in digital opportunity over the last<br />
two years, followed by the Americas, which made<br />
especially remarkable progress in 2006. Asia and<br />
Africa have witnessed smaller gains in digital<br />
opportunity (Figure 3.3, right). <strong>The</strong> implications<br />
for the digital divide are clear: digital opportunity<br />
is becoming more sharply divided by region, not<br />
less.<br />
3.3.1 Economies with High <strong>DOI</strong> scores<br />
(0.49+) – Surge in High-Speed Access<br />
Economies with high <strong>DOI</strong> scores are mostly developed<br />
economies in Europe, North America, East<br />
Asia and the Pacific. <strong>The</strong>y include all 30 OECD<br />
member states except Mexico. <strong>The</strong>se economies<br />
40


