PROTECTION OF THE PUBLIC IN SITUATIONS OF ... - ICRP
PROTECTION OF THE PUBLIC IN SITUATIONS OF ... - ICRP
PROTECTION OF THE PUBLIC IN SITUATIONS OF ... - ICRP

Create successful ePaper yourself
Turn your PDF publications into a flip-book with our unique Google optimized e-Paper software.
42/106/05<br />
April 5, 2005 (version 18.1)<br />
DRAFT FOR CONSULTATION (WEB VERSION)<br />
<strong>IN</strong>TERNATIONAL COMMISSION ON RADIOLOGICAL <strong>PROTECTION</strong><br />
ASSESS<strong>IN</strong>G DOSE <strong>OF</strong> <strong>THE</strong> REPRESENTATIVE <strong>IN</strong>DIVIDUAL<br />
FOR <strong>THE</strong> PURPOSE <strong>OF</strong> RADIATION <strong>PROTECTION</strong> <strong>OF</strong> <strong>THE</strong><br />
<strong>PUBLIC</strong><br />
TASK GROUP MEMBERS<br />
JOHN E. TILL, CHAIRMAN<br />
DAVID CANCIO<br />
JOHN R. COOPER<br />
TOSHISO KOSAKO<br />
ANDREW C. MCEWAN<br />
CISKA ZUUR<br />
CORRESPOND<strong>IN</strong>G MEMBERS<br />
MARY E. CLARK<br />
DONALD A. COOL<br />
KAARE ULBAK
CONTENTS<br />
PREFACE.................................................................................................................................iv<br />
ABSTRACT...............................................................................................................................v<br />
EXECUTIVE SUMMARY .....................................................................................................vii<br />
1. <strong>IN</strong>TRODUCTION .............................................................................................................1<br />
1.1. Objective............................................................................................................1<br />
1.2. Background........................................................................................................3<br />
1.3. Fundamental principles and concepts ................................................................5<br />
2. ASSESSMENT <strong>OF</strong> DOSE ................................................................................................6<br />
2.1. Purpose of dose assessment ...............................................................................6<br />
2.2. Types of dose assessment ..................................................................................6<br />
2.3. Overview of the dose assessment process .........................................................8<br />
2.4. Treatment of uncertainties in dose assessment ................................................10<br />
2.5. Deterministic and probabilistic methods for dose assessment.........................10<br />
3. <strong>THE</strong> REPRESENTATIVE <strong>IN</strong>DIVIDUAL......................................................................12<br />
3.1. Definition of the representative individual ......................................................12<br />
3.2. Pathways of exposure, time frames, and spatial distribution of radionuclides 12<br />
3.3. Characteristics of the representative individual...............................................13<br />
3.4. Age-specific dose coefficients .........................................................................15<br />
3.5. Determining compliance..................................................................................17<br />
4. O<strong>THE</strong>R CONSIDERATIONS RELEVANT TO <strong>THE</strong> REPRESENTATIVE<br />
<strong>IN</strong>DIVIDUAL..........................................................................................................................20<br />
4.1. Relationship between environmental monitoring, modelling, and the<br />
representative individual.....................................................................................................20<br />
4.2. Situations of potential exposure.......................................................................20<br />
4.3. Value of stakeholder input to characterising the representative individual.....21<br />
5. REFERENCES ................................................................................................................23<br />
APPENDIX A. ANALYSIS <strong>OF</strong> AGE CATEGORIES FOR USE <strong>IN</strong> ASSESSMENT <strong>OF</strong><br />
DOSE TO <strong>THE</strong> <strong>PUBLIC</strong>.......................................................................................................A-1<br />
A.1.<br />
A.2.<br />
A.3.<br />
A.4.<br />
A.5.<br />
A.6.<br />
Introduction....................................................................................................A-1<br />
Background....................................................................................................A-1<br />
Method ...........................................................................................................A-2<br />
Results............................................................................................................A-2<br />
Conclusions....................................................................................................A-3<br />
References......................................................................................................A-4<br />
APPENDIX B. DETERM<strong>IN</strong><strong>IN</strong>G COMPLIANCE WHEN DOSE TO <strong>THE</strong> <strong>PUBLIC</strong> IS<br />
ESTIMATED PROBABILISTICALLY ...............................................................................B-1<br />
B.1. Introduction....................................................................................................B-1<br />
B.2. Retrospective and prospective dose for specific and hypothetical individuals ...<br />
........................................................................................................................B-1<br />
B.3. Distributions related to dose ..........................................................................B-3
B.4.<br />
B.5.<br />
B.6.<br />
B.7.<br />
B.8.<br />
B.9.<br />
Specific forms of dose distributions ..............................................................B-6<br />
Normal distribution and central limit theorem ..............................................B-7<br />
Occurrence of lognormal distribution............................................................B-7<br />
Examples......................................................................................................B-11<br />
Conclusions..................................................................................................B-15<br />
References....................................................................................................B-18
PREFACE<br />
On October 20, 2001 the Main Commission of the International Commission on<br />
Radiological Protection (<strong>ICRP</strong>) approved the formation of a new Task Group, reporting to<br />
Committee 4, on the Definition of the Individual. As stated in the terms of reference, the<br />
objective of the Task Group was to develop principles that assist in defining the individual to<br />
be used for determining exposures in the <strong>ICRP</strong> system of protection. These principles were<br />
expected to be important as the Commission's draft 2005 Recommendations evolved because<br />
they give more emphasis to the individual rather than to society as a whole. Examples of<br />
areas to be covered by the Task Group included how the individual is defined in the context<br />
of exposure in prospective and retrospective situations, as well as in avoidable and<br />
unavoidable situations. Demonstration of compliance was also to be addressed. Issues related<br />
to the critical group and concepts of uncertainty as related to the individual were to be<br />
considered. It was anticipated that the document produced as a result of the Task Group's<br />
work would form one of the supporting documents for the 2005 Recommendations.<br />
This report is the outcome of the Task Group’s efforts. It addresses the areas<br />
mentioned above and also several other issues that became evident during the course of the<br />
Task Group’s work. The guidance in this report builds upon the concept of the critical group<br />
previously implemented by <strong>ICRP</strong> and defines the representative individual to be used for<br />
determining compliance with the dose constraint.<br />
The membership of the Task Group was as follows:<br />
John E. Till (Chairman), United States<br />
David Cancio, Spain<br />
John R. Cooper, United Kingdom<br />
Toshiso Kosako, Japan<br />
Andrew C. McEwan, New Zealand<br />
Ciska Zuur, Netherlands<br />
The following persons served as corresponding members:<br />
Mary E. Clark, United States<br />
Kaare Ulbak, Denmark<br />
Donald A. Cool, United States<br />
The Task Group wishes to acknowledge the technical assistance of ???? at the<br />
National Radiological Protection Board in the United Kingdom for support in making<br />
calculations related to age-specific dose. The Task Group also acknowledges Ms. Shawn<br />
Mohler for her support in developing the graphics in the report, Mr. George Killough for his<br />
support in with the statistical issues presented in Appendix B, and Ms. Cindy Galvin for her<br />
support with the editing of the report.<br />
The Task Group would like to thank those organizations and staff that made facilities<br />
and support available for its meetings. These include the National Institute of Radiation<br />
Hygiene in Denmark; the Ministry of Housing, Spatial Planning, and Environment in The<br />
Netherlands; the National Radiological Protection Board in the United Kingdom; the<br />
Research Centre for Engineering, Environment, and Technology (CIEMAT) in Spain; the<br />
Nuclear Energy Agency in France; and the Department of Energy, the Nuclear Regulatory<br />
Commission, and the Centers for Disease Control and Prevention in the United States of<br />
America.<br />
The report was adopted by the Main Commission at its meeting in (????????) on (?????),<br />
2005.<br />
iv
ABSTRACT<br />
Abstract— The Commission concluded that its 2005 Recommendations should be based on<br />
a simple, but widely applicable, general system of protection that would clarify its objectives<br />
and would provide a basis for the more formal systems needed by operating managers and<br />
regulators. The recommendations would establish quantified limits and constraints on<br />
individual dose from specified sources. The dose constraint provided in the recommendations<br />
applies to actual or representative individuals who encounter occupational, medical, and<br />
public exposures. Recommendations in this report update and revise the previous guidance<br />
for estimating dose to the public. Doses to the public cannot be measured directly. Therefore,<br />
for the purpose of protection of the public, it is necessary to characterise an individual, either<br />
hypothetical or specific, whose dose can be used for determining compliance with the dose<br />
constraint. This individual is defined as the representative individual. If the dose constraint<br />
for this individual is met, then the Commission’s goal of protecting the public is considered<br />
to be achieved.<br />
The report explains the process of estimating annual dose and recognises that a<br />
number of different methods are available for estimating dose to the representative<br />
individual. These methods range from simple deterministic calculations to more complex<br />
Monte Carlo techniques. In addition, a mixture of these may be applied. In selecting<br />
characteristics for the representative individual, three important concepts must be borne in<br />
mind: reasonableness, sustainability, and homogeneity. Each concept is explained and<br />
examples are provided to illustrate its role in defining characteristics of the representative<br />
individual. It is important to distinguish between doses to the public that are either<br />
prospective (may occur in the future), or retrospective (occurred in the past). Prospective<br />
doses are for hypothetical individuals who may or may not exist in the future while<br />
retrospective doses are to specific (real) individuals.<br />
The Commission recognises that the level of detail afforded by its recommendations<br />
of dose coefficients for seven age categories are not necessary in making prospective<br />
assessments of dose for hypothetical individuals, given the inherently large uncertainties<br />
associated with estimating dose to the public and identification of the representative<br />
individual. Therefore, the Commission now recommends the use of three age categories for<br />
estimating annual dose to the representative individual in prospective assessments. These<br />
categories are 0 to
The Commission recognises the role that stakeholders can play in identifying<br />
characteristics of the representative individual. Collaboration with stakeholders can<br />
significantly improve the quality, understanding, and acceptability of the characteristics of<br />
the representative individual and the resulting estimated dose.<br />
vi
EXECUTIVE SUMMARY<br />
(S1) On October 20, 2001 the Main Commission of the International Commission on<br />
Radiological Protection approved the formation of a new Task Group on the Definition of the<br />
Individual. The objective of the Task Group was to develop principles that assist in defining<br />
the individual whose dose is to be used as the basis for determining compliance with the dose<br />
constraint for the public in the draft 2005 Recommendations.<br />
(S2) In practices and existing situations, the dose constraint for the public is specified as an<br />
annual dose for regulatory and administrative purposes. This dose does not include exposure<br />
received from medicine or occupational sources. In setting it’s the dose constraint for the<br />
public, the Commission recognises the inherent variability in estimated annual effective dose<br />
to members of the public and the transient nature of many extreme exposure situations. As a<br />
result, the Commission believes there should be a small probability that some individual may<br />
exceed the dose constraint.<br />
(S3) The Commission’s constraint for the public is set, in part, on the basis of exposure<br />
situations for individuals that are assumed to continue to occur for a number of years into the<br />
future. Since the population being exposed at any given time is made up of a spectrum of<br />
individuals composed of a range of ages, the same individual will progress in age over the<br />
time that exposures are expected to occur.<br />
(S4) The Commission recognises three types of exposure situations: practices, existing<br />
situations, and emergency situations. Furthermore, dose assessments may be prospective or<br />
retrospective. Prospective doses are for hypothetical individuals who may receive the dose in<br />
the future. Retrospective doses are for doses that have occurred in the past and are for<br />
specific (real) individuals.<br />
(S5) Dose assessment can be thought of as a multi-stage process. The first stage is to<br />
obtain information about the source, including data on the types and quantities of<br />
radionuclides and radiations emitted. The second stage is to obtain information about the<br />
environment, specifically the concentrations of radionuclides in environmental media arising<br />
from the source in question. The third stage of the process is to combine concentrations with<br />
habit data that are defined by an exposure scenario. The fourth stage is to use coefficients that<br />
either relate concentrations in air or soil to external dose rates (external doses), or that<br />
convert a unit of intake into dose (internal doses). Dose coefficients are estimated using<br />
models of radionuclide behaviour and radiation absorption in the body and have been derived<br />
and published by <strong>ICRP</strong>. The final stage is to sum the contributions from external and internal<br />
dose as appropriate. As an aid to clarification, and for intakes of radionuclides in particular, it<br />
is useful to consider the stages separately.<br />
(S6) It is recognised that uncertainties are inherent in any process of defining individual<br />
characteristics and in estimating doses. Whether doses are estimated using measurement data,<br />
by applying models, or through a combination of measurements and calculations, the<br />
uncertainty for a given annual dose estimate is represented by a distribution of possible<br />
values. Uncertainty in dose assessment is a result of the inherent variability of some of the<br />
processes involved or a lack of knowledge about specific data that are needed for evaluating<br />
the process.<br />
vii
(S7) The Commission draws a distinction between quantities having values that are<br />
measured or estimated and quantities that have values that are selected, either by the<br />
Commission or by other organizations. For example, dose constraints, weighting factors, and<br />
dose coefficients—when used in the process of assessing compliance and in decision<br />
making—are assumed not to be uncertain. They are assumed to be point values. The<br />
Commission recognises uncertainties in the models linking detriment to dose. These<br />
uncertainties are considered in establishing selected values of quantities, such as limits and<br />
constraints. The Commission believes that the regulatory authority should make the final<br />
decision on how to include uncertainties in the estimation of dose for compliance purposes.<br />
(S8) The Commission recognises that the level of detail afforded by its recommendations<br />
of dose coefficients for seven age categories are not necessary with the large uncertainties<br />
associated with estimating dose to the public and identification of the representative<br />
individual. Therefore, for the purpose of prospective assessments of continuing exposure, the<br />
Commission now recommends that three age categories are sufficient for estimating annual<br />
dose to the representative individual in prospective assessments. These categories are 0 to
(S12) If specific habit data for a local population are not available, values may be derived<br />
from national or regional population data. A distribution of these data may be used in<br />
probabilistic assessments, or a value on the distribution may be selected for deterministic<br />
calculations. Established databases suggest that the 95 th percentile of consumption rates for<br />
many staple foods tend to exceed the mean values by approximately a factor of 3. Therefore,<br />
using the 95 th percentile of behaviour may be considered to represent a cautious, but<br />
acceptable assumption, for defining a reasonable and sustainable intake rate using the<br />
deterministic approach. However, care must be exercised to avoid selecting extreme<br />
percentile values for every variable, in order to avoid excessive conservatism in the<br />
assessment. Taken together, the selection of parameter values must represent a reasonable<br />
and sustainable exposure scenario.<br />
(S13) Dose to the representative individual may be calculated using several different<br />
approaches that range from simple deterministic to probabilistic (Monte Carlo) methods.<br />
(S14) Deterministic methods involve the direct multiplication of selected point values of<br />
parameters and environmental concentrations. The simplest form of deterministic method is<br />
screening, where very conservative assumptions are made to estimate dose using<br />
concentrations of radionuclides at the point of discharge to the environment. In another form<br />
of the deterministic method, a general assessment of the involved populations, pathways, and<br />
radionuclides is made. This could be done by simplified screening methods or by expert<br />
opinion. In some situations, people receiving the highest dose are easily identified because<br />
site-specific exposure data are readily available and habit information is known. In other<br />
situations, identifying these individuals is an iterative process that considers key pathways of<br />
exposure and populations receiving doses from the source. The iterative process will usually<br />
indicate the areas that are likely to receive the greatest exposure from each pathway. It<br />
addresses the transport of radionuclides in the environment and accounts for the ultimate<br />
spatial and temporal disposition of the materials and the exposure of the population. The<br />
greater exposure areas should be investigated in more detail. Ultimately, a group is identified<br />
that is expected to receive the highest exposure. The average characteristics of this group are<br />
used to estimate dose to the representative individual.<br />
(S15) It is now possible to use probabilistic methods to estimate dose. Probabilistic methods<br />
combine distributions of parameters into a composite distribution that present a range of<br />
possible doses based on their probability of occurrence. The distribution of dose incorporates<br />
(1) the uncertainty and natural variability in the estimated environmental media concentration<br />
(i.e., radionuclide concentration in air, water, soil, and food) and (2) uncertainty in the habit<br />
data (i.e., breathing rate, food and water ingestion rates, time spent at various activities).<br />
(S16) For some prospective probabilistic assessments of dose, it is possible that essentially<br />
all doses on the distribution will be predicted to be less than the dose constraint set by <strong>ICRP</strong>.<br />
In this case, compliance is readily met. In a prospective probabilistic assessment of dose to<br />
hypothetical individuals, whether from a planned facility or an existing situation, the<br />
Commission recommends that the representative individual be identified such that the<br />
probability is less than about 5% that a person drawn at random from the hypothetical<br />
population will receive an annual effective dose exceeding the dose constraint. This<br />
hypothetical individual should be representative of, at most, a few tens of people who are the<br />
most highly exposed. If this dose to the representative individual is below the dose constraint<br />
ix
set by the Commission, then the design and planned operations are determined to be in<br />
compliance.<br />
(S17) In probabilistic assessments, particular attention must be given to the region and<br />
accompanying population where the assessment is being conducted to define the<br />
representative individual. Care must be used to include all hypothetical individuals whose<br />
dose could possibly be representative of persons receiving the highest dose, including<br />
extremes.<br />
(S18) For retrospective assessments of dose to specific individuals, either for the purpose of<br />
determining compliance for a past period of operation of a practice or an existing situation,<br />
the Commission recognises that estimated doses above the dose constraint must be evaluated<br />
on a case by case basis. In most cases it may be expected that the extremes represented by<br />
these individuals will continue for only a short time or may actually never be realised.<br />
However, if doses to specific individuals exceeded the dose constraint and these doses are<br />
expected to continue for a protracted period of time, a decision must be made by the operator<br />
and the regulator whether a reduction in the source is required or whether changes in habits<br />
of the individuals exposed might be proposed and supported. Such a situation might warrant<br />
additional monitoring to reduce uncertainty in the dose estimate or verify the magnitude of<br />
dose. The above considerations should be separate from any decision regarding whether the<br />
previous design or operations were in compliance with their basis of authorisation.<br />
(S19) The Commission recognises the role that the public can play in helping to identify and<br />
characterise the representative individual for radiological protection purposes. The extent of<br />
stakeholder involvement will vary between countries and situations. Stakeholders can<br />
provide input regarding habit data that are specific to their location. In particular,<br />
stakeholders can be helpful in determining reasonableness, sustainability, and homogeneity<br />
of data. Collaboration with stakeholders can significantly improve the quality, defensibility,<br />
and acceptability of characteristics of the representative individual and also strengthen<br />
support from stakeholders in the compliance and decision-making process.<br />
(S20) Regardless of the approach taken to determine compliance, the Commission stresses<br />
that application of the total system of protection, utilising both compliance with quantitative<br />
constraints and optimisation of protection, is necessary for radiological protection.<br />
x
1. <strong>IN</strong>TRODUCTION<br />
(1) The Commission’s system of protection is based upon the principles of quantitative<br />
standards of protection, complemented by the requirement to optimise the level of protection<br />
achieved. The system is intended to provide an appropriate degree of protection for<br />
individuals from the risks associated with exposure to ionising radiation.<br />
(2) The Commission concluded that its 2005 Recommendations (<strong>ICRP</strong>, 2005a) should be<br />
based on a simple, but widely applicable, general system of protection that would clarify its<br />
objectives and provide a basis for the more formal systems needed by operating managers<br />
and regulators. The recommendations establish quantified limits and constraints on an<br />
individual’s annual dose from specified sources. These restrictions are applied to the<br />
exposure of actual or representative individuals. Within this scope, the Commission includes<br />
numerical restrictions on the exposure of members of the public.<br />
(3) The Commission has previously used the concept of the critical group for defining<br />
those persons who receive the highest exposures from a particular source or set of sources of<br />
radiation for the purposes of applying its recommendations. The recommendations in this<br />
report update and revise the previous guidance for estimating annual dose to the public.<br />
Although emphasis in this report is on the prospective exposure situation (that is dose to the<br />
public in the future), some guidance is also provided on retrospective dose (that is dose that<br />
has already been received).<br />
(4) The dose 1 from a source received by any particular individual depends upon a number<br />
of factors, such as time, location, transport of radionuclides through the environment, and the<br />
characteristics of the individual. These characteristics include physiological parameters (e.g.,<br />
breathing rate), dietary information (e.g., consumption rate of various foods), residence data<br />
(e.g., type of dwelling), use of local resources (e.g., agricultural resources), recreational<br />
activities (e.g., swimming), and any other individual-specific information that is necessary to<br />
estimate annual dose. In the assessment on doses, a specific set of these characteristics is<br />
referred to as an exposure scenario. In general, the Commission refers to diet, residence, and<br />
other information needed to estimate exposure as habit data.<br />
(5) Section 1 of the report addresses the objective of this report and provides background<br />
information on the historical development of the Commission’s approach to identifying and<br />
using the critical group for the purpose of assessing dose to an exposed population. Section 2<br />
reviews the process for estimating doses to members of the public arising from sources.<br />
Section 3 discusses the selection of characteristics for the representative individual. Section 4<br />
presents other considerations relevant to the representative individuals. Section 5 is a<br />
summary of the recommendations provided in the report.<br />
1.1. Objective<br />
(6) The objective of this report is to provide guidance on how to assess dose to the<br />
individual for the purposes of establishing compliance with the Commission’s<br />
recommendations for the protection of the public. Since radiation dose to individual members<br />
of the public cannot generally be monitored, it is necessary to provide guidance on how these<br />
doses are estimated and how compliance is determined.<br />
1 in this report, "dose" is taken to mean "effective dose"<br />
1
(7) This updated guidance is needed since the <strong>ICRP</strong> system of protection has continued to<br />
evolve and recommendations of the Commission have become a basic element of regulations<br />
in many countries. In addition to this evolution within <strong>ICRP</strong>, the ability to carry out<br />
assessments using more sophisticated computer and software tools has improved significantly<br />
over the past two decades. Doses can now be estimated probabilistically, so that a distribution<br />
of doses can be developed that includes uncertainties rather than a single point estimate of<br />
dose. The objective of this report is to update principles necessary to implement the <strong>ICRP</strong><br />
system of protection so that it is consistent with methods that are being used to estimate doses<br />
to individuals. The report also clarifies and elaborates on methods for estimating dose to the<br />
public in order to compare individual the dose constraint, optimise protection, and aid in the<br />
planning and decision making for emergency situations.<br />
(8) The source and the exposed individual are fundamental elements in each category of<br />
exposure, whether occupational, medical, or public. There must be a clear understanding and<br />
characterisation of the individual for whom the dose is being assessed. For occupational<br />
exposure, which is exposure incurred at work and principally as a result of work,<br />
characterisation of the exposed individuals and the sources is generally straightforward in<br />
that there are records for these individuals and their exposures are monitored or individually<br />
assessed. Likewise, in medical exposure, which is principally the exposure of persons as a<br />
part of their own medical diagnosis or treatment, the source and exposure to individuals is<br />
usually obvious. Occupational and medical exposures, therefore, are not considered further in<br />
this report.<br />
(9) Guidance for the protection of future individuals in the case of disposal of long-lived<br />
radioactive waste is provided in <strong>ICRP</strong> Publication 81 (<strong>ICRP</strong>, 2000a).<br />
(10) Exposure situations are classified in the 2005 Recommendations (<strong>ICRP</strong>, 2005a) in<br />
three broad groups: practices, existing situations, and emergency situations. The<br />
Commission uses practices to address those parts of its scope corresponding to any human<br />
activity deliberately introduced or maintained that causes, or potentially causes, radiation<br />
exposures. Existing situations are those in which sources already exist and may have been<br />
introduced unintentionally, inappropriately, or as a result of past human activities that have<br />
then been abandoned. In many circumstances, existing situations can be controlled only by<br />
action to modify exposure pathways. Emergency situations relate to unintended or<br />
unexpected events that could result in exposures sufficient to warrant consideration of the<br />
introduction of countermeasures. Guidance is provided in Chapter 2 of this report for each of<br />
the three groups of exposure of the public described above.<br />
(11) When protection of the public against expected exposure situations is being assessed<br />
for the future, doses may be estimated either deterministically or probabilistically. In either<br />
case, parameters involved are uncertain and these uncertainties must be addressed. In the<br />
deterministic approach, a single point estimate of dose is generated. Uncertainties are<br />
addressed by selecting parameter values that will reasonably assure that the dose is not<br />
underestimated. In the probabilistic approach, uncertainties are taken into account by<br />
including the range of possible values of each of the parameters and developing a distribution<br />
of doses.<br />
2
(12) For exposure determination in an existing situation it may be possible to use<br />
measurement data and other habit data that are specific to the location. These site-specific<br />
data may significantly reduce the uncertainties in estimated doses. However, it is also likely<br />
that in the case of retrospective dose assessment for public exposure a distribution of possible<br />
doses will result due to the inherent variability of measurement and habit data.<br />
1.2. Background<br />
(13) The concept of critical group was first introduced by <strong>ICRP</strong> in Publication 7 (<strong>ICRP</strong>,<br />
1965) to provide a means for evaluating compliance with the Commission’s<br />
recommendations. Paragraph 15 of that publication states:<br />
‘The presence of a critical nuclide in some critical pathways will not cause the<br />
same exposure of each member of the population outside an installation, and<br />
preoperational investigations […] will usually establish the existence of one<br />
or two groups of people whose characteristics, e.g. habits, location, or age,<br />
cause them to receive doses higher than those received by the rest of the<br />
population outside the installation and this requires them to be considered<br />
separately, i.e., to be designated as critical. Great judgement is necessary in<br />
defining such a group in practice and the following aspects will have to be<br />
considered. Some of these are the same as the factors influencing the design<br />
of routine surveys and only those concerned with the critical group itself are<br />
listed below:<br />
• The location and age distribution of the potentially exposed group<br />
• Dietary habits (e.g., special foodstuffs and amounts consumed)<br />
• Special occupational habits (e.g., the handling of fishing gear)<br />
• The type of dwelling (e.g., shielding characteristics)<br />
• Domestic habits (e.g., time spent indoors, frequency of personal<br />
washing and laundering of clothes)<br />
• Hobbies (e.g., sport fishing or sunbathing).<br />
Such groups in the population may be in the vicinity of the installation or at<br />
some distant location; they may include adult males, adult females, pregnant<br />
women, and children; they may be individuals who eat foodstuffs prepared in<br />
a special way or produced in a particular location; or they may be people in a<br />
particular industry…The concept of critical group provides a sound and<br />
practical way of complying with the Commission’s recommendations<br />
concerning members of the public….’<br />
(14) Paragraph 16 continues:<br />
‘The critical group should be identified in such a way that it is representative<br />
of the more highly exposed individuals in the population and is as<br />
homogeneous as practicable with respect to radiation dose, that is, with<br />
respect to those factors in paragraph 15 which affect the dose in the specific<br />
case considered.’<br />
3
(15) Paragraph 17 states:<br />
‘Once the critical group has been identified in this way, a suitably<br />
representative sample of the group should be selected and studied so as to<br />
assess their [sic] actual or potential exposure. The average exposure of such a<br />
sample should then be regarded as typical of that of the highly exposed<br />
individuals and the Commission’s recommendations for the maximum<br />
permissible doses for individual members of the public applied to the average.<br />
The spread of values in the sample will give some measure of its homogeneity<br />
with respect to the characteristics of the individual (such as metabolic rates)<br />
which may influence the dose received and which are not measured. These<br />
individual differences may tend to increase the spread of the individual doses<br />
received within the critical group. It must also be recognised that, outside the<br />
critical group, there may be a few individuals whose habits and characteristics<br />
are dramatically unconventional. Such peculiarities may sometimes mean that<br />
these individuals receive doses somewhat higher than those in the critical<br />
group.’<br />
(16) The concept of critical group has continued to be used in <strong>ICRP</strong> publications and has<br />
been widely applied in radiation protection. In paragraph 67 of Publication 43 (<strong>ICRP</strong>, 1985)<br />
it is noted:<br />
‘In an extreme case it may be convenient to define the critical group in terms<br />
of a single hypothetical individual, for example when dealing with conditions<br />
well in the future which cannot be characterised in detail. Usually, however,<br />
the critical group would not consist of one individual nor would it be very<br />
large for then homogeneity would be lost. The size of a critical group will<br />
usually be up to a few tens of persons. In a few cases, where large populations<br />
are uniformly exposed, the critical group may be much larger. This guidance<br />
on size has certain implications; for example, in habit surveys it is not<br />
necessary to search for the most exposed individual within a critical group in<br />
order to base controls on that one person. The results of a habit survey at a<br />
particular point in time should be regarded as an indicator of an underlying<br />
distribution and the value adopted for the mean should not be unduly<br />
influenced by the discovery of one or two individuals with extreme habits.’<br />
(17) The 1990 recommendations in <strong>ICRP</strong> Publication 60 (<strong>ICRP</strong>, 1991) state:<br />
‘These groups are chosen to be representative of the individuals most highly<br />
exposed as a result of the source under review. They are required to be<br />
reasonably homogeneous with respect to the characteristics that influence<br />
their doses from that source. When this is achieved any individual constraints<br />
should be applied to the mean values for the critical group. It is implicit that<br />
some members of the critical group will receive doses both above and below<br />
the group average.’<br />
(18) The Commission continues to endorse the principles developed in Publications 7, 43,<br />
and 60 relating to the selection of the individuals for the purpose of assessing compliance<br />
4
with the dose constraint. However, in the 2005 Recommendations, more emphasis is being<br />
placed on source-related individual doses. The purpose of this report is to clarify and<br />
elaborate on the application of this concept by taking into account recent experience and<br />
advances in assessing doses to members of the public.<br />
1.3. Fundamental principles and concepts<br />
(19) In practices and existing situations, the dose constraint for the public is specified in<br />
the form of an annual effective dose for regulatory and administrative purposes. This dose<br />
does not include exposure received from medical or occupational sources. In setting its dose<br />
constraint for the public, the Commission recognises the inherent variability in estimated<br />
annual effective dose to members of the public and the transient nature of many extreme<br />
exposure situations. As a result, the Commission believes there should be a small probability<br />
that some individual may exceed the dose constraint.<br />
(20) The Commission’s constraint for the public is set, in part, on the basis of exposure<br />
situations for individuals that are assumed to continue to occur for a number of years into the<br />
future. (<strong>ICRP</strong>, 2005a). The population being exposed at any given time is made up of a<br />
spectrum of individuals composed of a range of ages, and individuals within the population<br />
must be afforded protection as they progress in age over the time that exposures are expected<br />
to occur.<br />
(21) In most cases it is not possible to monitor dose directly to all members of the public;<br />
rather, monitoring must be focused on environmental pathways such as radon in homes or<br />
concentrations of radionuclides in air or water that may lead to exposure of individuals. Since<br />
dose to the public is not being measured directly, it must be estimated using environmental<br />
concentrations and appropriate habit data. Methods used to calculate dose range between<br />
point value estimates (deterministic) to a distribution of doses (probabilistic). In either case,<br />
or with the application of a mixture of these methods, decision makers need guidance on how<br />
to determine when compliance exists.<br />
(22) In some situations, such as those existing from an accident or earlier practice,<br />
exposure to the public can be directly measured or at least inferred using environmental<br />
concentrations and specific habit data. An example of this is reconstructed doses from the<br />
Chernobyl accident (IAEA, 1991). In this case, a distribution of doses was developed that<br />
could be related to individuals in the population. Generally, these distributions include a<br />
number of doses that lie well beyond those received by most of the population and arise from<br />
some extreme values in habit data.<br />
(23) Therefore, for the purpose of protection of the public, it is necessary to characterise an<br />
individual, either hypothetical or specific, who receives the highest dose which can be used<br />
for determining compliance with the dose constraint. This individual is defined as the<br />
representative individual.<br />
(24) The sections that follow describe fundamental elements of the process of dose<br />
assessment and explain how the representative individual is characterised and identified for<br />
making decisions about compliance, design of a practice, planning for emergencies, and other<br />
aspects of radiation protection for members of the public.<br />
5
2. ASSESSMENT <strong>OF</strong> DOSE<br />
2.1. Purpose of dose assessment<br />
(25) Assessment of annual dose to the public can be made to determine compliance with<br />
the dose constraint, to guide decisions on the level of control of exposure, and to help identify<br />
actions to be taken to reduce exposure. For example, in the case of controlled discharges to<br />
the environment, the results of the comparison with a dose criterion may determine whether<br />
additional effluent control is required. Doses are also estimated to allow for planning in<br />
accident situations and to determine the conditions under which countermeasures may be<br />
taken in the event of an accident. In addition, doses are estimated in the process of<br />
optimisation, where it is not merely sufficient to meet dose the dose constraint, but also<br />
necessary to show that doses below the recommended constraint have been reduced to “as<br />
low as reasonable achievable, social and economic considerations being taken into account”<br />
(<strong>ICRP</strong>, 2005a).<br />
(26) The type of assessment conducted, and the degree to which specific information is<br />
incorporated, will depend on the purpose. In many circumstances, assessments for planning,<br />
optimisation, and compliance will require different types of assessment. Planning and<br />
optimisation, for example, must consider a variety of exposure circumstances and evaluate<br />
where there are opportunities for further protective measures. Compliance assessments, in<br />
contrast, are usually designed to specifically demonstrate that predetermined conditions<br />
either are, or are not, being met. The remainder of this report focuses on demonstrations of<br />
compliance with a pre-selected constraint, which may be the quantitative values<br />
recommended by the Commission, but may also be the more specific constraint derived for a<br />
particular situation through constrained optimisation as recommended by the Commission.<br />
2.2. Types of dose assessment<br />
(27) The Commission recognises three types of exposure situations: practices, existing<br />
situations, and emergency situations. Furthermore, dose assessments may be prospective, or<br />
retrospective (see Table 1). Assessments of dose for the current year can be categorised in<br />
either of these two types depending on whether the dose is estimated for the upcoming year<br />
(prospective) or the past year (retrospective).<br />
(28) Prospective dose is estimated for hypothetical individuals while retrospective dose is<br />
generally estimated for specific individuals. The Commission emphasizes that by<br />
“hypothetical” it implies that exposures have not yet occurred and that persons who may<br />
receive prospective exposures are assumed to exist and to possess certain habit characteristics<br />
whether or not these can be related to specific individuals. In retrospective assessments it is<br />
possible to estimate exposure to specific individuals.<br />
6
Table 1. Examples of dose assessment in different exposure situations<br />
SITUATION<br />
Practice<br />
Prospective<br />
Design of new facility or<br />
compliance with the dose<br />
constraint for an upcoming<br />
year<br />
TYPE <strong>OF</strong> ASSESSMENT<br />
Retrospective<br />
Dose to the public from past<br />
operations or compliance<br />
with dose the dose constraint<br />
for past year<br />
Existing<br />
Future prolonged exposures<br />
(e.g., after remediation)<br />
Earlier exposures<br />
Emergency<br />
Emergency planning<br />
Actual impacts after<br />
emergency<br />
(29) For practices, prospective assessments are undertaken to estimate future exposures<br />
and to show whether a proposed course of action (e.g., the introduction of a new source or the<br />
continuation of an existing source) is indicated or optimised. These assessments will<br />
necessarily have to make assumptions about future conditions. Such prospective assessments<br />
provide the basis for determining compliance once the source has been introduced.<br />
(30) Prospective assessments are also undertaken to indicate whether a continuing<br />
situation will comply with the appropriate dose constraint for an upcoming year. They may<br />
incorporate more detailed information about present site-specific conditions available and<br />
may also have less uncertainty because conditions may be better known than a prospective<br />
assessment for the distant future. When a prospective assessment is to be used specifically for<br />
developing authorisation for sources and for demonstrating compliance, the form and scope<br />
of the assessment should be specified to correspond with the basis for the requirement.<br />
(31) Prospective assessments are also conducted in emergency situations if an event takes<br />
place that releases radiation or radioactive material. The assessment takes what may be<br />
limited field data and measurements, and translates them into estimates of dose for decision<br />
makers who must make recommendations for short-term protective actions.<br />
(32) Prospective assessments also are used in the late phase of an emergency response,<br />
after the event has been controlled and early protective actions have been implemented. The<br />
situation posed by any remaining residual radioactivity is essentially one of continuing<br />
exposure and is conceptually the same as an existing exposure.<br />
(33) Finally, prospective assessments may be undertaken to assess an existing situation<br />
that was previously unrecognised, and they may be part of the information used to determine<br />
if protective actions should be introduced to reduce unacceptable exposures<br />
7
(34) Existing situations may require prospective assessments or retrospective assessments<br />
to determine the implications of proposed actions. When such cases have been identified, the<br />
assessment provides the basis for understanding the future consequences if no actions are<br />
taken, or for understanding the dose averted if certain actions are implemented. They also<br />
provide the basis for communication with those exposed in the situation, and the options that<br />
may be available.<br />
(35) Retrospective assessments may be undertaken to retrospectively demonstrate<br />
compliance with the Commission’s dose constraint or could be used as the basis of<br />
epidemiological studies (e.g., as in historical dose reconstruction) and generally incorporate<br />
more information in calculations than prospective analyses. Additionally, retrospective<br />
assessments may be undertaken following the initial phases of an emergency situation to<br />
accurately characterise and report the actual impacts and the effects of protective actions that<br />
may have been undertaken, and to provide information to individuals.<br />
(36) In emergency situations, there is the potential for relatively high doses to be delivered<br />
over relatively short periods of time. During emergency planning activities, prospective<br />
assessments may be made modelling potential source terms and the populations around a<br />
particular source, so that pre-planned protective measures can be established. These<br />
assessments are used to identify individuals and groups that would be subject to dose<br />
constraints for actions, if the emergency scenario actually were to occur. Emergency<br />
countermeasures are intended to restrict or control the dose to individuals in these short time<br />
periods.<br />
(37) Protective actions in emergency situations are often based on protecting specific<br />
groups, such as children. In these situations, age-specific habits and age-specific dose<br />
coefficients are used to assess the relevant doses and to make decisions on countermeasures.<br />
In emergency response, therefore, information on age groups or populations that were<br />
exposed should be included explicitly in the assessment. .<br />
2.3. Overview of the dose assessment process<br />
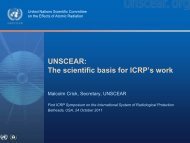
(38) Dose assessment can be thought of as a multi-stage process, as demonstrated in<br />
Figure 1. The first stage is to obtain information about the source, including data on the types<br />
and quantities of radionuclides and radiations emitted. The second stage is to obtain<br />
information about the environment, specifically the concentrations of radionuclides in<br />
environmental media arising from the source in question. For external doses, either the<br />
concentrations in air, soil, or water, or the external dose rates are needed. For internal doses,<br />
it is necessary to know concentrations in food, water, or air that may be taken into the body.<br />
The third stage of the process is to combine concentrations with habit data that are selected<br />
based on exposure scenarios of the relevant person or group. For external doses, the amount<br />
of time spent in different radiation fields is needed, while for internal exposures, information<br />
on the amount of food and water consumed or air breathed is required to estimate activity<br />
intakes. The next stage is to use dose coefficients that either relate concentrations in air or<br />
soil to external dose rates (external doses), or that convert a unit of intake into dose (internal<br />
doses). Dose coefficients for internal exposure are estimated using models of radionuclide<br />
behaviour and radiation absorption in the body. They have been derived and published by<br />
<strong>ICRP</strong>. The final stage is to sum the contributions from external and internal exposure as<br />
appropriate. As an aid to clarification, and for intakes of radionuclides in particular, it is<br />
useful to consider the stages separately.<br />
8
(39) In stage one, the source of the exposure should be characterised. In the case of<br />
discharges to the environment, this characterisation may include discharge rates for<br />
radionuclides of interest, stack heights, proximities of relevant neighbouring buildings,<br />
physical and chemical forms of the material, and meteorological conditions. Direct radiation<br />
from sources through shielding, or via scattering or refraction by material in the atmosphere,<br />
should also be examined.<br />
(40) In stage two, environmental concentrations at various locations are obtained by<br />
measurements, or by modelling the dispersion, deposition, and transport of radionuclides<br />
through environmental media, or by a combination of both. Both measurements and<br />
modelling will have associated uncertainties. The result for each location is a distribution of<br />
concentrations of activity for each radionuclide and environmental pathway, as a result of the<br />
source. In this stage, the development of the distribution should be independent of the<br />
presence or absence of individuals and should be based on whether there is the potential that<br />
an individual could be present at the location.<br />
SOURCE<br />
EXTERNAL<br />
EXPOSURE<br />
<strong>IN</strong>TERNAL<br />
EXPOSURE<br />
Concentration of radionuclides<br />
in environmental media giving<br />
external exposure<br />
Concentration of radionuclides<br />
in environmental media taken<br />
into the body through ingestion,<br />
inhalation, and dermal contact<br />
Environment<br />
Estimate dose rates from<br />
environmental concentrations<br />
and exposure times from habit<br />
data<br />
Combine concentrations with<br />
habit data to estimate the<br />
radionuclide intake into the<br />
body<br />
Habits<br />
Calculate the dose by<br />
combining exposure rate and<br />
time with dose coefficients for<br />
external exposure<br />
Calculate the dose by<br />
combining the radionuclide<br />
intake with dose coefficients<br />
Dose<br />
Sum to give annual effective dose<br />
9
Figure 1. Assessment of annual dose.<br />
(41) The third stage of the process is the combination of concentrations of radionuclides in<br />
environmental media with habit data and other information on the representative individual<br />
that are defined by exposure scenarios and allow estimation of exposure and dose.<br />
Information that needs to be considered include location, diet, lifestyle activities leading to<br />
radiation exposure, and age-dependent physiological factors such as age and breathing rates.<br />
The selection of this information is discussed in detail in Section 3. In many cases, these data<br />
can be obtained from available information about local populations. However, some<br />
situations may require regional or national information to be used in the absence of sitespecific<br />
data.<br />
(42) The fourth stage of the dose assessment process is the application of dose coefficients<br />
and related quantities. For intakes of radionuclides, these dose coefficients are expressed in<br />
terms of committed effective dose per unit activity intake or equivalent dose to an organ.<br />
Summation of the contributions from internal and external irradiation results in a total annual<br />
dose.<br />
(43) This report provides guidance primarily on the third and fourth stages of the process.<br />
2.4. Treatment of uncertainties in dose assessment<br />
(44) It is recognised that uncertainties are inherent in any process of defining individual<br />
characteristics and in estimating doses. Whether doses are estimated by using measurement<br />
data, by applying models, or through a combination of measurements and calculations, the<br />
uncertainty for a given annual dose estimate is represented by a distribution of possible<br />
values. Uncertainty in dose assessment is a result of the inherent variability of some of the<br />
processes involved or a lack of knowledge about specific data that are needed for evaluating<br />
the dose.<br />
(45) The Commission draws a distinction between quantities having values that are<br />
measured or estimated and quantities that have values that are selected, either by the<br />
Commission or by other organizations. For example, dose constraints, weighting factors, and<br />
dose coefficients, when used in the process of assessing compliance and in decision making,<br />
are assumed not to be uncertain. They are assumed to be point values. The Commission<br />
recognises uncertainties in the models linking detriment to dose. These uncertainties are<br />
considered in establishing selected values of quantities such as limits and constraints.<br />
(46) Uncertainties associated with estimation of dose may be taken into account either<br />
deterministically by using single values for parameters chosen to take account of uncertainty,<br />
or probabilistically by incorporating distributions for parameter values. With either<br />
methodology, the goal should be to perform a realistic evaluation of dose.<br />
(47) The Commission considers that the final decision on how to include uncertainties in<br />
the estimation of dose for compliance purposes should be made by the regulatory authority.<br />
2.5. Deterministic and probabilistic methods for dose assessment<br />
10
(48) As stated above, dose to the representative individual may be calculated either<br />
deterministically or probabilistically, or a mixture of these methods may be applied. The<br />
method used will depend on the particular situation and the capabilities and data available.<br />
Understanding the differences between these methods is important in applying guidance on<br />
how compliance with the Commission’s recommendations is determined. Therefore, a brief<br />
description of these methods follows.<br />
(49) The simplest deterministic method for assessing compliance is by a screening<br />
evaluation. This method typically makes use of simplifying assumptions that lead to a very<br />
conservative estimate of doses based on, for example, concentrations of radionuclides at the<br />
point of discharge from the source. If the results of relatively conservative screening<br />
assessments demonstrate that doses are well below the applicable dose constraint, there may<br />
be no need for further detailed assessment of dose. A number of screening methods have been<br />
developed and are available for application (NCRP, 1996; IAEA, 2001).<br />
(50) In another form of the deterministic method, a general assessment of the involved<br />
populations, pathways, and radionuclides has to be made with the goal of identifying the<br />
group or groups receiving the highest dose using expert opinion, measurement data, or simple<br />
calculations. In some situations, people receiving the highest dose are easily identified<br />
because site-specific exposure data are readily available and habit information is known. In<br />
other situations, identifying these individuals is an iterative process that considers key<br />
pathways of exposure and populations receiving doses from the source. The iterative process<br />
will usually indicate the areas that are likely to receive the greatest exposure from each<br />
pathway. These areas should be investigated in more detail. Ultimately, a group is identified<br />
that is expected to receive the highest exposure. Dose to this group is compared to the dose<br />
constraint to determine compliance. This method is consistent with the earlier<br />
recommendations of the Commission based on the critical group approach.<br />
(51) With advances in technology, decision makers have available powerful tools that<br />
allow the variability of data needed to estimate dose to be taken into account. The<br />
probabilistic method combines the distribution of values for each of the parameters into a<br />
composite distribution that present a range of possible doses based on their probability of<br />
occurrence. The distribution of dose incorporates (1) the uncertainty and natural variability in<br />
the estimated environmental media concentration (i.e., radionuclide concentration in air,<br />
water, soil, and food) and (2) uncertainty in the habit data (i.e., breathing rate, food and water<br />
ingestion rates, time spent at various activities). However, decision makers need guidance on<br />
how to determine compliance with the Commission’s recommendations.<br />
(52) A mixture of the deterministic and probabilistic methods is often used. One example<br />
of this is the use of measurement data in an existing exposure situation to determine dose to<br />
individuals (IAEA 1991, Lochard 2004). In this case, a distribution of doses is produced<br />
among the exposed population because of the variability of habit and measurement data, and<br />
it is this distribution that becomes the basis for determining compliance.<br />
11
3. <strong>THE</strong> REPRESENTATIVE <strong>IN</strong>DIVIDUAL<br />
3.1. Definition of the representative individual<br />
(53) Since dose to the public cannot be measured directly, it must be estimated using<br />
environmental concentrations and appropriate habit data. Therefore, for the purpose of<br />
protection of the public, it is necessary to define a hypothetical exposed person to be used for<br />
determining compliance with the dose constraint and for introduction of a practice. This is<br />
the representative individual. The representative individual is the hypothetical individual<br />
receiving a dose that is representative of the most highly exposed individuals in the<br />
population.<br />
(54) In considering dose to the representative individual, a number of factors must be<br />
taken into account: (1) the dose must account for all pathways of exposure; (2) the dose must<br />
consider spatial distribution of radionuclides to be assured that the group receiving the<br />
highest dose is included in the assessment; (3) habit data should be based on the group or<br />
population exposed and must be reasonable, sustainable, and homogeneous; (4) dose<br />
coefficients must be applied appropriate to specific age categories. Once these factors are<br />
taken into account and depending on the assessment approach employed (deterministic or<br />
probabilistic or a mixture of these), the representative individual can be identified and used to<br />
determine compliance. Additional elaboration follows on each of these factors.<br />
3.2. Pathways of exposure, time frames, and spatial distribution of radionuclides<br />
(55) It is important that dose to the representative individual includes appropriate<br />
contributions from all modes of exposure (e.g., atmospheric discharges, liquid discharges,<br />
and direct external exposure). It is possible that in some assessments one pathway or a few<br />
pathways dominate the exposure and simplifying assumptions can be made to demonstrate<br />
that only the pathways that contribute significantly to the exposure need to be taken into<br />
account. The key to which pathways must be included depend on the type of assessment, but<br />
the overall goal should be to be certain that no important pathway has been omitted.<br />
(56) The prospective assessment of individual exposure in general terms covers the present<br />
generation for a period of 50 years. This corresponds approximately to the lifetime operation<br />
for most nuclear or other facilities using radioactive materials. For this time period, it is<br />
reasonable to assume that characteristics of individuals can be based on current habit data.<br />
Nevertheless, it is important to occasionally re-evaluate the selected characteristics during the<br />
lifetime of a facility to account for significant changes that might occur in demographic data<br />
and lifestyles.<br />
(57) In assessing doses in prospective situations, it may be appropriate to recognise that<br />
institutional controls on land use (e.g., designation as a national park or wilderness area) will<br />
be in effect. These might preclude types of activity (e.g., residential use or arable cropping)<br />
in the designated area so that obtaining staple food supplies from the area would not be<br />
possible. Climatic conditions might also preclude or dictate potential for future habitation and<br />
locally produced foodstuffs (e.g., in an arid zone, availability of water might preclude both<br />
extended residence and sustainable food production). Therefore, the selection of appropriate<br />
characteristics should take these conditions into account.<br />
12
(58) The spatial distribution of radionuclides discharged and the build-up of long-lived<br />
radionuclides over the lifetime of a facility have to be taken into account. One example of<br />
this build-up is the accumulation in river or lake sediments of radionuclides from liquid<br />
releases. Such build-up could result in the most exposed individuals being distant from the<br />
facility or being exposed later in time.<br />
(59) The possibility of future changes in land use may need to be considered in a<br />
prospective assessment. For example, currently there may be no agricultural production in the<br />
vicinity of a proposed facility, but such production could start during the facility’s proposed<br />
lifetime. Whether this agricultural production is assumed in a prospective assessment should<br />
be determined by the regulatory authority.<br />
3.3. Characteristics of the representative individual<br />
(60) As indicated in paragraph 4, characteristics of an individual are described by agedependent<br />
physiological parameters and habit data that include dietary information, residence<br />
data, use of local resources, and any other information that is necessary to estimate dose.<br />
(61) It is important that the individual habits (e.g. consumption of foodstuffs, location, use<br />
of local resources) used in the deterministic approach are average habits of a small number of<br />
individuals representative of those most exposed and not the habits of a single extreme<br />
member of the population. Consideration may be given to some extreme or unusual habits,<br />
but they should not dictate the characteristics of the individuals considered. An exception<br />
may be the habits of a single individual that might reasonably be expected to continue for an<br />
extended period of time by that individual or others.<br />
(62) When distributions of habit data are employed in a probabilistic approach, the habit<br />
data considered should include the range of all possible values found within a population,<br />
including extreme values on either end that may apply to only a small number of people. The<br />
distributions of habits should be appropriate for the location or situation under consideration.<br />
For example, if discharges to a coastal environment are the subject of an assessment, the<br />
distributions of habits should reflect the behaviours of residents of coastal communities.<br />
(63) If specific habit data for a local population are not available (e.g., fish consumption<br />
from a coastal area with a local discharge of radionuclides into the marine environment),<br />
values may be derived from national or regional population data. A distribution of these data<br />
may be used in probabilistic assessments, or a value on the distribution may be selected for<br />
deterministic calculations. Established databases suggest that the 95 th percentile of<br />
consumption rates for many staple foods tend to exceed the mean value of the distribution by<br />
approximately a factor of 3 (Byrom et al., 1995). Therefore, with deterministic methods,<br />
using the 95 th percentile of behaviour is considered to represent a cautious, but acceptable,<br />
assumption for defining a reasonable and sustainable intake rate.<br />
(64) Generally, one exposure pathway for a particular source will dominate the dose to the<br />
representative individual from that source. If more than one intake route for radionuclides<br />
provides a significant contribution to dose, it may not be reasonable to assume that 95 th<br />
percentile habit data are applicable to all routes; the more dominant route should be assigned<br />
a 95 th percentile intake, and a lower value assigned to other pathways, consistent with the<br />
requirement that assessments represent a set of habits that are reasonable and sustainable.<br />
Even if more than one exposure pathway has a significant contribution to the summed<br />
13
effective dose, the individuals receiving the highest exposures tend to be fairly homogeneous<br />
in regard to habits (Hunt 1982 and Hunt 2004).<br />
(65) The critical group concept as described in previous <strong>ICRP</strong> publications has some<br />
potential weaknesses because it implies a detailed knowledge of local habits, because those<br />
habits may not be fixed over the time period of dose assessment, and because local habit data<br />
may vary from one similar site to another at any particular time, leading to potentially<br />
varying operating regimes. These weaknesses may be avoided if habit data are derived from<br />
national or regional information using the 95 th percentile as described above.<br />
(66) In selecting characteristics of the representative individual, reasonableness,<br />
sustainability, and homogeneity must be considered.<br />
(67) Reasonableness implies that characteristics realistically apply to an individual and are<br />
not outside the range of what an individual encounters in day-to-day life. Reasonableness of<br />
characteristics must be considered whether probabilistic or deterministic methods are<br />
employed.<br />
(68) Sustainability and homogeneity are aspects of reasonableness. In the deterministic<br />
approach, the question of reasonableness in selection of characteristics is related to that of<br />
homogeneity because the dose constraint is intended to apply to doses derived from the mean<br />
characteristics in a reasonably homogeneous group. Homogeneity addresses the degree to<br />
which extremes in particular characteristics are, or are not, included in the assessment.<br />
(69) The Commission has previously stated (<strong>ICRP</strong>, 1985) that the necessary degree of<br />
homogeneity in the highest exposed group depends on the magnitude of the mean dose in the<br />
group as a fraction of the relevant dose limit or constraint. If that fraction is less than about<br />
one-tenth, the group should be regarded as homogenous if the distribution of individual doses<br />
lies substantially within a total range of a factor of 10 (i.e., a factor of about 3 on either side<br />
of the mean). At fractions above one-tenth, the total range should be less, preferably no more<br />
than a factor of 3.<br />
(70) Sustainability addresses the degree to which the selected characteristics can be<br />
continued over the time frame of the assessment. The characteristics selected need to be<br />
sustainable. For example, the total dietary intake should be consistent with credible calorific<br />
requirements. Habits should correspond to an individual’s personal requirements. It is<br />
inappropriate to assume, for example, that the same individual receives daily nutrient<br />
requirements independently from each of several different pathways (e.g., agriculture, and<br />
fishing). Also, it is inappropriate to assume that all foods consumed in an area are grown<br />
within that area if it is apparent that the location and land area available could not support the<br />
assumed dietary intake. Similarly, the intakes of wild game from an area should not exceed<br />
feasible game-capture rates. In the case of significant contributions to the dose from external<br />
exposure, reasonable estimates of times spent in areas of elevated exposure rates are required.<br />
In general, maintenance of exposure situations for a period of at least 5 years would be<br />
considered sustainable.<br />
14
3.4. Age-specific dose coefficients<br />
(71) It is generally recognised that for external exposure, there is little variability in dose<br />
with age (Golikov et al., 1999; Golikov et al., 2000). However, the Commission has issued<br />
age-specific dose coefficients for intakes of radionuclides in seven age ranges covering the<br />
time period from the foetus to age 70 years (<strong>ICRP</strong>, 1996; <strong>ICRP</strong>, 2002). These coefficients<br />
allow the calculation of dose for specific age groups. This section provides further guidance<br />
on the incorporation of age-specific dose coefficients for internal exposure for the<br />
representative individual and distinguishes among their use in different situations. As a basis<br />
for understanding the use of age-specific dose coefficients in determining compliance,<br />
several goals and fundamental concepts underlying the Commission’s recommendations need<br />
to be discussed.<br />
(72) As stated in the draft 2005 Recommendations (<strong>ICRP</strong>, 2005a), one goal of the<br />
Commission is simplification of its recommendations. The number of age-specific internal<br />
dose coefficients has continued to evolve and increase over time, making it possible to<br />
calculate dose to more age groups. This refinement in dose coefficients, however, must be<br />
weighed in relation to the ability to predict concentrations in the environment from a source<br />
and the ability to account for variations in habit data for individuals exposed. Uncertainties in<br />
estimates of dose, particularly for prospective calculations, are generally not significantly<br />
reduced by increasing the number of age categories for which dose coefficients have been<br />
provided. Therefore, the Commission believes that some consolidation of the age-specific<br />
dose coefficients is warranted in these situations.<br />
(73) Paragraph 19 points out that the dose constraint is set, at least in part, on the basis of<br />
exposures to individuals that are assumed to continue to occur for a number of years into the<br />
future. Therefore, it is the same individual being exposed for a number of years for whom<br />
compliance is being determined. This fundamental concept of continuing exposure to the<br />
same individual justifies the use of age categories that cover several years of a person’s life.<br />
(74) These dose coefficients provided by the Commission take into account the committed<br />
dose resulting from the accumulation of radionuclides in the body over a period of 70 years.<br />
This conservative accounting assures individuals are protected over a lifetime of exposure,<br />
regardless of the number of years they are exposed.<br />
(75) The Commission allows averaging over a five-year period in evaluating compliance<br />
with the dose the dose constraint (<strong>ICRP</strong> 1991; <strong>ICRP</strong> 2005a) and, therefore, recommends that<br />
a similar approach is appropriate for establishing the number of age groups to be considered<br />
in prospective assessment of continuing exposure. Experience to date indicates that age<br />
categories can be combined without impacting protection of members of the public in these<br />
situations.<br />
(76) With these goals and fundamental concepts in mind, the Commission has considered<br />
the change in internal dose as a function of age when unique age-specific habit data and dose<br />
coefficients are applied. These data are discussed and presented in Appendix A. It is evident<br />
from these calculations that with the exception of the actinides, the differences among dose to<br />
different age groups are generally small (generally less than a factor of 3) in comparison to<br />
uncertainties typically found in assessment of dose to the public. For the actinides, dose<br />
15
coefficients take into account the integrated commitment for a lifetime of exposure, which<br />
tends to overestimate dose to an individual in any given year.<br />
(77) In view of the goals and fundamental concepts underlying the Commission’s<br />
recommendations, some consolidation of the age-specific dose coefficients for internal<br />
exposure is justified.<br />
(78) Therefore, for the purpose of compliance with the dose constraint for continuing<br />
exposure, the Commission recommends annual dose for representative individuals be defined<br />
by three age categories. These categories are 0 to
coefficients published by the Commission improve the quality of doses and reduce their<br />
uncertainty.<br />
(82) The Commission continues to encourage the use of all available age-specific dose<br />
coefficients in the planning for and response to accidents. However, the consolidated age<br />
categories proposed by the Commission in this report may be acceptable in some accident<br />
situations, especially when prospective assessments are being made of future consequences<br />
of the accident or remediation alternatives. This decision should be made by appropriate<br />
regulatory authorities.<br />
Table 2. Dose coefficients recommended for determining compliance with the dose<br />
constraint<br />
Age category (y) Name of age category<br />
Dose coefficient to be<br />
used<br />
0–
(88) In a prospective probabilistic assessment of dose to hypothetical individuals, whether<br />
from a planned facility or an existing situation, the Commission recommends that the<br />
representative individual be identified such that the probability is less than about 5% that a<br />
person drawn at random from the hypothetical population will receive an annual effective<br />
dose exceeding the dose constraint. This hypothetical individual should be representative of,<br />
at most, a few tens of people who are the most highly exposed. If this dose to the<br />
representative individual is below the dose constraint set by the Commission, then the design<br />
and planned operations are determined to be in compliance.<br />
(89) In a probabilistic assessment of prospective dose to hypothetical individuals, if a<br />
homogeneous group of a few tens of persons or more is found to exist whose dose is above<br />
that for the representative individual, then the presence of a new homogeneous group (and<br />
thus different representative individual) needs to be explored. Determining the existence of a<br />
homogeneous group in a probabilistic assessment can be problematic. For example, if a large<br />
population is being considered within the region of study, the existence of a homogeneous<br />
group of individuals above the dose constraint may be difficult to distinguish from a<br />
histogram or distribution curve. Therefore, care must always be taken to fully investigate the<br />
distribution of doses above the dose constraint to consider carefully all plausible scenarios of<br />
exposure, and to avoid the premature conclusion that these scenarios would correspond to<br />
few if any “random” individuals. Close attention must be paid to suggestions from members<br />
of the public of existing or likely exposure situations that might reflect extremes in the<br />
population. Such contributions may not have been considered in the operator’s analysis, and<br />
although they most often correspond to low exposures, experience has shown that they<br />
sometimes point out potentially significant exposure pathways that have not been considered<br />
and that warrant further investigation. If it can be shown that such a pathway, in combination<br />
with other exposure, is likely to affect a few tens of persons and elevate their doses above the<br />
dose constraint, then a revision of the analysis must be undertaken. If such a homogeneous<br />
group is found to exist above the dose constraint, then the mean dose to this group becomes<br />
the basis for compliance.<br />
(90) For retrospective assessments of dose to specific individuals, either for the purpose of<br />
determining compliance for a past period of operation of a practice or an existing situation,<br />
the Commission recognises that estimated doses above the dose constraint must be evaluated<br />
on a case by case basis. In most cases it may be expected that the extremes represented by<br />
these individuals will continue for only a short time or may actually never be realised.<br />
However, if doses to specific individuals exceeded the dose constraint and these doses are<br />
expected to continue for a protracted period of time, a decision must be made by the operator<br />
and the regulator whether a reduction in the source is required or whether changes in habits<br />
of the individuals exposed might be proposed and supported. Such a situation might warrant<br />
additional monitoring to reduce uncertainty in the dose estimate or verify the magnitude of<br />
dose. The above considerations should be separate from any decision regarding whether the<br />
previous design or operations were in compliance with their basis of authorisation.<br />
(91) Regardless of the approach taken to determine compliance, the Commission stresses<br />
that application of the total system of protection, utilising both compliance with the<br />
quantitative constraint and optimisation of protection, is necessary for radiological<br />
protection.<br />
18
Table 3. Summary of methods used for determining dose to the representative<br />
individual<br />
Environmental<br />
concentration data<br />
CALCULATION METHOD<br />
Probabilistic<br />
Deterministic<br />
Distribution of estimated<br />
or measured concentration<br />
Single “best estimate”<br />
Average value for the<br />
Range or fixed values of<br />
Physiological or habit<br />
highest exposed group or<br />
physiological parameters<br />
data<br />
95 th percentile of national<br />
or habit data<br />
or regional data<br />
Dose coefficient Fixed value based on age Fixed value based on age<br />
Dose to the representative<br />
individual<br />
Method selected by<br />
operator or regulator.<br />
Representative individual<br />
is identified such that the<br />
probability is less than<br />
about 5% that a person<br />
drawn at random from the<br />
hypothetical population<br />
will receive an annual<br />
effective dose exceeding<br />
the dose constraint.<br />
Product of above values<br />
19
4. O<strong>THE</strong>R CONSIDERATIONS RELEVANT TO <strong>THE</strong><br />
REPRESENTATIVE <strong>IN</strong>DIVIDUAL<br />
4.1. Relationship between environmental monitoring, modelling, and the representative<br />
individual<br />
(92) Prospective assessments are usually undertaken to establish the acceptability of<br />
proposed controlled releases to the environment. They almost always involve the use of<br />
models, which usually provide the only means of estimating the concentrations of<br />
radionuclides in the environmental materials. The representative individual should be<br />
assumed to exist at the location where the estimated environmental concentrations lead to the<br />
highest doses subject to the requirements for reasonableness, sustainability, and homogeneity<br />
noted earlier. The temporal and spatial scales represented by the models must also be<br />
appropriate for the intended use.<br />
(93) When a source already exists (continuing practices, existing situations, and<br />
emergency situations), monitoring radionuclide levels in the environment will normally be<br />
the most robust method for determining environmental concentrations of radionuclides. This<br />
was the primary focus of <strong>ICRP</strong> Publication 43 (<strong>ICRP</strong>, 1985). Monitoring programmes should<br />
be guided by the identification of dominant pathways and radionuclides, taking the detection<br />
limits and source of radionuclides into account. Environmental modelling is also an important<br />
and complementary component of monitoring. <strong>ICRP</strong> Publication 43 (<strong>ICRP</strong>, 1985) gives<br />
guidance on the use and limitations of both monitoring and modelling to estimate doses.<br />
4.2. Situations of potential exposure<br />
(94) In normal exposure situations annual doses are either being delivered or will certainly<br />
occur in the future. But there may also be situations in which the exposure is not certain to<br />
occur and the attributed dose may have only a small probability of occurring. These are<br />
termed situations of potential exposure. Potential exposure situations can cover a wide range<br />
of circumstances, including equipment failures and accidents involving radiation sources as<br />
well as highly non-uniform distribution of radioactive residues.<br />
(95) According to the Commission's recommendations, a potential exposure situation<br />
should be evaluated on the basis of the combination of the probabilities that a radiation dose<br />
will be incurred and the probability of harm given that the dose has occurred. (<strong>ICRP</strong>, 1993).<br />
The product of these probabilities is the unconditional probability of incurring the health<br />
effect. It should be noted, however, that it is more informative for decision-making purposes<br />
to present the probability of incurring a dose separately from that dose (<strong>ICRP</strong>, 2000a).<br />
(96) The identification of the representative individual in potential exposure situations<br />
must take into account the probability of exposure in addition to the other factors in the<br />
assessment. The annual dose that such an individual would incur, should the exposure<br />
actually take place, is not a sufficient indicator although the magnitude of the dose could be<br />
important in deciding what risk factor to use. Thus, in addition to characterising the habits,<br />
locations, and environmental concentrations of radionuclides, it is necessary to characterise<br />
the probability that the individual is exposed. This probability may in fact be the combination<br />
of several probabilities, including that of being in the particular location and being engaged<br />
in the specific activity causing an exposure to occur. In deterministic assessments, this<br />
20
equires selection of the value for probability of exposure to be included in the calculations.<br />
For probabilistic assessments, a distribution may be used if such information is available.<br />
(97) An example of an environmental potential exposure situation is presented by areas<br />
contaminated with sparsely distributed hot particles and has been illustrated in the assessment<br />
of the radiological situation created by plutonium hot particles present on the motus (islets) of<br />
Colette, Ariel, and Vesta, in the Atoll of Mururoa, French Polynesia (IAEA 1998). In contrast<br />
to the usual assumptions of relative uniform contamination, there may be only a relatively<br />
small probability that the individual would be exposed to one of the hot particles, and an even<br />
lower probability that this material would result in an internal exposure through ingestion or<br />
absorption through a wound in the body. Even though such a scenario is not likely to occur,<br />
should people be exposed to the contaminated area and a hot particle be actually incorporated<br />
through a wound, the resulting local dose might be relatively large and could even be a cause<br />
of localized deterministic effects such as micro-necroses around the incorporated hot<br />
particles. The potential for this exposure would remain for as long as the hot particles were<br />
present in the environment.<br />
(98) The quantitative approaches to potential exposure are also of use in other situations<br />
where exposure may be intermittent or infrequent.<br />
4.3. Value of stakeholder input to characterising the representative individual<br />
(99) As noted in <strong>ICRP</strong> Publication 82 (<strong>ICRP</strong>, 2000b), in the wider decision-making<br />
process, the role of stakeholders should be recognised. This role for stakeholders was<br />
described in Publication 82 in the context of protection of the public in situations of<br />
prolonged exposure. Since Publication 82 was published, the Commission has continued to<br />
consider and support the role of stakeholders in the <strong>ICRP</strong> system of protection. However, the<br />
Commission believes this role needs to be defined, clarified, and expanded to include other<br />
situations. Further information on this subject will be provided in <strong>ICRP</strong> Publication XX<br />
(<strong>ICRP</strong>, 2005b); however, it is important to provide several key principles related to<br />
stakeholder involvement in the characterisation of the individual being described in this<br />
report.<br />
(100) By definition, the decision maker and the operator have clearly defined roles and<br />
responsibilities in the characterisation of the individual and in determining compliance.<br />
Beyond this, there are other types of involved individuals or groups. These are considered<br />
stakeholders, and include, for example, individuals who have a personal, financial, health, or<br />
legal interest in policy or recommendations that affect their well being or that of their<br />
environment. In most cases, the role of stakeholders is to aid in the decision-making process.<br />
There may be situations where stakeholders have the authority and responsibility for making<br />
or recommending decisions (such as a nationally appointed board or committee). Generally,<br />
however, the operator and regulator are the decision makers, and the stakeholders help in the<br />
process by providing information and guidance related to decisions being made.<br />
(101) In the case of defining characteristics of the representative individual, stakeholder<br />
involvement can play an important role. Stakeholders can provide valuable input regarding<br />
habit data that are specific to their location. In particular, stakeholders can be helpful in<br />
determining reasonableness, sustainability, and homogeneity of data. Collaboration with<br />
stakeholders can significantly improve the quality, understanding, and acceptability of<br />
21
characteristics of the representative individual, and also strengthen support from stakeholders<br />
in the compliance and decision-making process.<br />
(102) If stakeholder involvement is used as part of the overall decision-making process,<br />
guidelines should be established to ensure the process is effective and meaningful for all<br />
parties. Some of these guidelines include, but are not limited to: (1) clearly defining the role<br />
of stakeholders at the beginning of the process, (2) agreeing on a plan for involvement, (3)<br />
providing a mechanism for documenting and responding to stakeholder involvement, and (4)<br />
recognising, by operators and regulators, that stakeholder involvement can be complex and<br />
require additional resources to implement.<br />
(103) The Commission understands the concept of stakeholder involvement may vary<br />
significantly from one country to another for cultural, societal and political reasons.<br />
Therefore, the value and extent of stakeholder involvement must be considered by individual<br />
authorities in those countries. Nevertheless, the Commission believes that stakeholder<br />
involvement can play an important role in the implementation, understanding, and acceptance<br />
of the <strong>ICRP</strong> system of protection.<br />
22
5. REFERENCES<br />
Byrom, J., C. Robinson, J.R. Simmonds, B. Walters, and R.R. Taylor. 1995. “Food<br />
Consumption Rates for Use in Generalised Radiological Dose Assessments.” J Radiol.<br />
Prot. 15 (4): 335–341.<br />
Golikov, V., M. Balonov, V. Erkin, and P. Jacob. 1999. “Model Validation for External<br />
Doses Due to Environmental Contaminations by the Chernobyl Accident.” Health Phys.<br />
77(6): 654–661.<br />
Golikov, V., M. Balonov, and P. Jacob. 2000. “Model of External Exposure of Population<br />
Living in the Areas Contaminated after the Chernobyl Accident and its Validation.” In:<br />
Harmonization of Radiation, Human Life and the Ecosystem, Proc. of 10 th International<br />
Congress of the IRPA, International Conference Centre, Hiroshima, Japan, 746-T-19(1)-2.<br />
Hunt, G.J., C.J. Hewett, , and J.G. Shepard. 1982. “The Identification of Critical Groups and<br />
its Application to Fish and Shellfish Consumers in the Coastal Area of the Northeast Irish<br />
Sea.” Health Phys. 43 (6): 875–889.<br />
Hunt, G.J. 2004. On Homogeniety within the Critical Group. J. Radiol. Prot. 24 265-272.<br />
IAEA (International Atomic Energy Agency). 1991. The International Chernobyl Project:<br />
Technical Report. International Atomic Energy Agency, Vienna. Part E. Annex 3: 239.<br />
IAEA (International Atomic Energy Agency). 1998. To be provided.<br />
IAEA (International Atomic Energy Agency). 2001. Generic Models for Use in Assessing the<br />
Impact of Discharges of Radioactive Substances to the Environment. International Atomic<br />
Energy Agency Safety Report Series No. 19, International Atomic Energy Agency,<br />
Vienna.<br />
<strong>ICRP</strong> (International Commission on Radiological Protection). 1965. Principles of<br />
Environmental Monitoring Related to the Handling of Radioactive Materials. <strong>ICRP</strong><br />
Publication 7.<br />
<strong>ICRP</strong>. 1985. Principles of Monitoring for the Radiation Protection of the Population. <strong>ICRP</strong><br />
Publication 43, Ann. <strong>ICRP</strong> 15 (1).<br />
<strong>ICRP</strong>. 1991. 1990 Recommendations of the International Commission on Radiological<br />
Protection. <strong>ICRP</strong> Publication 60, Ann. <strong>ICRP</strong> 21 (1–3).<br />
<strong>ICRP</strong>. 1993. Principles for Intervention for Protection of the Public in a Radiological<br />
Emergency. <strong>ICRP</strong> Publication 63, Ann. <strong>ICRP</strong> 22 (4).<br />
<strong>ICRP</strong>. 1996. Age-dependent Doses to Members of the Public from Intake of Radionuclides:<br />
Part 5 Compilation of Ingestion and Inhalation Dose Coefficients. <strong>ICRP</strong> Publication 72,<br />
Ann. <strong>ICRP</strong> 26 (1).<br />
<strong>ICRP</strong>. 2000a. Radiation Protection Recommendations as Applied to the Disposal of Long-<br />
23
Lived Solid Radioactive Waste. <strong>ICRP</strong> Publication 81, Ann. <strong>ICRP</strong> 28 (4).<br />
<strong>ICRP</strong>. 2000b. Protection of the Public in Situations of Prolonged Radiation Exposure. <strong>ICRP</strong><br />
Publication 82, Ann. <strong>ICRP</strong> 29 (1–2).<br />
<strong>ICRP</strong>. 2002. Doses to the Embryo and Foetus from Intakes of Radionuclides by the Mother.<br />
<strong>ICRP</strong> Publication 88, Ann. <strong>ICRP</strong> 31 (1–3).<br />
<strong>ICRP</strong>. 2005a. Recommendations of the International Commission on Radiological Protection.<br />
<strong>ICRP</strong> Publication XX.<br />
<strong>ICRP</strong>. 2005b. To be provided (Report on Optimisation).<br />
Lochard. 2004. To be provided.<br />
NCRP (National Council on Radiation Protection and Measurements). 1996. Screening<br />
Models for Releases of Radionuclides to Atmosphere, Surface Water, and Ground.<br />
National Council on Radiation Protection and Measurements, Bethesda, Maryland, U.S.A.<br />
NCRP Report No. 123 (1–2).<br />
Smith, K.R. and A.L. Jones. 2003. Generalised Habit Data for Radiological Assessments.<br />
Report NRPB-W41. National Radiological Protection Board, Chilton, U.K.<br />
Tscherlovits, M. and D. Beninson. 1983. “Statistical Characteristics of a Critical Group.”<br />
Radiat. Prot. Dosim. 4 (1): 33.<br />
24
APPENDIX A. ANALYSIS <strong>OF</strong> AGE CATEGORIES FOR USE <strong>IN</strong><br />
ASSESSMENT <strong>OF</strong> DOSE TO <strong>THE</strong> <strong>PUBLIC</strong><br />
A.1.<br />
Introduction<br />
(A1) The Commission has specified dose coefficients for the embryo/foetus and for six age<br />
groups in the population. This appendix investigates whether the number of age groups could<br />
be reduced to three for the purposes of assessing doses for comparison with the<br />
Commission’s dose constraint, particularly in prospective assessments (see section 3.4).<br />
These groups would be 0 to
many situations, however, this level of detail is not required, and it would be convenient to<br />
use a more limited range of dose coefficients. In deciding whether such a limited range of<br />
age-specific dose coefficients is appropriate for use in assessments of dose, it is important to<br />
consider the doses that arise from intakes of radionuclides by the different age groups in the<br />
population. Straightforward comparison of dose coefficients is not sufficient because the<br />
radiological criteria against which the results of the assessment would be compared are<br />
specified primarily in terms of dose per unit intake. Additionally, the intakes of radionuclides<br />
by different age groups will not be identical for the same foodstuffs because consumption<br />
rates differ between age groups. Therefore, for consumption of the same foodstuff by<br />
different age groups, the relative doses will depend not only on the values of the age-specific<br />
dose coefficient, but also on the age-specific consumption rates.<br />
(A6) This appendix examines the option of using a limited range of age-specific dose<br />
coefficients by calculating doses to three selected age groups in the population resulting from<br />
ingestion of radionuclides in foods using representative consumption rates. These results are<br />
compared with doses obtained using all six dose coefficients.<br />
A.3.<br />
Method<br />
(A7) Annual doses to the six age groups were separately calculated using unit<br />
concentrations of radionuclides in milk, green vegetables, beef, and air. The intake rates used<br />
are shown in Table A1. They are taken from Smith et al. (2003) and are derived from United<br />
Kingdom data. Consumption rate data for specific foodstuffs may vary from country to<br />
country, but such data usually follow the same general trends. For example, milk is consumed<br />
in higher rates by the young, and the rates for solid foods are highest for the adult. Thus, the<br />
overall conclusions from this analysis are expected to be generally applicable. Dose<br />
calculations were carried out for every radionuclide for which the Commission has published<br />
dose coefficients.<br />
A.4.<br />
Results<br />
(A8) The results for important radionuclides for each exposure pathway are given in Tables<br />
A2 to A5 as ratios. To establish whether the dose to a 1-year-old child can adequately<br />
represent the doses for the range of ages from 3 months to 5 years, the ratios of the 1-year<br />
dose to the 3-month dose, and the ratio of the 1-year dose to the 5-year dose are provided in<br />
the tables. Similarly, to establish whether the dose to a 10-year-old child can adequately<br />
represent the range from 6 years to 15 years, the ratio of the 10-year dose to the 15-year dose<br />
is also presented.<br />
(A9) The results show that the largest differences are observed for doses calculated using<br />
the 3-month dose coefficient, particularly for the milk pathway. This is largely because the 3-<br />
month dose coefficients are generally higher than for the other age groups, both because of<br />
the smaller body mass and, in many cases, because of the adoption of an increased f 1 value.<br />
The 3-month dose coefficients are, however, applicable to infants on all milk diets, which<br />
would be breast milk or formula milk. When infants are introduced to solid foods, the dose<br />
coefficients decrease progressively to the value for a 1-year-old. Therefore, the doses<br />
calculated for solid foods using the 3-month dose coefficients are considered to be unrealistic<br />
and may be ignored for the purposes of this assessment. Similarly, the doses for the milk<br />
A-2
pathway calculated using the 3-month dose coefficients are not likely to be relevant for the<br />
following reasons:<br />
• The radionuclides giving the highest doses via the milk pathway, which are the actinides<br />
(see Table A2), do not transfer readily to breast milk; thus, intakes of these radionuclides<br />
via other pathways by other age groups would be limiting.<br />
• Formula milk would not be made from cow’s milk taken solely from the geographical<br />
area affected by controlled releases of radionuclides, an area which tends to be limited in<br />
size. Rather, it would be derived from a much wider area so local pathways exposing<br />
other age groups would be limiting. Furthermore, the actinides do not transfer readily to<br />
cow’s milk.<br />
• It can be argued that formula milk could be reconstituted using local water that may be<br />
contaminated. Many radionuclides, however, do not transfer readily to drinking water<br />
due to the various natural and artificial filtration processes that apply to drinking water.<br />
(A10) It should be noted, however, that in calculating doses for the infant resulting from<br />
intakes of radionuclides in mothers' milk, the 3-month dose coefficients are used for the six<br />
months prior to weaning, during which time the infant is assumed to be consuming mothers'<br />
milk.<br />
A.5.<br />
Conclusions<br />
(A11) The results for all radionuclides for which the Commission has published dose<br />
coefficients are summarised in Table A6. It can be seen that, with the exception of the milk<br />
pathway discussed above, the ratios are within factors of a few. Therefore, it can be<br />
concluded that, in many situations, the dose calculated for a 1-year-old can adequately<br />
represent doses in the age range 3 months to 5 years. Similarly, the dose to the 10-year-old<br />
can adequately represent the range from 6 years to 15 years.<br />
(A12) The use of a limited set of age-specific dose coefficients representing the infant (1-<br />
year-old dose coefficient), the child (10-year-old dose coefficient), and the adult is consistent<br />
with the likely availability of data on consumption rates. Specific consumption rate data for<br />
the six age groups for which the Commission has specified dose coefficients are unlikely to<br />
be generally available in most cases. Data on consumption rates for the three broad<br />
categories—infant, child, and adult—are more likely to be available. Doses for the six age<br />
groups, however, may be needed in dose reconstruction studies and in the planning for and<br />
response to accidents.<br />
A-3
A.6.<br />
References<br />
EU (European Union). 1996. Council Directive of the European Union Laying Down the<br />
Basic Safety Standards for the Protection of the Health of Workers and the General Public<br />
Against the Dangers Arising from Ionising Radiation.<br />
<strong>ICRP</strong>. 1989. Age-Dependent Doses to Members of the Public from Intake of Radionuclides:<br />
Part 1. <strong>ICRP</strong> Publication 56. Ann. <strong>ICRP</strong> 20(2).<br />
<strong>ICRP</strong>. 1993. Age-Dependent Doses to Members of the Public from Intake of Radionuclides:<br />
Part 2, Ingestion Dose Coefficients. <strong>ICRP</strong> Publication 67. Ann. of the <strong>ICRP</strong>. 23(3–4).<br />
Elsevier Science Ltd, Oxford.<br />
<strong>ICRP</strong>. 1995a. Age-Dependent Doses to Members of the Public from Intake of Radionuclides:<br />
Part 3, Ingestion Dose Coefficients. <strong>ICRP</strong> Publication 69. Ann. of the <strong>ICRP</strong>. 25(1).<br />
Elsevier Science Ltd, Oxford.<br />
<strong>ICRP</strong>. 1995b. Age-Dependent Doses to Members of the Public from Intake of Radionuclides:<br />
Part 4, Inhalation Dose Coefficients. <strong>ICRP</strong> Publication 71. Ann. of the <strong>ICRP</strong>. 25(3–4).<br />
Elsevier Science Ltd, Oxford.<br />
<strong>ICRP</strong>. 1996. Age-Dependent Doses to Members of the Public from Intake of Radionuclides:<br />
Part 5, Compilation of Ingestion and Inhalation Dose Coefficients. <strong>ICRP</strong> Publication 72.<br />
Ann. <strong>ICRP</strong> 26(1).<br />
<strong>ICRP</strong>. 2001. Doses to the Embryo and Foetus from Intakes of Radionuclides by the Mother.<br />
<strong>ICRP</strong> Publication 88. Ann. <strong>ICRP</strong> 31(1–3).<br />
<strong>ICRP</strong>. Doses to the Infant from Radionuclides in Mother’s Milk. (to be published)<br />
International Basic Safety Standards for Protection against Ionising Radiation and for the<br />
Safety of Radioactive Sources. 1996. Jointly sponsored by FAO, IAEA, ILO,<br />
OECD/NEA, PAHO, WHO, IAEA Safety Series No. 115. International Atomic Energy<br />
Agency, Vienna<br />
Smith, K. and A.L. Jones. 2003. Generalised Habit Data for Radiological Assessments.<br />
Chilton, NRPB-W41.<br />
A-4
Table A1. Habit data used in calculating the doses<br />
Green vegetable Beef consumption<br />
consumption rate rate<br />
(kg y -1 )<br />
(kg y -1 )<br />
Milk<br />
consumption<br />
rate<br />
(kg y -1 )<br />
Inhalation<br />
(m 3 h -1 )<br />
3 month 350 15 10 0.12<br />
1 year 320 30 20 0.22<br />
5 year 280 32.5 25 0.37<br />
10 year 240 35 30 0.64<br />
15 year 260 45 35 0.84<br />
Adult 240 80 45 0.92<br />
A-5
Table A2. Ratio of the doses from the ingestion of milk<br />
Radionuclide 1 year : 3 month 1 year : 5 year 10 year : 15 year<br />
H-3 0.69 1.77 1.18<br />
H-3 (organically<br />
0.91 1.88 1.25<br />
bound tritium)<br />
C-14 1.04 1.85 1.30<br />
Na-22 0.65 2.04 1.37<br />
Mg-28 1.07 2.16 1.54<br />
P-32 0.56 2.31 1.58<br />
S-35 (organic) 0.64 2.29 1.55<br />
K-42 0.54 2.29 1.47<br />
Ca-45 0.41 2.15 1.28<br />
Fe-59 0.30 1.98 1.40<br />
Co-60 0.46 1.82 1.29<br />
Ni-63 0.48 2.09 1.44<br />
Zn-65 0.41 1.89 1.31<br />
Se-75 0.59 1.79 1.79<br />
Sr-90 0.29 1.78 0.69<br />
Zr-95 0.60 2.13 1.46<br />
Nb-95 0.64 2.03 1.37<br />
Mo-99 0.58 2.22 1.34<br />
Tc-99m 0.59 2.06 1.42<br />
Ru-106 0.53 2.24 1.61<br />
Ag-110m 0.53 2.05 1.41<br />
Sb-125 0.51 2.05 1.38<br />
Te-127m 0.40 2.17 1.60<br />
I-131 0.91 2.06 1.41<br />
Cs-137 0.52 1.43 0.71<br />
Ba-133 0.26 1.82 0.58<br />
Ce-144 0.54 2.35 1.56<br />
Po-210 0.31 2.29 1.50<br />
Np-237 0.10 1.71 0.92<br />
Pu-239 0.09 1.45 1.04<br />
Am-241 0.09 1.57 1.02<br />
Cm-242 0.12 2.23 1.48<br />
A-6
Table A3. Ratio of the doses from the ingestion of green vegetables<br />
Radionuclide 1 year : 3 month 1 year : 5 year 10 year : 15 year<br />
H-3 1.50 1.43 0.99<br />
H-3 (organically<br />
2.00 1.52 1.06<br />
bound tritium)<br />
C-14 2.29 1.49 1.09<br />
Na-22 1.43 1.65 1.16<br />
Mg-28 2.33 1.75 1.30<br />
P-32 1.23 1.87 1.33<br />
S-35 (organic) 1.40 1.85 1.31<br />
K-42 1.18 1.85 1.24<br />
Ca-45 0.89 1.74 1.08<br />
Fe-59 0.67 1.60 1.18<br />
Co-60 1.00 1.47 1.08<br />
Ni-63 1.05 1.69 1.21<br />
Zn-65 0.89 1.52 1.11<br />
Se-75 1.30 1.45 1.51<br />
Sr-90 0.63 1.43 0.58<br />
Zr-95 1.32 1.72 1.23<br />
Nb-95 1.39 1.64 1.16<br />
Mo-99 1.27 1.79 1.13<br />
Tc-99m 1.30 1.67 1.19<br />
Ru-106 1.17 1.81 1.36<br />
Ag-110m 1.17 1.66 1.19<br />
Sb-125 1.11 1.66 1.17<br />
Te-127m 0.88 1.75 1.35<br />
I-131 2.00 1.66 1.19<br />
Cs-137 1.14 1.15 0.60<br />
Ba-133 0.56 1.47 0.49<br />
Ce-144 1.18 1.89 1.32<br />
Po-210 0.68 1.85 1.26<br />
Np-237 0.21 1.38 0.78<br />
Pu-239 0.20 1.17 0.88<br />
Am-241 0.20 1.26 0.86<br />
Cm-242 0.26 1.80 1.24<br />
A-7
Table A4. Ratio of the doses from the ingestion of beef<br />
Radionuclide 1 year : 3 month 1 year : 5 year 10 year : 15 year<br />
H-3 1.50 1.24 1.10<br />
H-3 (organically<br />
2.00 1.32 1.16<br />
bound tritium)<br />
C-14 2.29 1.29 1.20<br />
Na-22 1.43 1.43 1.27<br />
Mg-28 2.33 1.51 1.43<br />
P-32 1.23 1.62 1.47<br />
S-35 (organic) 1.40 1.60 1.44<br />
K-42 1.18 1.60 1.37<br />
Ca-45 0.89 1.51 1.19<br />
Fe-59 0.67 1.39 1.30<br />
Co-60 1.00 1.27 1.19<br />
Ni-63 1.05 1.46 1.33<br />
Zn-65 0.89 1.32 1.22<br />
Se-75 1.30 1.25 1.66<br />
Sr-90 0.63 1.24 0.64<br />
Zr-95 1.32 1.49 1.36<br />
Nb-95 1.39 1.42 1.27<br />
Mo-99 1.27 1.56 1.24<br />
Tc-99m 1.30 1.44 1.32<br />
Ru-106 1.17 1.57 1.50<br />
Ag-110m 1.17 1.44 1.31<br />
Sb-125 1.11 1.44 1.29<br />
Te-127m 0.88 1.52 1.49<br />
I-131 2.00 1.44 1.31<br />
Cs-137 1.14 1.00 0.66<br />
Ba-133 0.56 1.27 0.54<br />
Ce-144 1.18 1.64 1.45<br />
Po-210 0.68 1.60 1.39<br />
Np-237 0.21 1.20 0.86<br />
Pu-239 0.20 1.02 0.96<br />
Am-241 0.20 1.10 0.94<br />
Cm-242 0.26 1.56 1.37<br />
A-8
Table A5. Ratio of the doses from inhalation<br />
Radionuclide Lung 1 year : 3 month 1 year : 5 year 10 year : 15 year<br />
absorption<br />
rate<br />
H-3 (tritium<br />
F 1.41 1.08 1.06<br />
compounds)<br />
H-3 (tritium<br />
M 1.46 1.15 1.18<br />
compounds)<br />
H-3 (tritium<br />
S 1.53 0.94 1.03<br />
compounds)<br />
H-3 (Inhalation of<br />
1.83 0.93 1.02<br />
organically bound<br />
tritium)<br />
C-14 F 2.01 1.11 1.16<br />
C-14 M 1.46 0.98 0.85<br />
C-14 S 1.64 0.92 0.88<br />
Na-22 F 1.38 1.14 1.22<br />
Mg-28 F 1.63 1.27 1.36<br />
Mg-28 M 1.81 1.22 1.17<br />
P-32 F 1.15 1.39 1.40<br />
P-32 M 1.25 1.11 1.01<br />
S-35 (Inhalation of<br />
1.29 1.15 1.23<br />
sulphur dioxide)<br />
S-35 (Inhalation of<br />
1.28 1.19 1.24<br />
carbon disulphide)<br />
K-42 F 1.15 1.35 1.32<br />
Ca-45 F 0.96 1.27 1.00<br />
Ca-45 M 1.34 0.99 0.85<br />
Ca-45 S 1.47 0.99 0.84<br />
Fe-59 F 1.13 1.09 1.23<br />
Fe-59 M 1.32 0.98 0.91<br />
Fe-59 S 1.40 0.95 0.87<br />
Co-60 F 1.41 0.98 1.11<br />
Co-60 M 1.48 0.96 0.95<br />
Co-60 S 1.71 0.87 0.90<br />
Ni-63 (Inhalation<br />
1.54 0.99 1.04<br />
of nickel carbonyl)<br />
Ni-63 F 1.59 1.08 1.11<br />
Ni-63 M 1.39 1.03 1.01<br />
Ni-63 S 1.64 0.95 1.00<br />
Zn-65 F 1.22 1.04 1.16<br />
Zn-65 M 1.40 1.04 0.96<br />
Zn-65 S 1.62 0.91 0.92<br />
Se-75 F 1.41 1.05 1.59<br />
Se-75 M 1.53 1.07 1.00<br />
Se-75 S 1.54 0.96 0.95<br />
Sr-90 F 0.73 1.00 0.59<br />
A-9
Sr-90 M 1.34 1.01 0.78<br />
Sr-90 S 1.75 0.88 0.86<br />
Zr-95 F 1.68 1.02 1.14<br />
Zr-95 M 1.47 0.98 0.88<br />
Zr-95 S 1.45 0.94 0.87<br />
Nb-95 F 1.39 1.15 1.22<br />
Nb-95 M 1.40 1.00 0.88<br />
Nb-95 S 1.40 0.97 0.87<br />
Mo-99 F 1.36 1.31 1.38<br />
Mo-99 M 1.34 1.19 1.04<br />
Mo-99 S 1.28 1.19 1.08<br />
Tc-99m F 1.33 1.26 1.22<br />
Tc-99m M 1.40 1.15 1.08<br />
Tc-99m S 1.41 1.14 1.07<br />
Ru-106 (Inhalation<br />
1.26 1.07 1.28<br />
of ruthenium<br />
tetroxide)<br />
Ru-106 F 1.38 1.23 1.33<br />
Ru-106 M 1.44 1.02 1.01<br />
Ru-106 S 1.62 0.98 0.98<br />
Ag-110m F 1.47 1.11 1.17<br />
Ag-110m M 1.47 0.98 0.99<br />
Ag-110m S 1.63 0.94 0.91<br />
Sb-125 F 1.43 1.09 1.17<br />
Sb-125 M 1.47 0.95 0.89<br />
Sb-125 S 1.66 0.94 0.87<br />
Te-127m<br />
1.28 1.16 1.25<br />
(Inhalation of<br />
tellurium vapour)<br />
Te-127m F 1.22 1.28 1.33<br />
Te-127m M 1.36 1.03 0.91<br />
Te-127m S 1.48 0.98 0.89<br />
I-131 (Inhalation<br />
1.83 1.04 1.17<br />
of methyl iodide)<br />
I-131 (Inhalation<br />
1.73 1.01 1.18<br />
of elemental iodine<br />
vapour)<br />
I-131 F 1.83 1.16 1.32<br />
I-131 M 1.25 1.09 1.05<br />
I-131 S 1.29 1.05 0.91<br />
Cs-137 F 1.13 0.89 0.64<br />
Cs-137 M 1.48 0.96 0.90<br />
Cs-137 S 1.67 0.85 0.87<br />
Ba-133 F 0.75 1.03 0.47<br />
Ba-133 M 1.22 0.93 0.71<br />
Ba-133 S 1.66 0.86 0.90<br />
Ce-144 F 1.38 1.15 1.24<br />
Ce-144 M 1.54 1.08 1.02<br />
A-10
Ce-144 S 1.57 0.97 0.96<br />
Po-210 F 1.19 1.30 1.29<br />
Po-210 M 1.34 0.98 0.88<br />
Po-210 S 1.43 0.97 0.88<br />
Np-237 F 1.74 0.92 0.81<br />
Np-237 M 1.67 0.85 0.76<br />
Np-237 S 1.59 0.91 0.82<br />
Pu-239 F 1.75 0.79 0.83<br />
Pu-239 M 1.76 0.76 0.78<br />
Pu-239 S 1.66 0.86 0.85<br />
Am-241 F 1.83 0.89 0.83<br />
Am-241 M 1.73 0.80 0.76<br />
Am-241 S 1.59 0.88 0.85<br />
Cm-242 F 1.43 1.25 1.16<br />
Cm-242 M 1.50 0.97 0.87<br />
Cm-242 S 1.45 0.94 0.86<br />
Table A6. Minimum and maximum ratios for the pathways for all radionuclides<br />
Pathway Ratio Minimum ratio Maximum ratio<br />
Ingesting milk 1 year : 3 month 0.08 1.62<br />
1 year : 5 year 1.14 2.51<br />
10 year : 15 year 0.49 3.15<br />
Ingesting green 1 year : 3 month 0.18 3.54<br />
vegetables<br />
1 year : 5 year 0.92 2.03<br />
10 year : 15 year 0.41 2.66<br />
Ingesting beef 1 year : 3 month 0.18 3.54<br />
1 year : 5 year 0.80 1.76<br />
10 year : 15 year 0.46 2.93<br />
Inhalation<br />
1 year : 3 month 0.55 2.51<br />
1 year : 5 year 0.54 1.65<br />
10 year : 15 year 0.41 2.84<br />
A-11
APPENDIX B. DETERM<strong>IN</strong><strong>IN</strong>G COMPLIANCE WHEN DOSE TO <strong>THE</strong><br />
<strong>PUBLIC</strong> IS ESTIMATED PROBABILISTICALLY<br />
B.1.<br />
Introduction<br />
(B1) When dose to the public is estimated probabilistically and uncertainties are taken into<br />
account, a distribution of possible doses is the result. It is likely that the use of probabilistic<br />
methods will become more frequent in the future as improvements in technology improve the<br />
ability to account for uncertainties inherent in any estimation of dose. It is also expected that<br />
probabilistic methods will become more widespread as the techniques in their application<br />
become more familiar to regulators, operators, and stakeholders. Therefore, the Commission<br />
needs to provide guidance on the use of a distribution of dose rather than a deterministic<br />
(point) estimate of dose for the purpose of determining compliance. This appendix provides a<br />
discussion of distributions of dose resulting from probabilistic assessments.<br />
(B2) It is not within the Commission’s scope to prescribe how doses may be estimated<br />
probabilistically. Many different methods exist. With some distributions of dose, it is<br />
possible that doses on the extreme high end of the distribution are well below the dose<br />
constraint set by the Commission. In this case, it can be readily determined that compliance<br />
exists. However, it is also possible that a probabilistic assessment results in doses on the high<br />
end of the distribution that exceed the dose constraint set by <strong>ICRP</strong>. Further guidance is<br />
needed to address this situation to be sure that members of the public are protected in<br />
accordance with the Commission’s dose constraint.<br />
(B3) In considering probabilistic assessments of dose, it is important to distinguish whether<br />
the distribution of dose is retrospective or prospective, whether dose is for hypothetical<br />
individuals or specific individuals, and whether the doses are from planned or existing<br />
situations. Prospective exposures to hypothetical individuals may be for planned or existing<br />
situations. Retrospective exposures apply to specific individuals for existing (or formerly<br />
existing) exposure situations. The next section addresses these situations.<br />
B.2.<br />
Retrospective and prospective dose for specific and hypothetical<br />
individuals<br />
(B4) Methods of carrying out a risk assessment for a radiological source and interpretation<br />
of the results vary according to whether the effects were realised in the past (retrospective<br />
assessment) or are contemplated for the future (prospective assessment). A prospective<br />
assessment might be applied to a newly designed system, apparatus, or facility, or to future<br />
operation of an existing source. Similar mathematical and probabilistic techniques may be<br />
used in either temporal frame, but the questions that the analyses seek to answer are usually<br />
different.<br />
(B5) Retrospective assessments may apply to past acute exposures or to chronic exposures<br />
over an extended period in the past. They may seek to provide dose and risk estimates to<br />
support epidemiological investigations in the exposed population. They may also provide<br />
information to decision makers concerning remediation of contaminated spaces or<br />
compensation of individuals with claims of health or property damage. In such cases, the<br />
exposures have already been incurred (and in some cases may be continuing). In principle,<br />
the exposed individuals are identifiable and their doses may be reconstructed, though<br />
B-1
possibly from fragmentary and uncertain information. The exposed individuals are specific<br />
individuals, and the resulting estimates may be provided in the context of probabilistic<br />
uncertainty analysis. Components of such analysis might include uncertainties concerning<br />
sources, transport of effluents through the environment, and concentrations of released<br />
radioactive material over time in the environmental media to which people were exposed.<br />
Other components of uncertainty might relate to data on individual habits that would affect<br />
the estimates (e.g., times spent in contaminated locations, quantities of contaminated food<br />
that might have been consumed, and ages at the times of particular exposures). Such<br />
information might need to be gathered from surveys designed and analysed by specialists,<br />
and uncertainties in the survey results would be based on their analysis. Uncertainties in the<br />
doses and risks would be affected by both of these components (source-environment and<br />
individual habits.<br />
(B6) Distributions of dose to specific individuals in retrospective assessments serve a<br />
number of purposes. Primarily, they are used in epidemiological studies or to inform decision<br />
makers whether action is warranted to further reduce exposures if the source continues to<br />
exist. Since retrospective doses have already occurred, they are generally not within the<br />
scope of the Commission, although the Commission’s recommendations may provide a<br />
useful guideline for their evaluation.<br />
(B7) Prospective assessments often aim to assist in answering questions related to siting<br />
and design of planned facilities and to compliance with regulations. In such cases the<br />
exposed population may be unknown, and the analysis must be based on numerous<br />
assumptions. In this connection, the concept of a hypothetical representative individual can<br />
provide guidance in preliminary assessments based on tentative design, location, and<br />
operational assumptions. Such a hypothetical representative individual would be defined by<br />
an exposure scenario based on locations, physical characteristics, and habits that individually<br />
would be reasonably expected possibilities for some individuals in the exposed population.<br />
However, the locations, physical characteristics, and habits of the hypothetical representative<br />
individual should not collectively correspond to extreme combinations that are almost certain<br />
not to be found in the exposed population. When the analysis is applied to present and future<br />
operation of an existing facility, the present exposed population should be known, and it<br />
should be possible to investigate the existence of potentially high doses. In this case, too,<br />
analysis of the habits of a hypothetical individual can be adapted to provide first-order<br />
operational guidance, subject to adjustment if critical groups are identified or if conditions<br />
exist that produce some doses above the Commission’s dose constraint for the public. As<br />
defined earlier by the Commission, a critical group is at least a few tens of exposed<br />
individuals with common attributes (some combination of habits, physical characteristics,<br />
and location, but possibly not all of these) that contribute to an estimate of average dose to<br />
the group that is used as the basis for compliance with the dose constraint. Such a<br />
homogeneous group might be identified if a sufficient number of people (a few tens, as<br />
indicated) were found to be consuming substantial quantities of fish that they regularly<br />
caught from a radioactivity-contaminated stream. Continuing attention by the operator to<br />
public concerns is an essential part of the information flow that can identify potential critical<br />
groups and conditions that might require operational response.<br />
(B8) Uncertainty analysis of prospective assessments should be distinguished from its<br />
counterpart in retrospective assessments. The hypothetical representative individual is not a<br />
real member of the exposed population and may not resemble any specific individual, but<br />
B-2
ather is a mathematical construct for defining a criterion for operational guidance. It is based<br />
on assumptions that would correspond to a possible dose that is expected to be high relative<br />
to doses estimated for most of the population. It is possible that this potential dose is not<br />
realised at all in the real exposed population. Therefore, it is important to distinguish<br />
uncertainties associated with the source and the environment (which are real) from ranges of<br />
values assigned by analysts to parameters that define the hypothetical individual (e.g.,<br />
breathing rate, age, dietary habits, and fractions of time spent in specified exposure<br />
situations).<br />
(B9) Ranges of variation in these variables for the hypothetical individual do not constitute<br />
uncertainty distributions; rather, the variables are parameters to be set by the analyst. When<br />
ranges of these variables are combined probabilistically with uncertainty distributions that<br />
represent releases from the source and the transport and concentrations in environmental<br />
media of the released radioactivity, interpretation of the composite distribution of artificial<br />
ranges and real uncertainties is not straightforward. The hypothetical individual cannot<br />
reasonably be interpreted as a random individual chosen from the affected population. It<br />
seems preferable to specify fixed central or slightly conservative values for the parameters<br />
that define the hypothetical individual, leaving the final uncertainty distribution of dose to<br />
reflect only the real source and environmental uncertainties. If it is necessary to study the<br />
sensitivity of potential dose to the hypothetical parameters, multiple dose distributions might<br />
be generated, with each one corresponding to a parameter point of interest for the<br />
hypothetical individual. Such an exercise might indicate the behaviour of a high percentile<br />
(possibly the 95 th ) of the potential dose distribution and indicate combinations of the<br />
hypothetical individual’s parameters to which the potential dose shows the greatest<br />
sensitivity. This kind of approach helps avoid confusion of the interpretations of sensitivity to<br />
hypothetical parameters and uncertainty associated with real quantities.<br />
B.3.<br />
Distributions related to dose<br />
(B10) In the analysis of dose to individuals and populations, the concept of a distribution<br />
arises in two primary contexts, with extension to a third:<br />
(1) When uncertainty is considered in estimates of dose to individuals that are derived<br />
from model calculations or contamination measurements, the weighting of a dose<br />
distribution is usually interpreted as probability, so that one may make statements such<br />
as, “The probability that the annual dose to the specified individual does not exceed 1<br />
mSv is 0.95 (or 95%).” Such distributions assign probability weight to intervals of dose,<br />
and the distribution quantifies the analyst’s perception of the uncertainty that affects the<br />
estimate. This type of distribution might be useful in connection with the hypothetical<br />
individual as defined in paragraph (B7) above.<br />
(2) When (deterministic) point estimates of dose are made for all individuals of an<br />
exposed population (or for categories of exposure with numbers of individuals known or<br />
estimated for each category), the weighting of each dose interval may be the fraction of<br />
the total exposed population receiving a dose within that interval. Such a distribution<br />
could be used to estimate the fraction of the exposed population whose annual dose does<br />
not exceed some specified level, such as 1 mSv; or it could be used to estimate the annual<br />
dose that is not exceeded in 95% of the population (i.e., the 95 th percentile of the<br />
distribution). Dose distributions of this type could be useful in quantifying dose limitation<br />
guidance that is to be applied to “the vast majority of the population.”<br />
B-3
(3) When the distribution types (1) and (2) above are combined, a weighting scheme<br />
replaces the point estimate of dose to each individual in item (2) with a marginal<br />
probability distribution that expresses the uncertainty of dose to the individual, given the<br />
individual’s exposure conditions. The distribution representing the aggregate population<br />
would need to be interpreted as probability of dose to a randomly chosen member of the<br />
exposed population. The uncertainty distributions associated with individuals would be<br />
marginal relative to a rather complex joint distribution of exposure and dose, taking into<br />
account relevant correlations for factors such as location and common influence of<br />
sources of released radioactivity. Distributions of this kind, combined with risk estimates,<br />
could be useful in estimating the number of health effects arising from the collective<br />
dose.<br />
(B11) Distributions are estimated from theory or data, assumed on the basis of experience,<br />
or assumed generically (i.e., somewhat arbitrarily, but of a form considered reasonable). In<br />
retrospective studies, where dose has been received by specific people and some records exist<br />
for reconstruction, one would expect to have available or to develop a database supporting a<br />
distribution of type (2) above for information on the population and exposure factors. The<br />
difficulty is that information may be fragmentary and uncertain for exposed individuals, and<br />
the environmental processes that contributed to the exposures must be reconstructed with<br />
some combination of historical data assessment and mathematical modelling. Thus, elements<br />
of the type (3) distribution become important. Where modelling of the source-term and<br />
environmental transport is used, it may be necessary to introduce uncertainties into the<br />
structure and parameters of the models in order to estimate uncertainty propagation into<br />
exposure and dose. The mechanism for representing the uncertainties in the source-term and<br />
environmental transport usually takes the form of probability distributions that substitute for<br />
parameters in the models.<br />
(B12) Proposed distributions may be based on measurements—authentic data are used when<br />
such measurements exist for relevant times, locations, and processes, but often surrogate data<br />
based on other times or locations must be used. In either case, one has the choice of using an<br />
empirical distribution, based directly on a histogram of the data, or a theoretical distribution,<br />
which is an idealization of the histogram, probably represented as a continuous curve. The<br />
mathematical form of a theoretical distribution is an assumption based on theory or<br />
experience (and usually convenience), possibly supported by a demonstration of its<br />
consistency with the relevant data. If the data are too fragmentary to be suggestive of a<br />
theoretical distribution type, the assumption is generic; common choices for distributions that<br />
represent environmental data are normal and lognormal distributions, but others are possible<br />
and may be practical. Sometimes theory is suggestive of the standard distributions in a given<br />
case; or a trend of the data may indicate a form of theoretical distribution, even in the absence<br />
of a theoretical justification for it, in which case the choice is considered empirical.<br />
(B13) In a prospective assessment of dose to members of an exposed population, the<br />
population is usually hypothetical, although it may be based on a real population that exists at<br />
the time of the study (one must remember, however, that this population will change in<br />
unknown ways during the future of the exposure). The purpose could be to assess the effect<br />
of the location or design of a proposed power plant or other nuclear facility, or it could be to<br />
study the effects of future management of an existing source (e.g., contaminated land). In<br />
such a prospective study, the uncertainties related to the source term and environmental<br />
B-4
transport of released radioactivity (as previously discussed) are applicable, whereas<br />
individual detail about members of the population are not available (except as assumptions or<br />
extrapolations based on a population existing at the time of the study). The purpose is to<br />
assure that the dose constraint is unlikely to be exceeded.<br />
(B14) To this end, it is important to evaluate and understand exposure scenarios for<br />
hypothetical individuals that would lead to high doses relative to the majority of the<br />
population. Limitation of the dose to such a hypothetical representative individual assures the<br />
protection of most of the population. One could consider a type (1) probability distribution of<br />
annual dose to the hypothetical individual, given the exposure scenario, with uncertainty<br />
components due only to the source term and environmental transport. For example, one might<br />
determine by reference to the distribution that the annual dose to the hypothetical individual<br />
would exceed 0.3 mSv with only 2% probability, given the exposure scenario. If the exposure<br />
scenario is accepted as being at the upper margin of normal habits and characteristics but not<br />
extreme, such a conclusion would imply protection of most of the population. In such an<br />
exercise, it would be useful to consider only fixed exposure scenarios (i.e., any parameters<br />
such as breathing rates or frequencies associated with habits of the individual should be given<br />
fixed but possibly conservative values); attempts to introduce probability distributions into<br />
the exposure scenarios and combine them with uncertainty components associated with the<br />
source term and environmental transport may produce results that are more difficult to<br />
interpret and possibly misleading.<br />
(B15) A type (2) distribution of dose (population weighted) may be derived for the<br />
hypothetical population of a prospective study, but the information in the distribution is<br />
limited by the detail contained in the definition of the population and the methods of<br />
estimating dose to different categories of individuals (i.e., exposure scenarios). For example,<br />
if one were considering only exposure to airborne radioactivity from a point source, and the<br />
spatial distribution of the population were marked out in 1-km radial increments of 16 wind<br />
sectors, with the number of individuals residing in each 1-km by 22.5-degree sub-region<br />
beyond 1 km, out to 15 km from the source, then with source-term data (or a model of the<br />
release) and an atmospheric transport model, it is possible to estimate a ground-level air<br />
concentration of each released radionuclide in each sub-region (assuming, for simplicity, that<br />
there is only one radionuclide in the release). The crudest level of exposure scenarios<br />
assumes that there is a uniform average breathing rate, that there is no mobility of population<br />
among sub-regions, and that any difference between indoor and outdoor air concentrations is<br />
to be neglected. The sub-region point estimates (assumed to be local averages) are the<br />
product of the annual release (Bq), the diffusion factor for the centre of the sub-region<br />
(sometimes called χ/Q or “chi-over-Q”, s m -3 ), the breathing rate (m 3 s -1 ), and the dose<br />
coefficient for inhalation dose (Sv Bq -1 ). It is then possible to construct the populationweighted<br />
distribution by tabulating the estimated sub-region averages of dose from smallest<br />
to largest, along with the population numbers for the respective sub-regions. For many<br />
purposes, it is useful to normalise the distribution by dividing the tabulated population<br />
number for each sub-region by the total number of individuals in the exposed population.<br />
(B16) A similar exercise to the one described in the preceding paragraph leads to a<br />
distribution of type (3) when uncertainties for the source term and χ/Q are considered. The<br />
interpretation of such a type (3) distribution would involve statements such as, “The<br />
probability is less than 2% that a person drawn at random from the hypothetical population<br />
will receive an annual dose exceeding 0.3 mSv.” The reader should recall the earlier remark<br />
B-5
that the calculations underlying a type (3) distribution may be of greater utility than the<br />
distribution itself. The reason for the suggested omission is that for the simulation considered<br />
in Example (2), there is no point in considering the joint distribution; it would only be used if<br />
a collective risk analysis were undertaken for the population (i.e., number of health effects<br />
occurring), and risk models with age dependence and latency periods were applied.<br />
B.4.<br />
Specific forms of dose distributions<br />
(B17) Appropriate assumption of a mathematical form for a distribution arising in the<br />
context of environmental dose assessment depends on the role that the distribution is<br />
intended to play in the analysis. It is emphasized that there is nearly always an element of the<br />
analyst’s experience and judgment that influences the choice; indeed, the success of the<br />
undertaking depends on the availability of experienced and skilled personnel to plan and<br />
carry out the quantitative analysis. The subject is embedded in decades of statistical and<br />
computational theory and practice, of which no summary can be attempted here.<br />
(B18) At the most specialized level, there are distributions that represent parameters in<br />
models of the source term and the environmental transport of the released radionuclides. The<br />
complexity of the models usually dictates Monte Carlo methods for simulating the<br />
propagation of uncertainties into estimates of concentrations in exposure media (e.g., air, soil,<br />
food, water). There can be dozens, if not hundreds, of such parameters, some of which<br />
depend on primary or surrogate data from source-term related processes, on estimates of<br />
uncertainty in diffusion model predictions of air concentrations of released materials, or on<br />
samples from exploratory wells that monitor groundwater. For some parameters, the literature<br />
provides guidance; for others, the analyst must make the case in the context of the study.<br />
(B19) Transport models are often empirically tuned to environmental measurements, and in<br />
such cases the parameters may be less literally representative of directly observed quantities.<br />
Instead, distributions of the parameters may be inferred by regression methods from residuals<br />
that are computed as the difference of model predictions and corresponding measurements of<br />
the modelled quantity (e.g., concentration of a radionuclide in air or soil). In such a setting,<br />
the residuals (or some transformed version of them) are often (but not always) treated as a<br />
sample from a normal distribution with zero mean and variance to be determined by the<br />
regression; this choice is sometimes suggested by the theoretical background of the<br />
regression method. The process is somewhat complex, but the results can be quite powerful<br />
and persuasive. The models are often nonlinear in the parameters under study, and the subject<br />
appears in the literature under the name “nonlinear parameter estimation.”<br />
(B20) Sets of environmental data are often presented in a discussion of an existing facility.<br />
It is usual to summarize such a data set with reference to a distribution, from which the data<br />
are construed as a random sample, though the actual acquisition procedure may not be<br />
consistent with this characterisation. Perhaps the most common assumption for legacy data is<br />
that of the normal distribution, and the assumption may be used to present confidence<br />
intervals for the mean (which if done by traditional textbook methods would also involve the<br />
“student” t distribution). The normal distribution necessarily assigns probability<br />
symmetrically to semi-infinite negative and positive intervals, and this property can present<br />
awkward problems of physical interpretation where physically positive quantities are<br />
concerned. It is also the case that histograms of primary data often lack the symmetry that<br />
characterises the normal distribution. One approach attempts to get around these problems by<br />
using truncated forms of the normal distribution (i.e., one or both tails of the distribution are<br />
B-6
taken off at specified points). The truncated distribution may give a better fit to the data, but<br />
it unfortunately loses much of the mathematical tractability of the un-truncated distribution.<br />
(B21) A common theoretical paradigm for skewed distributions is the lognormal<br />
distribution: a random variable y is said to be lognormally distributed if its natural logarithm<br />
ln y is normally distributed, and the distribution can be thought of as arising from a<br />
transformation of the primary data (all of which must be positive) by taking the natural<br />
logarithm and applying the normal distribution. Many skewed distributions, however, are not<br />
well fitted by the lognormal distribution, and when the sample size is sufficient, it is<br />
sometimes argued that an empirical distribution based directly on the data is the most<br />
satisfactory representation. If a distribution represented by a smooth frequency curve is<br />
required for mathematical or other convenience, and if direct application of the standard<br />
distributions must be ruled out, it is usually possible for an experienced practitioner to fit an<br />
empirical frequency curve with the desired properties to the frequency histogram (It is<br />
possible that the cumulative representation may be used for fitting).<br />
B.5.<br />
Normal distribution and central limit theorem<br />
(B22) The Central Limit Theorem is usually cited as a principal justification for the ubiquity<br />
of the normal distribution in observational science. In a very rough form, the Central Limit<br />
Theorem states that under appropriate hypotheses, the sequence of probability distributions of<br />
the standardized sums of an infinite sequence of independent random variables { x } ∞ i i=1<br />
tends<br />
to the standard normal distribution:<br />
⎡ n<br />
⎤<br />
⎢<br />
⎥<br />
⎢∑<br />
( xi<br />
− μi<br />
)<br />
⎥<br />
i=<br />
1 y 2<br />
1<br />
−t<br />
/ 2<br />
P⎢<br />
< y⎥<br />
→<br />
∫<br />
e dt as n → ∞<br />
n<br />
−∞<br />
⎢<br />
⎥ 2π<br />
2<br />
⎢ ∑σ<br />
i ⎥<br />
⎢⎣<br />
i=<br />
1 ⎥⎦<br />
where x i has mean μ i and standard deviation σ i . The integral expression after the arrow<br />
represents the cumulative probability distribution function of the standard normal<br />
distribution, evaluated at y. There are numerous references to studies of hypotheses under<br />
which this convergence is shown to be valid. Apart from those restrictions, the random<br />
variables { x } ∞ i i=1<br />
are not required to have any specified form of distribution, nor must all have<br />
the same form (Wilkes 1962).<br />
(B23) The Central Limit Theorem is usually invoked to support the claim that sums of<br />
environmental random variables, even for relatively small n, are approximately normally<br />
distributed. (However, the approximation may in some circumstances be poor, even for<br />
moderately large n.) The application of the Central Limit Theorem to the lognormal<br />
distribution uses the sequence of logarithmically transformed random variables{ ln x } ∞ i i=1<br />
.<br />
Since the lognormal distribution has become commonplace in environmental dose studies,<br />
the next section examines some theoretical support for processes that might lead to it in this<br />
and related fields.<br />
B.6.<br />
Occurrence of lognormal distribution<br />
B-7
(B24) Considerable discussion of the origin and applications of the lognormal distribution<br />
exists in scientific literature. See Aitchison and Brown (1969, Chapter 3) for examples and<br />
further references.<br />
(B25) A basic mathematical model that yields a lognormal distribution is a stochastic<br />
process satisfying the equation<br />
X k − X k−1 = ε k X k−1,<br />
k = 1,2, K<br />
(1)<br />
where the ε k are mutually independent and also independent of the X k preceding them in the<br />
sequence. If the process goes on for n steps, we may solve the recursion in Equation (1) to get<br />
X<br />
n<br />
= 1 + ε n ) X n−1 = (1 + ε n )(1 + ε n−1<br />
) X n−2<br />
= = (1 + ε n )(1 + ε n−1<br />
) L(1<br />
+ ε1)<br />
( L X . (2)<br />
0<br />
k<br />
If the ε k are sufficiently small in magnitude, we may use the approximation 1 + ε k ≈ e in<br />
Equation (2):<br />
⎛ n ⎞<br />
ε1 ε2<br />
ε n<br />
X = = ⎜ ⎟<br />
n X 0e<br />
e L e X 0 exp<br />
∑ε<br />
k . (3)<br />
⎝ k=<br />
1 ⎠<br />
Taking logarithms in Equation (3) gives<br />
n<br />
∑<br />
ln X n = ln X + ε , (4)<br />
0<br />
a sum of independently distributed random variables, which by the Central Limit Theorem is<br />
asymptotically normally distributed (i.e., tends to a normal distribution as n tends to infinity,<br />
as indicated in the previous section), so that the distribution of X n approaches lognormality. If<br />
the index k marks a series of time steps, the model of Equation (1) could represent a process<br />
of growth of an organism resulting from a variety of independent multiplicative effects<br />
represented by the ε k . In such an interpretation, X n could represent, for example, the mass,<br />
height, or some other physical property of the organism after n steps in its growth. In the<br />
abstract, the time step is arbitrary; it could represent seconds or years, depending on the<br />
context. The model of Equation (1) could also represent a sum of money invested at<br />
compound interest at a rate per time step that varies with random changes in the economy<br />
(for example, if the index k counts years, the ε k would represent annual interest rates).<br />
Forecasts of the value of the investment after, say, n = 30 years, would reasonably be<br />
modelled as being lognormally distributed. In other applications, the index k could count<br />
effects unrelated to time.<br />
(B26) The lognormal distribution has been found useful in the field of aerosol physics in<br />
applications to particle size. Indeed, in discussions of properties relative to particle size, the<br />
lognormal distribution seems to be the generic assumption. Aitchison and Brown (1969)<br />
present a breakage model that seems relevant to certain populations of particles. They<br />
consider abstract elements (e.g., particles), each having a positive dimension (e.g., mass or<br />
effective diameter). The population is subjected to a series of independent operations having<br />
as their effect the random breakage of the elements.<br />
(B27) A more specific particle model is considered here: a binary process in which at each<br />
breakage stage, each particle is severed into exactly two pieces, one of which is a “small”<br />
part of the original. Assume that the original population of particles is of homogeneous<br />
density and that the quantity of interest is the mass of the particle. The “small” fraction is<br />
k=<br />
1<br />
k<br />
ε<br />
B-8
estricted to no more than a fixed fraction ϕ, which is less than 0.5 (in this illustration, ϕ is<br />
equal to 0.125). The random value of the small fraction is selected from a uniform<br />
distribution of numbers between 0 and ϕ (excluding zero). The complementary fraction<br />
represents the larger part.<br />
(B28) If a particle is chosen at random from breakage stage n, it has a unique ancestry of<br />
particles leading back to some particle P 0 in the original population. Thus, its mass can be<br />
derived from that of P 0 as a sequence of multiplications by independent random factors:<br />
mass ( P ) = mass( P η η Lη<br />
, (5)<br />
n<br />
0 )<br />
1<br />
2<br />
n<br />
where the η k are identically and independently distributed,<br />
η k<br />
⎧ζ<br />
with probability 0.5<br />
= ⎨<br />
⎩1<br />
− ζ with probability 0.5<br />
and the random variable ζ is uniformly distributed on the interval (0, 0.125] (zero is<br />
excluded, 0.125 is not). The probabilities of 0.5 reflect the fact that a particle in stage k may<br />
equally likely be the smaller or the larger part resulting from breakage of the parent (stage<br />
k−1) particle. Thus, from Equation (5)<br />
( mass( Pn<br />
)) ln( mass( P0 )) + lnη0<br />
+ lnη<br />
+ + lnηn<br />
ln = 1 L , (6)<br />
The Central Limit Theorem is used to conclude that the logarithm of the mass of P n is<br />
asymptotically normally distributed, so that the mass of P n is asymptotically lognormally<br />
distributed. Figure B-1 shows log-probability distributions for the first five and the 10 th<br />
stages of breakage, beginning with an initial population of particles with masses selected at<br />
random from the uniform distribution over the interval (0,1). The near-linear graph for the<br />
10 th stage suggests the approach of the stages of breakage to lognormality. These<br />
distributions were obtained by Monte Carlo simulations with the model just described, using<br />
200 trials for each stage.<br />
B-9
Particle mass<br />
0.1<br />
0.01<br />
0.001<br />
0.0001<br />
10 −5<br />
10 −6<br />
10 −7<br />
10 −8<br />
10 −9<br />
10 −10<br />
10 −11<br />
10 −12<br />
1 5 10 20 30 40 50 60 70 80 90 95 99<br />
Cumulative frequency (%)<br />
Initial population (uniform)<br />
1st stage<br />
2nd stage<br />
3rd stage<br />
4th stage<br />
5th stage<br />
10th stage<br />
Figure B-1. Sequence of asymmetric binary breakages of particles, beginning with a<br />
uniformly distributed population, with mass distribution between 0 and 1. Distributions<br />
represent particle masses. The mass of the smaller member of a severed pair has the<br />
uniform distribution (0, 0.125). The tendency toward linearity at the 10 th stage is<br />
suggestive of the effect of the Central Limit Theorem.<br />
Such a model as the one just illustrated might be applicable to weathering of some types of<br />
soils.<br />
(B29) Another type of particle model is that of a particle population formed by<br />
agglomeration of small particles onto larger condensation nuclei. Such a process could be<br />
interpreted in the light of the model of Equation (1), provided the incremental particles are<br />
sufficiently small relative to the acquiring particles. In such cases, that model would lead to<br />
the conclusion of asymptotic lognormality of the population after a sufficient number of<br />
acquisitions.<br />
(B30) In reality, there are many effects that depart from the simple models suggested here<br />
and that thwart convergence to lognormality. It is sometimes found that a population of<br />
particles under investigation is more reasonably viewed as a mixture of two or more distinct<br />
subpopulations, which themselves are approximately lognormally distributed, but such as to<br />
render the super-population non-lognormal. For example, windborne particles may at times<br />
consist of sand (diameters of 10 to several hundred micrometers), clay and silt (diameters of<br />
less than one to some tens of micrometers), and fine particles such as combustion products<br />
(diameters of a few hundredths to a few tenths of a micrometer). These distinct<br />
subpopulations (which individually are sometimes reasonably approximated as lognormally<br />
distributed) usually do not combine into an aggregate with a distribution that resembles a<br />
lognormal. Aerosol scientists often analyse particle size distributions with the lognormal<br />
distribution, but there are special cases that are not well fitted by the lognormal distribution<br />
and to which they apply special distributions. Some examples are certain coarse dusts (e.g.,<br />
B-10
crushed coal), sprays with large ranges of diameters, and certain powders (Hinds 1982,<br />
appendix to Chapter 4).<br />
(B31) Other quantities of interest are often sums of more fundamental variables, which<br />
themselves may or may not appear to be lognormally distributed. It is sometimes the case that<br />
a sum of lognormally distributed random variables has a distribution that can reasonably be<br />
approximated by a lognormal distribution, even though sums of lognormally distributed<br />
random variables are known (mathematically) not to be lognormally distributed. This is a<br />
special case of a more general phenomenon, where plotting a dataset of interest suggests that<br />
the data resulted from sampling a lognormal distribution, even though no known theory<br />
points to such a conclusion. Nevertheless, it is common practice to model skewed empirical<br />
distributions generically with the lognormal, even when nothing but experience indicates<br />
such a choice.<br />
(B32) Radiation dose or risk to a specific human population may sometimes fit into the<br />
empirically lognormal category just described (e.g., distributions of type (1), (2), or (3)<br />
discussed previously). There are many ways such a distribution may be arrived at, but few of<br />
them obviously imply lognormality, notwithstanding log-probability plots suggesting a linear<br />
trend. It is fairly easy to construct simple examples of dose distribution to a population<br />
downwind from a release point of airborne radioactivity that are not lognormally distributed<br />
with respect to population count (see Example 2 in the next section).<br />
B.7.<br />
Examples<br />
(B33) This section develops two relatively simple examples of the distribution types<br />
discussed in this appendix. Realistic examples would be a great deal more complicated than<br />
what is presented here, but the added detail might obscure the main points.<br />
(B34) Example 1: Type (1) distribution. A fictitious existing nuclear facility releases<br />
radionuclides to the atmosphere. Studies of data measured at air monitoring stations and<br />
comparisons with release estimates suggest a distribution for the boundary location where<br />
annual average air concentrations would be near-maximum. There is theory and evidence to<br />
indicate that the concentrations would tend to decrease as the distance from the facility<br />
increases. It would be reasonable to position a hypothetical individual at the maximum<br />
boundary location, assuming that he/she lives near that location, spends most days outdoors,<br />
and remains near home most of the time. A single released radionuclide is assumed for<br />
simplicity. To estimate the dose from inhalation, one would parameterize an equation similar<br />
to the following:<br />
B-11
H [ + D<br />
inhal = χ / Q]<br />
annual Qannual<br />
( BoutU<br />
out BinU<br />
in R)<br />
where:<br />
H is the annual dose by inhalation (mSv)<br />
[χ/Q] is the ground-level concentration per unit release rate (s m −3 )<br />
D is the dose coefficient for effective dose by inhalation (mSv Bq −1 )<br />
B are breathing rates typical of indoors and outdoors, such as exercising and resting (m 3 s −1 )<br />
U are fractions of time spent indoors and outdoors<br />
R is a fractional factor to estimate a reduced radionuclide concentration in indoor air<br />
A similar equation would represent external dose from photons emitted by the airborne<br />
radionuclide:<br />
inhal<br />
7<br />
extern = [ / Q]<br />
annual Qannual<br />
( U out + U in S)<br />
Dextern<br />
× 3.156 × 10<br />
H χ<br />
where:<br />
H is the annual external dose from the airborne radionuclide (mSv)<br />
[χ/Q] is the ground-level concentration per unit release rate (s m −3 )<br />
D is the dose rate coefficient for effective dose by external exposure to the radionuclide in air<br />
(mSv s −1 per Bq m −3 )<br />
S is a fractional factor for lower indoor exposure rate due to reduced indoor concentration<br />
and shielding from the outdoor concentration<br />
3.156 × 10 7 is seconds per year.<br />
It is assumed that all food comes from uncontaminated sources, since there are no known<br />
gardens or agricultural operations near the facility.<br />
Adding the previous equations and rearranging gives:<br />
H total = H inhal + H extern = [χ / Q]<br />
where K is a constant expression that depends on the exposure scenario parameters. The<br />
factors for the release Q and atmospheric diffusion [χ/Q] are subject to uncertainty.<br />
It is assumed that the atmospheric data suggest a lognormal distribution and provide an<br />
estimate of geometric standard deviation GSD = 1.8 for [χ/Q], and the operator analyses<br />
variability in past release data to conclude that Q is lognormally distributed with GSD = 1.3.<br />
The product of these independently distributed random variables is lognormally distributed<br />
with:<br />
2 2<br />
GSD = exp ln 1.8 + ln 1.3 = 1.9<br />
(B35) Lognormality implies that the geometric mean (GM) of H total is the product of the<br />
geometric means for [χ/Q] and Q and the constant K. It is assumed that the data and<br />
parameters are such that this product is GM = 0.4 mSv. Figure B-2 is a cumulative logprobability<br />
plot of this annual dose distribution. The figure shows the 95 th percentile of the<br />
annual dose as 1.15 mSv; thus for this exposure scenario, the probability is 5% that the<br />
annual dose could exceed 1.15 mSv. If investigation indicates that few if any members of the<br />
exposed population are likely to experience this degree of exposure (an assumption that<br />
guided the definition of the hypothetical individual), then it is unlikely that members of that<br />
annual<br />
Q<br />
annual<br />
K<br />
B-12
population will equal or exceed an annual dose of about 1 mSv from the facility’s future<br />
releases.<br />
(B36) Given the temporal nature of the data for the source term and fence-line air<br />
concentrations, it is possible that some would extend the interpretation of the 5% probability<br />
to that of exceeding 1.15 mSv one year out of 20. However, one must be cautious of such<br />
interpretations for data limited to too few years.<br />
Annual dose to hypothetical individual (mSv)<br />
2<br />
1<br />
0.1<br />
0.139<br />
mSv<br />
1.15 mSv<br />
0.4 mSv<br />
1 5 10 20 30 40 50 60 70 80 90 95 99<br />
Cumulative probability (%)<br />
Figure B-2. Type (1) lognormal probability distribution for the hypothetical individual of<br />
Example 1. Given the fixed parameters that define the hypothetical individual, this<br />
distribution assigns probabilities to intervals of dose, based on quantified uncertainties in the<br />
release of radionuclides to the atmosphere and variability in observed concentrations at the<br />
facility fence near the hypothetical individual’s location. The atmospheric concentrations at<br />
this location are assumed to exceed any that the vast majority of the exposed population<br />
would encounter. The 95 th percentile (1.15 mSv) indicates a probability of 5% that the<br />
hypothetical individual would exceed this annual dose.<br />
(B37) Example 2. Type (2) and type (3) distributions. A second fictitious nuclear facility<br />
releases radionuclides to the atmosphere (again, for simplicity, one radionuclide is assumed).<br />
The exposed population is contained in a single 22.5-degree wind sector from the facility’s<br />
release stack, between radial distances of 1 km and 15 km from the stack. The spatial<br />
distribution of the population is uniform with respect to land area. For the normalised<br />
distributions derived here, it is not necessary to know the total number of individuals in the<br />
population, nor is it necessary to know release rates. The wind sector is divided into 15 subregions,<br />
each with a radial distance of 1 km, with population in the 14 of them that begin at 1<br />
km from the source. The air concentrations of the released radionuclide are estimated with<br />
the sector-averaged Gaussian plume model:<br />
χ<br />
=<br />
Q<br />
fn<br />
exp<br />
π 2πσ<br />
ur<br />
2<br />
( − h /(2σ<br />
))<br />
2 z<br />
2<br />
z<br />
B-13
where:<br />
f is the fraction of time the population is downwind from the source<br />
n = 16 is the total number of wind sectors (of which only one is used for the example)<br />
u is the average wind speed<br />
r is the radial distance from the source to the point where [χ/Q] is evaluated.<br />
The symbol σ z (m) denotes a vertical dispersion coefficient for rural Class D conditions<br />
(taken as average) given by:<br />
σ<br />
z<br />
=<br />
0.06r<br />
1 + 0.0015r<br />
(Hanna et al. 1982). Uncertainty in the predictions of annual average concentrations by this<br />
model for regular terrain and meteorological conditions have been estimated by Miller and<br />
Hively (1987) and are reasonably interpreted as lognormally distributed with geometric<br />
standard deviation GSD = 1.53 for distances within 10 km and GSD = 2.32 for distances<br />
from 10 km to 150 km. Killough and Schmidt (2000) suggest a lognormal distribution with<br />
GSD = 1.53 for the uncertainty introduced by the use of composite meteorological data for<br />
several recent years. These two uncertainty distributions are used to compute the type (3)<br />
distribution but do not affect the type (2) distribution.<br />
(B38) For the type (2) distribution, one computes — deterministically — annual dose as an<br />
average for each 1-km sub-region. The distribution is plotted in Figure B-3 with dark circles<br />
connected by line segments. This type of distribution assigns to each annual dose interval the<br />
fraction of the population that receives that annual dose. The 50 th percentile is 0.1 mSv, and<br />
the 95 th percentile is about 0.5 mSv. Thus there is a 5% of chance that any individual would<br />
receive an annual dose that exceeds 0.5 mSv. There is no implication of quantified<br />
uncertainty here, and the interpretation is not probabilistic.<br />
(B39) Computation of the type (3) distribution requires the uncertainty distributions for the<br />
plume model and the meteorological data mentioned previously (a distribution for uncertainty<br />
in the annual release would also be required, but that was omitted from the example). The<br />
Monte Carlo procedure follows two steps at each realisation: (1) select a 1-km sub-region<br />
with probability proportional to the number of people in it and record the model-estimated<br />
dose as the GM of the lognormal uncertainty distribution; (2) sample from the lognormal<br />
distribution with this GM and a GSD representing the composite distribution for the product<br />
of the distributions for the plume model and the meteorological data. This sampling is as if<br />
one chose at random a single individual from the population (with all individuals having an<br />
equal chance) and from the uncertainty distribution associated with the chosen individual’s<br />
exposure scenario (in this case, location) sampled from the lognormal distribution an annual<br />
dose for that individual. Thus, the type (3) distribution assigns to intervals of annual dose<br />
probabilities based on the uncertainty of the dose estimation. The uncertainty may be<br />
associated with the source term and atmospheric transport only, when the population is<br />
hypothetical. In retrospective cases, one might also consider uncertainties associated with the<br />
population, but a distribution of this type is less likely to be useful for retrospective<br />
assessments than one obtained from sampling that considers various correlations and possibly<br />
sophisticated models of risk applied to the exposures for a collective assessment. Figure B-3<br />
shows the example of a type (3) distribution as the rough line (based on 1,000 realisations);<br />
B-14
the approximate linearity derives from the lognormal distribution that was applied to each<br />
individual’s dose uncertainty.<br />
1<br />
Annual dose (mSv)<br />
0.1<br />
Type (2) distribution<br />
Population weighted<br />
Type (3) distribution<br />
Population and uncertainty<br />
weighted<br />
0.01<br />
1 5 10 20 30 40 50 60 70 80 90 95 99<br />
Cumulative frequency (%)<br />
Figure B-3. Distributions of type (2) and type (3) for Example 2. The type (2) distribution<br />
weights intervals of deterministically estimated annual dose with fractions of the population<br />
receiving those annual doses (note that this distribution lacks the linear trend of<br />
lognormality). The type (3) distribution incorporates uncertainty in the dose estimates, in<br />
addition to population proportions, so that the interpretation for a dose interval is the<br />
probability that an individual chosen at random from the exposed population will have an<br />
annual dose in the interval.<br />
(B40) The 95 th percentile of the type (3) distribution is 0.72 mSv, indicating an<br />
interpretation that a randomly chosen individual from the exposed population would have a<br />
5% probability of exceeding this annual dose value. However, from the graph, one could<br />
estimate a 3% probability of the random individual’s exceeding an annual dose of 1 mSv. An<br />
annual dose in excess of ten times 1 mSv (10 mSv) is off the graph (well beyond the 99 th<br />
percentile) and would seem to meet any reasonable definition of “extremely unlikely.” One<br />
must also remember, for example, that a probability of 3% of exceeding 1 mSv given by a<br />
type (3) distribution is not the equivalent of asserting that only 3% of the population would<br />
exceed this annual dose. From an inspection of the type (2) curve (and the output file from<br />
the calculations), one can estimate that fewer than 2% of the population would exceed this<br />
dose when it is deterministically estimated. In lower-dose regions, the difference between the<br />
distributions is greater. For example, the 90 th percentile of the type (3) curve (0.5 mSv) is<br />
approximately the same as the (interpolated) 95 th percentile of the type (2) curve.<br />
B.8.<br />
Conclusions<br />
(B41) The Commission does not prescribe a specific method to be used for probabilistic<br />
assessments. This is because no single mathematical approach or percentage criterion can be<br />
B-15
applied to the diversity of distributions that may be encountered in probabilistic assessments<br />
of dose. Nevertheless, some guidance is necessary to aid operators and regulators in<br />
determining when compliance is met when probabilistic assessments are used.<br />
(B42) For some prospective probabilistic assessments of dose, it is possible that essentially<br />
all doses on the distribution will be predicted to be less than the dose constraint set by <strong>ICRP</strong><br />
(e.g., Example 1). In this case, compliance is readily met.<br />
(B43) In a prospective probabilistic assessment of dose to hypothetical individuals, whether<br />
from a planned facility or an existing situation, the Commission recommends that the<br />
representative individual be identified such that the probability is less than about 5% that a<br />
person drawn at random from the hypothetical population will receive an annual dose<br />
exceeding the dose constraint. This hypothetical individual should be representative of, at<br />
most, a few tens of people who are the most highly exposed. If this dose to the representative<br />
individual is below the dose constraint set by the Commission, then the design and planned<br />
operations are determined to be in compliance.<br />
(B44) Particular attention must be given to the region and accompanying population where<br />
the assessment is being conducted to define the representative individual. Care must be used<br />
to include all hypothetical individuals whose dose could possibly be representative of persons<br />
receiving the highest dose, including extremes. However, it is evident that including too large<br />
a region (and population) could dilute the impact of the number of doses in a distribution, and<br />
permit an unacceptable number of hypothetical individuals to receive doses in excess of the<br />
dose constraint. Therefore an iterative approach using sequentially smaller regions and<br />
populations is recommended. However, it is important to be certain scenarios that represent<br />
the highest doses are included in the region being evaluated. This approach should be<br />
repeated until the number of hypothetical individuals with doses that exceed the constraint is<br />
an acceptable number. It is understood that once the representative individual is identified,<br />
the hypothetical individuals that exceed the dose constraint are assumed to represent a<br />
heterogeneous population whose dose is the combination of random extremes of habits and<br />
environmental concentrations that are not likely to exist but are the result of a possibilities<br />
inherent in the probabilistic approach to estimating dose.<br />
(B45) In a probabilistic assessment of prospective dose to hypothetical individuals, if a<br />
homogeneous group of a few tens of persons or more is found to exist whose dose is above<br />
that for the representative individual, then the presence of a new critical group (and thus<br />
different representative individual) needs to be explored. Determining the existence of a<br />
homogeneous group in a probabilistic assessment can be problematic. For example, if a large<br />
population is being considered within the region of study, the existence of a homogeneous<br />
group of individuals above the dose constraint may be difficult to distinguish from a<br />
histogram or distribution curve. Therefore, care must always be taken to fully investigate the<br />
distribution of doses above the dose constraint to consider carefully all plausible scenarios of<br />
exposure, and to avoid the premature conclusion that these scenarios would correspond to<br />
few if any “random” individuals. Close attention must be paid to suggestions from members<br />
of the public of existing or likely exposure situations that might reflect extremes in the<br />
population. Such contributions may not have been considered in the operator’s analysis, and<br />
although they most often correspond to low exposures, experience has shown that they<br />
sometimes point out potentially significant exposure pathways that have not been considered<br />
and that warrant further investigation. If it can be shown that such a pathway, in combination<br />
B-16
with other exposure, is likely to affect a few tens of persons and elevate their doses above the<br />
dose constraint, then a revision of the analysis must be undertaken. If such a critical group is<br />
found to exist above the dose constraint, then the mean dose to this group becomes the basis<br />
for compliance.<br />
B-17
B.9.<br />
References<br />
Aitchison J. and Brown J.A.C. 1969. The Lognormal Distribution with Special Reference to<br />
its Uses in Economics. Cambridge University Press, Cambridge, UK.<br />
Hanna S.R., Briggs G.A., and Hosker R.P., Jr. 1982. Atmospheric Diffusion Handbook. U.S.<br />
Department of Energy, report DOE/TIC-11223.<br />
Hinds W.C. 1982. Aerosol Technology. John Wiley and Sons, New York, NY, USA.<br />
<strong>ICRP</strong>. 1999. Protection of the Public in Situations of Prolonged Radiation Exposure. <strong>ICRP</strong><br />
Publication 82. Ann. <strong>ICRP</strong> 29(1–2).<br />
Killough G.G. and Schmidt D.W. 2000. Uncertainty Analysis of Exposure to Radon Released<br />
from the Former Feed Materials Production Center. Journal of Environmental<br />
Radioactivity 49, 127–156.<br />
Miller and Hively. 1987.<br />
Wilkes S.S. 1962. Mathematical Statistics. John Wiley and Sons, Inc., New York, NY, USA.<br />
B-18