Presentation on Q1E - ICH
Presentation on Q1E - ICH
Presentation on Q1E - ICH

Create successful ePaper yourself
Turn your PDF publications into a flip-book with our unique Google optimized e-Paper software.
Evaluati<strong>on</strong> for Stability data<br />
<strong>Q1E</strong><br />
Sumie Yoshioka, Ph. D.<br />
MHLW<br />
Nati<strong>on</strong>al Institute of Health Sciences
<strong>Q1E</strong> provides recommendati<strong>on</strong>s <strong>on</strong> :<br />
• How to use stability data generated<br />
according to Q1AR<br />
• When and how a retest period or<br />
a shelf life can be extended bey<strong>on</strong>d<br />
the period covered by l<strong>on</strong>g-term data<br />
<strong>Q1E</strong> c<strong>on</strong>tains<br />
examples of statistical approaches to<br />
stability data analysis
• Extrapolati<strong>on</strong><br />
life<br />
toto extend retest period/shelf<br />
• Statistical approaches<br />
recommended in the guideline
No<br />
Significant<br />
change<br />
Yes<br />
Accelerated c<strong>on</strong>diti<strong>on</strong>
Where no significant change occurs<br />
at accelerated c<strong>on</strong>diti<strong>on</strong><br />
No<br />
Little or no change<br />
Little or no variability<br />
Yes<br />
Accelerated data & L<strong>on</strong>g-term data
Where accelerated data show<br />
significant change<br />
No<br />
Significant<br />
change<br />
Yes<br />
Intermediate c<strong>on</strong>diti<strong>on</strong>
No<br />
Amenable?<br />
Performed?<br />
Yes<br />
Statistical analysis
No<br />
Available?<br />
Yes<br />
Supporting data
Four outcomes<br />
passing through crossroads<br />
for Room Temperature Storage<br />
12 m<strong>on</strong>th extensi<strong>on</strong><br />
6 m<strong>on</strong>th extensi<strong>on</strong><br />
3 m<strong>on</strong>th extensi<strong>on</strong><br />
No extensi<strong>on</strong>
Outcome 1 12 m<strong>on</strong>th extensi<strong>on</strong><br />
accelerated data show<br />
no significant change<br />
accelerated data & l<strong>on</strong>g-term data<br />
little or no change<br />
little or no variability<br />
Outcome 4 no extensi<strong>on</strong><br />
significant change<br />
at accelerated c<strong>on</strong>diti<strong>on</strong><br />
at intermediate c<strong>on</strong>diti<strong>on</strong>
Statistical analysis<br />
l<strong>on</strong>ger retest period/shelf life<br />
(not necessarily required)
Where<br />
• Accelerated data show no significant change<br />
• Changes and variati<strong>on</strong>s in accelerated data<br />
l<strong>on</strong>g-term data<br />
amenable?<br />
performed?<br />
No<br />
6 m<strong>on</strong>th extensi<strong>on</strong><br />
Yes<br />
with Supporting data<br />
12 m<strong>on</strong>th extensi<strong>on</strong>
Where<br />
Significant change at accelerated c<strong>on</strong>diti<strong>on</strong><br />
but not at intermediate c<strong>on</strong>diti<strong>on</strong><br />
amenable?<br />
performed?<br />
No<br />
3 m<strong>on</strong>th extensi<strong>on</strong><br />
Yes<br />
with Supporting data<br />
6 m<strong>on</strong>th extensi<strong>on</strong>
Statistical analysis<br />
l<strong>on</strong>ger retest period/shelf life<br />
not always required<br />
Where<br />
•significant change<br />
at accelerated & intermediate c<strong>on</strong>diti<strong>on</strong>s<br />
•variability in l<strong>on</strong>g-term data<br />
Statistical analysis can be appropriate to<br />
verify retest period/shelf life
Statistical approaches<br />
recommended in the Appendix<br />
• How to analyze l<strong>on</strong>g-term data<br />
for appropriate quantitative attributes<br />
• How to use regressi<strong>on</strong> analysis<br />
for retest period/shelf life estimati<strong>on</strong><br />
• Examples of statistical procedures<br />
to determine poolability of data from<br />
different batches or factor combinati<strong>on</strong>s
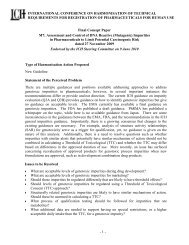
Regressi<strong>on</strong> analysis<br />
Establish retest period/shelf life<br />
with a high degree of c<strong>on</strong>fidence<br />
Quantitative attribute will remain<br />
within acceptance criteria<br />
for all future batches
120<br />
Shelf-life Estimati<strong>on</strong> with Upper and Lower Acceptance Criteria Based <strong>on</strong> Assay at<br />
25C/60%RH<br />
Assay (% of Label Claim)<br />
115<br />
110<br />
105<br />
100<br />
95<br />
90<br />
85<br />
80<br />
0 3 6 9 12 15 18 21 24 27 30 33 36 39 42 45 48<br />
Time Point (M<strong>on</strong>ths)<br />
Raw Data<br />
Upper c<strong>on</strong>fidence limit<br />
Lower c<strong>on</strong>fidence limit<br />
Regressi<strong>on</strong> line<br />
Upper acceptance<br />
criteri<strong>on</strong>: 105<br />
Lower acceptance<br />
criteri<strong>on</strong>: 95
Statistical approaches<br />
for determining whether data from different<br />
batches/factor combinati<strong>on</strong>s can be pooled<br />
• (Approach #1) Whether data from all<br />
batches/factor combinati<strong>on</strong>s support the<br />
proposed period<br />
• (Approach #2 “Poolability test”)<br />
Whether data from all batches/factor<br />
combinati<strong>on</strong>s can be combined<br />
for overall estimate of a single period<br />
• (Alternative approaches)
Approaches #1 and #2 can<br />
also be applied to data analysis<br />
for multi-factor studies including<br />
Bracketing & Matrixing Designs
Basic Principles<br />
•A shelf life is set based <strong>on</strong> l<strong>on</strong>g-term<br />
data<br />
•The extent of extrapolati<strong>on</strong> will<br />
depend <strong>on</strong> accelerated (and if<br />
applicable, intermediate) data, as<br />
well as l<strong>on</strong>g-term data<br />
•Supporting data are useful in<br />
predicting l<strong>on</strong>g-term stability in<br />
primary batches
Basic Principles (c<strong>on</strong>t’d)<br />
•Statistical analysis is not always<br />
necessary for setting a shelf life<br />
•A shelf life bey<strong>on</strong>d the period covered<br />
by available l<strong>on</strong>g-term data can be<br />
proposed with supporting data, with or<br />
without statistical analysis<br />
•Where a statistical analysis is<br />
performed, l<strong>on</strong>ger extrapolati<strong>on</strong> can be<br />
justified
MHLW Perspective - <strong>Q1E</strong><br />
Before <strong>Q1E</strong><br />
EU---12 m<strong>on</strong>th extrapolati<strong>on</strong> with or without<br />
statistical analysis;<br />
US--- max 6 m<strong>on</strong>th extrapolati<strong>on</strong> with<br />
statistical analysis;<br />
Japan--- no practical extrapolati<strong>on</strong><br />
• <strong>Q1E</strong> provides guidance <strong>on</strong> the extent of shelf<br />
life extrapolati<strong>on</strong> in a variety of<br />
situati<strong>on</strong>s<br />
• <strong>Q1E</strong> clearly describes the role of<br />
accelerated data and of supporting data in<br />
shelf life estimati<strong>on</strong>