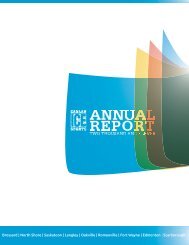
Annual Report 2010 - Canlan Ice Sports
Annual Report 2010 - Canlan Ice Sports
Annual Report 2010 - Canlan Ice Sports

You also want an ePaper? Increase the reach of your titles
YUMPU automatically turns print PDFs into web optimized ePapers that Google loves.
Table of<br />
Contents<br />
Financial Highlights<br />
Page 4<br />
Message to Shareholders<br />
Page 5<br />
Facility Locations<br />
Page 8<br />
Management’s Discussion & Analysis<br />
Page 10<br />
Auditors’ <strong>Report</strong> to the Shareholders<br />
Page 35<br />
Consolidated Financial Statements<br />
Page 36<br />
Five Year Review<br />
Page 48<br />
Corporate Information<br />
Page 50
Financial Highlights<br />
18%<br />
3%<br />
72%<br />
7%<br />
Revenue Breakdown<br />
<strong>Ice</strong> Revenue<br />
Food & Beverage<br />
<strong>Sports</strong> Store<br />
Management Fees, Consulting & Other<br />
In thousands, except per share information <strong>2010</strong> 2009 2008<br />
Revenue $69,849 $67,196 $64,669<br />
Earnings before interest, taxes and amortization 9,531 10,915 11,236<br />
Net earnings before taxes 1,841 3,333 2,149<br />
Net earnings 707 2,734 3,827<br />
Total assets 110,513 113,548 114,714<br />
Shareholders equity 46,680 46,173 43,439<br />
Earnings per common share $0.05 $0.20 $0.290<br />
Shareholders equity per share $3.50 $3.46 $3.260<br />
Number of common shares outstanding 13,337,448 13,337,448 13,337,448<br />
Revenue<br />
EBITA<br />
$80,000<br />
$70,000<br />
$60,000<br />
$50,000<br />
$40,000<br />
$30,000<br />
$20,000<br />
$10,000<br />
$0<br />
2006 2007 2008 2009 <strong>2010</strong><br />
4 <strong>Canlan</strong> <strong>Ice</strong> <strong>Sports</strong> Corp. <strong>2010</strong> <strong>Annual</strong> <strong>Report</strong><br />
$12,000<br />
$10,000<br />
$8,000<br />
$6,000<br />
$4,000<br />
$2,000<br />
$0<br />
2006 2007 2008 2009 <strong>2010</strong>
Joey St-Aubin, Chief Executive Officer<br />
Message to Shareholders<br />
<strong>2010</strong> brought with it the residual effects of the economic slowdown. While reduced spending was a key<br />
contributor to lower than expected sales in certain markets, new competition made possible by government<br />
stimulus was our biggest nemesis. We saw new facilities constructed in Winnipeg, Regina and Oakville all of<br />
which had an immediate impact on our business. As we expected, most private competitors chose to reduce<br />
pricing as a means to retain customers, while we chose to increase value to maintain current pricing levels.<br />
This strategy may have cost us customers in the short run, but it is our belief that the quality and value that<br />
we offer will be key enablers in winning customers back in fairly short order.<br />
In <strong>2010</strong> we stuck to our plan of providing quality products with a focus on excellent customer service. To<br />
further demonstrate our confidence to our team members and to our shareholders we introduced a new<br />
company sponsored RRSP program and announced the payment of our first dividend, which was paid on<br />
January 17, 2011. We believe that this was a wise decision knowing fair well that it’s during times like these<br />
that loyalty and hard work are at their peak.<br />
Having sustained two consecutive recessionary years gives us great confidence going forward. While others<br />
were focused solely on cutting costs, we chose to invest in our people, our structure and our strategies in<br />
preparation for the opportunities that the back end of this recession would provide. Our predictions of failing<br />
ice related businesses are evidenced across many target markets in the United States and we have restructured<br />
our team in anticipation of this to take advantage of the opportunistic climate.<br />
In March 2011 we refinanced term debt that was coming due in September, 2011, for another three years. In<br />
addition, we have arranged a $5 million revolving credit facility to be used for acquisitions. This critical piece<br />
was needed to allow us to fully activate our “Partnership Solutions” strategy in both Canada and the United<br />
States. In Q4 <strong>2010</strong> we expanded our “Partnership Solutions” division, which focuses on expanding our facility<br />
portfolio through management, lease, lease to own and acquisition. We achieved this by adding real estate<br />
development expertise and P3 solutions that has allowed us to expand our service offerings to Canadian<br />
municipalities beyond our traditional facility management approach. In the United States we established<br />
strategic partnerships with developers in order to provide us access to a wider range of future projects.<br />
Knowing where we were, where we are and where we are going, allows me to state with confidence that the<br />
best has yet to come.<br />
On behalf of the senior management team, I wish to thank all <strong>Canlan</strong> team members for their passion and<br />
customer focus, and our investors for believing in the <strong>Canlan</strong> model. 2011 is going to be a great year! In<br />
addition, I would like to thank Mr. Ted Cohen for his valuable contributions over his 12 year tenure on our<br />
Board of Directors. Mr. Cohen will be retiring from <strong>Canlan</strong>’s Board at our June 15, 2011 annual general meeting.<br />
Joey St-Aubin<br />
President & CEO<br />
<strong>Canlan</strong> <strong>Ice</strong> <strong>Sports</strong> Corp. <strong>2010</strong> <strong>Annual</strong> <strong>Report</strong><br />
5
TRENG<br />
Just A Few<br />
Of Our Strengths<br />
The Adult Safe Hockey League is a professionally managed recreational hockey<br />
League. In <strong>2010</strong>, the ASHL generated $24.2 million in total registration revenue<br />
which represents 47% of our total ice sales. ASHL revenue increased by<br />
6% in <strong>2010</strong>.<br />
The Hockey and Skating Academies operate throughout the year and have a<br />
variety of weekly classes for both youth and adults. In <strong>2010</strong> we had 23,800<br />
participants in these programs and generated $4.6 million in gross revenue,<br />
which is 9% of our total ice sales.<br />
on<br />
In <strong>2010</strong> we had 11,000 players registered in five different age categories.<br />
These leagues generated $2.7 million in gross revenue, which is 5% of our<br />
total ice sales. This non-contact league is specifically designed to enable players<br />
to keep their conditioning level high and their skills sharp through the<br />
off season.<br />
In <strong>2010</strong> <strong>Canlan</strong> Classic Tournaments hosted 51 tournament events, with a<br />
total revenue of 1.8 million. CCT is now considered one of the best choices for<br />
value and experience in the hockey tournament circuit for boys, girls, men,<br />
women and co-ed.<br />
The Adult Indoor Soccer League (“AISL”) has over 3,000 players registered<br />
in both locations and the league operates in two separate seasons during<br />
the year. Indoor soccer generated $1.1 million in total revenue from our two<br />
indoor facilities.
Mission<br />
HT<br />
<strong>Canlan</strong> <strong>Ice</strong> <strong>Sports</strong> will be the recognized leader<br />
in North America in the development, operations<br />
and ownership of multi-purpose recreation and<br />
entertainment facilities.<br />
We will provide highly desirable products and services<br />
in clean, safe, fun and friendly facilities, aiming<br />
to exceed the diverse recreational needs of sports<br />
enthusiasts of all ages, gender and ethnicity within<br />
the markets that we serve.<br />
We will be the brand of choice to our customers<br />
because of our excellent operations & service, the<br />
employer of choice to our team members because of<br />
the importance we place on them, and a model of<br />
integrity for suppliers, partners, and the communities<br />
we support because we fulfill our commitments.<br />
Success will be measured by loyalty, retention, service,<br />
carbon footprint, profitability and shareholder value.
BRITISH COLUMBIA<br />
<strong>Canlan</strong> <strong>Ice</strong> <strong>Sports</strong> 8-Rinks, 8-Rink Complex<br />
<strong>Canlan</strong> <strong>Ice</strong> <strong>Sports</strong> North Shore, 3-Rink Complex<br />
<strong>Canlan</strong> <strong>Ice</strong> <strong>Sports</strong> Langley Twin Rinks, 2-Rink Complex<br />
<strong>Canlan</strong> <strong>Ice</strong> <strong>Sports</strong> South Cariboo Rec. Centre, 1-Rink Complex<br />
Armstrong / Spallumcheen <strong>Sports</strong> Centre, 1-Rink Complex<br />
ALBERTA<br />
River Cree <strong>Ice</strong> <strong>Sports</strong> Complex (Edmonton), 2-Rink Complex<br />
SASKATCHEWAN<br />
<strong>Canlan</strong> <strong>Ice</strong> <strong>Sports</strong> Jemini (Saskatoon), 4-Rink Complex<br />
<strong>Canlan</strong> <strong>Ice</strong> <strong>Sports</strong> Agriplace (Saskatoon), 2-Rink Complex<br />
<strong>Canlan</strong> <strong>Ice</strong> <strong>Sports</strong> Regina, 2-Rink Complex<br />
MANITOBA<br />
<strong>Canlan</strong> <strong>Ice</strong> <strong>Sports</strong> Winnipeg, 4-Rink Complex<br />
ONTARIO<br />
<strong>Canlan</strong> <strong>Ice</strong> <strong>Sports</strong> Oakville, 4-Rink Complex<br />
<strong>Canlan</strong> <strong>Ice</strong> <strong>Sports</strong> Etobicoke, 4-Rink Complex<br />
<strong>Canlan</strong> <strong>Ice</strong> <strong>Sports</strong> Scarborough, 4-Rink Complex<br />
<strong>Canlan</strong> <strong>Ice</strong> <strong>Sports</strong> York, 6-Rink Complex<br />
<strong>Canlan</strong> <strong>Ice</strong> <strong>Sports</strong> Oshawa, 2-Rink Complex<br />
<strong>Canlan</strong> <strong>Ice</strong> <strong>Sports</strong> Victoria Park, 2-Rink Complex<br />
QUEBEC<br />
<strong>Canlan</strong> <strong>Ice</strong> <strong>Sports</strong> Les 4 Glaces (Brossard), 4-Rink Complex<br />
<strong>Canlan</strong> <strong>Ice</strong> <strong>Sports</strong> Les 2 Glaces (Candiac), 2-Rink Complex<br />
INDIANA<br />
Lutheran Health <strong>Sports</strong> Center, 3-Rink Complex<br />
McMillen <strong>Ice</strong> Arena, 1-Rink Complex<br />
NEW JERSEY<br />
<strong>Canlan</strong> <strong>Ice</strong> <strong>Sports</strong> Vineland, 2-Rink Complex<br />
8 <strong>Canlan</strong> <strong>Ice</strong> <strong>Sports</strong> Corp. <strong>2010</strong> <strong>Annual</strong> <strong>Report</strong>
LOCA<br />
TIONS<br />
Our Locations<br />
Mark Faubert, Senior VP,<br />
Operations<br />
<strong>Canlan</strong> <strong>Ice</strong> <strong>Sports</strong> Corp. <strong>2010</strong> <strong>Annual</strong> <strong>Report</strong><br />
9
ANLA<br />
Management Discussion & Analysis<br />
Michael Gellard, Chief Financial Officer<br />
Overall Performance<br />
<strong>2010</strong> financial highlights:<br />
The following management discussion and analysis (MD&A) summarizes<br />
significant factors affecting the consolidated operating results and<br />
financial condition of <strong>Canlan</strong> <strong>Ice</strong> <strong>Sports</strong> Corp. (“<strong>Canlan</strong>”, “the Company”,<br />
“we” “our” or “us”) for the years ended December 31, <strong>2010</strong> and 2009. This<br />
document should be read in conjunction with our audited consolidated<br />
financial statements for the years ended December 31, <strong>2010</strong> and 2009 and<br />
accompanying notes. The results reported herein have been prepared in<br />
accordance with Canadian generally accepted accounting principles (GAAP)<br />
and are presented in Canadian dollars.<br />
In the following discussion, we define EBITA as earnings before interest,<br />
taxes and amortization. In addition, the term free cash flow is used,<br />
which we calculate as cash flow from operations less capital expenditures<br />
minus any proceeds from the disposition of capital assets. However, EBITA<br />
and free cash flow are not terms that have specific meaning in accordance<br />
with GAAP, and may be calculated differently by other companies. The<br />
Company discloses EBITA and free cash flow because these are useful<br />
indicators of operating performance and liquidity.<br />
Additional information relating to our Company, including quarterly<br />
reports and our annual information form, is filed on SEDAR and can be<br />
viewed at www.sedar.com and our website www.icesports.com .<br />
The date of this MD&A is March 22, 2011.<br />
• We generated $69.8 million in gross revenue (2009 - $67.2 million), an<br />
increase of $2.7 million or 3.9%.<br />
• On a same store basis, we increased our revenue by 1.9%.<br />
• We recorded earnings before interest, taxes, amortization, and a gain<br />
held for trading of $9.5 million (2009 - $10.9 million), a decrease of<br />
$1.4 million, or 12.8%.<br />
• We recorded net earnings before tax of $1.8 million (2009 - $3.3<br />
million).<br />
• We recorded net earnings of $0.7 million, (2009 - $2.7 million), or<br />
$0.05 per share, (2009 - $0.20 per share).<br />
• Ended the year with $8.9 million in cash, compared to $9.2 million at<br />
the end of fiscal 2009.<br />
• We spent $2.2 million on capital improvements on our owned and<br />
leased (2009 - $1.8 million) facilities.<br />
• We reduced interest bearing debt by $2.7 million (2009 - $4.1 million,<br />
including redemption of preferred shares)<br />
<strong>2010</strong> significant achievements:<br />
On February 14, <strong>2010</strong> we commenced operations in Fort Wayne, Indiana.<br />
This state of the art 128,000 sq. ft facility contains three full-size ice<br />
surfaces. Other amenities include a fully licensed restaurant and a full<br />
service sports store. We have agreed to a 20 year lease that includes an<br />
option to purchase the facility for US$9.3 million up to February 2015, and<br />
US$9.8 million between February 2015 and February 2017.<br />
In connection with our new Fort Wayne facility, we entered into our first<br />
long term building naming rights agreement. The new Fort Wayne facility<br />
will be known as the Lutheran Health <strong>Sports</strong> Centre for the next 10 years.<br />
Our tournament division was very active and had a record year. In <strong>2010</strong><br />
<strong>Canlan</strong> Classic Tournaments organized 51 tournaments, most of which were<br />
in <strong>Canlan</strong>-owned buildings, that attracted 1,979 teams.<br />
During the year we reorganized our national marketing department, and<br />
established a brand team whose primary responsibility is to develop new<br />
marketing strategies and increase revenue through a team of aggressive<br />
sales people and brand managers.<br />
On December 6, <strong>2010</strong>, with the approval of the Company’s Board of<br />
Directors, we declared the introduction of a quarterly dividend in the<br />
amount of $0.015 per common share. This first dividend was paid on<br />
January 17, 2011 to shareholders of record on December 15, <strong>2010</strong>.<br />
10 <strong>Canlan</strong> <strong>Ice</strong> <strong>Sports</strong> Corp. <strong>2010</strong> <strong>Annual</strong> <strong>Report</strong>
N ICE<br />
Business of the Company<br />
<strong>Canlan</strong> <strong>Ice</strong> <strong>Sports</strong> Corp. is a leading operator of recreational and leisure facilities.<br />
The Company’s first venture into the ice rink industry was in 1986,<br />
when it acquired a facility known as Columbia 4 Rinks located in Burnaby<br />
B.C. This facility was expanded in 1995 to an eight rink facility, which is<br />
now known as Burnaby 8 Rinks. The Company’s head office is located in<br />
the Burnaby facility and it maintains a second corporate office at its <strong>Ice</strong><br />
<strong>Sports</strong> York location in Toronto. We currently have approximately 963 full<br />
time and part time employees working in our facilities and two corporate<br />
offices.<br />
During the period from 1995 to 1998 <strong>Canlan</strong> built six multi-pad facilities<br />
located in B.C. (1), Ontario (4) and Quebec (1). All of these facilities are<br />
still owned by the Company. In addition to constructing six facilities, we<br />
purchased a further seven buildings since acquiring Columbia 4 Rinks, one<br />
of which we sold in 2006.<br />
As at the date of this MD&A the Company owns, leases or manages a<br />
network of 21 facilities in Canada and the United States containing 61 full<br />
sized ice sheets and two indoor soccer fields. Other recreation amenities<br />
contained in <strong>Canlan</strong>’s facilities include curling rinks, beach volleyball<br />
courts, and softball diamonds. The Company owns 11 of these facilities<br />
containing 1.2 million square feet of space; we operate two facilities under<br />
long-term land lease arrangements and a further four facilities under operating<br />
leases. We currently manage four facilities on behalf of third party<br />
owners from both the private and public sectors.<br />
Change in facility portfolio from prior year:<br />
• On December 31, <strong>2010</strong>, a management contract located in Monroe,<br />
Michigan matured and was not renewed.<br />
Our total facility count, including all owned, leased and managed<br />
properties, is as follows:<br />
Number of Facilities Surfaces<br />
<strong>2010</strong> 21 63<br />
2009 22 65<br />
2008 22 65<br />
2007 22 64<br />
2006 22 64<br />
Management Discussion & Analysis<br />
A more detailed summary of the locations of our facilities is as follows:<br />
Canada:<br />
British Columbia<br />
Number<br />
of<br />
playing<br />
surfaces<br />
Operating structure<br />
Burnaby 8 Rinks 8 Owned<br />
<strong>Ice</strong> <strong>Sports</strong> North Shore 3 Long term land lease<br />
<strong>Ice</strong> <strong>Sports</strong> Langley Twin Rinks 2 Operating lease<br />
South Cariboo Recreation Center -<br />
100 Mile House<br />
1 Managed<br />
Armstrong/Spallumcheen Parks &<br />
Recreation<br />
Alberta - River Cree Twin Rinks -<br />
Edmonton<br />
Saskatchewan<br />
1 Managed<br />
2 Managed<br />
<strong>Ice</strong> <strong>Sports</strong> Jemini - Saskatoon 4 Owned<br />
<strong>Ice</strong> <strong>Sports</strong> Agriplace - Saskatoon 2 Owned<br />
<strong>Ice</strong> <strong>Sports</strong> Regina 2 Owned<br />
Manitoba - <strong>Ice</strong> <strong>Sports</strong> Winnipeg 4 Owned<br />
Ontario<br />
<strong>Ice</strong> <strong>Sports</strong> Scarborough 4 Owned<br />
<strong>Ice</strong> <strong>Sports</strong> Etobicoke 4 Owned<br />
<strong>Ice</strong> <strong>Sports</strong> Oakville 4 Owned<br />
<strong>Ice</strong> <strong>Sports</strong> Oshawa 2 Owned<br />
<strong>Ice</strong> <strong>Sports</strong> York 6 Long term land lease<br />
<strong>Ice</strong> <strong>Sports</strong> Victoria Park 2 Operating lease<br />
Quebec<br />
Les Quatre Glaces - Brossard 4 Owned<br />
Les Deux Glaces - Candiac 2 Owned<br />
57<br />
USA:<br />
Indiana<br />
<strong>Ice</strong> <strong>Sports</strong> Fort Wayne 3 Operating lease<br />
<strong>Ice</strong> <strong>Sports</strong> McMillen - Fort Wayne 1 Managed<br />
New Jersey - <strong>Ice</strong> <strong>Sports</strong> Vineland 2 Operating lease<br />
6<br />
63<br />
<strong>Canlan</strong> <strong>Ice</strong> <strong>Sports</strong> Corp. <strong>2010</strong> <strong>Annual</strong> <strong>Report</strong><br />
11
ANLA<br />
Management Discussion & Analysis<br />
About <strong>Canlan</strong><br />
<strong>Canlan</strong> is a publicly traded Canadian Company with shares listed on the<br />
Toronto Stock Exchange (TSX) under the trading symbol ICE. <strong>Canlan</strong>’s shares<br />
were first listed for trading on the TSX on March 1, 1990.<br />
programs, hockey and soccer programs, specialty sports programs, various<br />
sports camps, and hockey tournaments for both youth and adults.<br />
We determined that our success will be evaluated by the following<br />
indicators:<br />
There are 13,337,448 shares outstanding that have traded in the $1.95 to<br />
$2.25 range since December 31, <strong>2010</strong>. The Company has not issued any<br />
shares since November 2004.<br />
The Company derives revenue from six primary sources:<br />
<strong>Ice</strong> sales and internal programming<br />
Food and beverage<br />
<strong>Sports</strong> stores<br />
Tournaments<br />
Management & consulting<br />
Space rental & other<br />
Five year Revenue, Costs and EBITA trend:<br />
$80.0<br />
$70.0<br />
1. Growth in revenue while sustaining operating margins.<br />
2. Return on investment.<br />
3. Brand awareness<br />
4. Customer loyalty<br />
5. Employee satisfaction<br />
6. Quality control<br />
We have developed six critical success factors supported by specific<br />
project objectives that the entire organization has been introduced to:<br />
Sales and Marketing - Cutting edge marketing that maximizes brand<br />
awareness, revenue and customer loyalty.<br />
Customer Experience – Exceptional service delivered by well-trained and<br />
motivated staff that results in consistently great experiences.<br />
New Ventures & Innovation - Proactively and aggressively seek out new<br />
opportunities that profitably drive new business.<br />
$60.0<br />
$50.0<br />
$40.0<br />
$30.0<br />
$20.0<br />
$10.0<br />
Revenue<br />
Costs<br />
EBITA<br />
Operational Excellence – Highly efficient and effective facility operations<br />
using industry – leading technology, streamlined process and consistent<br />
best practices.<br />
People & Leadership – Strong leadership and highly dedicated people<br />
accountable for delivering outstanding customer experiences and business<br />
results.<br />
Culture – High energy action-oriented culture that has a strong foundation<br />
in team-work, pride, respect and accountability.<br />
$0.0<br />
2006 2007 2008 2009 <strong>2010</strong><br />
Vision, Core Business and Strategy<br />
<strong>Canlan</strong> will strive to be:<br />
“A high performance industry leader, passionately committed to<br />
providing exceptional customer experiences, every time.”<br />
Since developing the strategic plan in the summer of 2009, many of the<br />
initiatives connected with these critical success factors have commenced.<br />
Particularly ones connected with operational excellence where we have<br />
seen reductions in energy consumption. In addition we have recently hired<br />
a Vice President of Sales, Marketing and Service which is a newly created<br />
position connected to the sales and marketing initiative.<br />
The Company’s goal is to leverage its leadership position in the North<br />
American ice rink industry by continuing to focus on both organic growth<br />
and expansion through acquisition and long term lease. By providing<br />
quality products and services in clean safe facilities, we still have<br />
capacity to grow our existing revenue base by providing value added<br />
services to our customers. While our largest single market segment is<br />
the adult recreational hockey player, we are committed to increasing our<br />
market share of other segments in our current markets, including skating<br />
12 <strong>Canlan</strong> <strong>Ice</strong> <strong>Sports</strong> Corp. <strong>2010</strong> <strong>Annual</strong> <strong>Report</strong>
N ICE<br />
The Marketplace and Our Competition<br />
<strong>Canlan</strong>’s current marketplace is recreation, and we understand that we are<br />
competing for disposable dollars with other sports and activities that can<br />
have significantly lower participation costs. Our largest customer segment<br />
is adult hockey players. This segment of our business represents 47% of our<br />
total ice sales, or $24.2 million. It also represents 35% of total revenue.<br />
<strong>Canlan</strong>’s largest competition is from municipalities and private league<br />
operators. Local governments cater primarily to their constituents who<br />
are usually made up of minor hockey and other amateur user groups. There<br />
are many private league operators in Canada that purchase ice time from<br />
local rinks and run adult leagues. Unless an oversupply situation exists in<br />
a jurisdiction, we do not believe that competition from municipalities and<br />
local league operators will be significant enough to impede our growth.<br />
<strong>Canlan</strong> has many advantages, the largest one being the fact that we own<br />
our buildings and control all of the ice inventory in them, enabling us to<br />
schedule ice times efficiently and provide quality ice times where deemed<br />
most appropriate. In addition, our facilities are generally full-service ice<br />
sports & entertainment centers where we incorporate retail and food &<br />
beverage services into the customers’ experience.<br />
Competitive Strengths<br />
The Company believes that it has the following competitive advantages:<br />
Our Employees. <strong>Canlan</strong> currently has 963 full and part time dedicated<br />
employees in Canada and the USA. Through training and internal<br />
communications, we have established <strong>Canlan</strong> as the place to work in<br />
our industry and we attract the most talented people in the industry.<br />
Our employees are focused on providing quality customer service and a<br />
safe environment. To enhance our ability to attract and retain quality<br />
employees, <strong>Canlan</strong> established a Company sponsored group RRSP program<br />
on January 1, <strong>2010</strong>.<br />
Adult Safe Hockey League (ASHL). The Company operates the largest<br />
and most established adult hockey league in North America. The ASHL is<br />
our premier brand. It operates year-round and has over 70,000 players<br />
registered in various divisions based on skill and age.<br />
Geographic coverage. <strong>Canlan</strong> currently owns and operates facilities in<br />
six provinces in Canada and two U.S. states giving us broad geographic<br />
coverage. Our geographic diversity and wide customer base helped <strong>Canlan</strong><br />
withstand the effects of the economic downturn.<br />
Executive team. <strong>Canlan</strong>’s executive team is comprised of nine individuals<br />
who are members of the management committee. This group meets<br />
regularly to review past and present performance, as well as continually<br />
assessing future growth strategies. These individuals have extensive<br />
expertise in operations, sales, marketing, customer service, finance &<br />
accounting and human resources.<br />
Management Discussion & Analysis<br />
Barriers to entry in the market. We have seen a significant increase<br />
in construction costs making the replacement cost of our buildings much<br />
higher than their original cost. The increased cost of construction will<br />
likely make privately funded ice rink projects less viable, reducing the<br />
competitive risk.<br />
Buying Power. As a result of being geographically diversified, and having<br />
significant product volumes in a number of categories, we are able to<br />
negotiate national supply agreements for preferred pricing.<br />
<strong>Canlan</strong> <strong>Ice</strong> <strong>Sports</strong> Corp. <strong>2010</strong> <strong>Annual</strong> <strong>Report</strong><br />
13
ANLA<br />
Management Discussion & Analysis<br />
Selected Financial Information<br />
The following selected consolidated financial information as at December 31, <strong>2010</strong>, 2009 and 2008 and each of the years then ended has been derived<br />
from our audited consolidated financial statements. This data should be read together with those financial statements.<br />
Our consolidated financial statements are prepared in accordance with Canadian GAAP, and are stated in Canadian dollars.<br />
in thousands<br />
Three months ended<br />
December 31,<br />
Year ended<br />
December 31,<br />
<strong>2010</strong> 2009 <strong>2010</strong> 2009 2008<br />
Statement of Operations Data:<br />
Total revenue (1) $20,016 $19,563 $69,849 $67,196 $64,669<br />
Direct expenses (2) (14,051) (13,285) (55,565) (52,142) (49,768)<br />
General & administration expenses (1,277) (855) (4,753) (4,139) (3,665)<br />
EBITA 4,688 5,423 9,531 10,915 11,236<br />
Other expenses:<br />
Amortization (1,233) (1,143) (4,813) (4,467) (4,224)<br />
Interest (814) (826) (3,296) (3,542) (3,944)<br />
Other 133 75 420 427 (919)<br />
Taxes (1,320) (482) (1,135) (599) 1,678<br />
Net Earnings $1,454 $3,047 $707 $2,734 $3,827<br />
Basic and diluted earnings per share $0.11 $0.23 $0.05 $0.20 $0.29<br />
Balance Sheet Data:<br />
Cash $8,903 $9,213 $7,588<br />
Working capital (excluding cash) 3,016 3,365 3,228<br />
Capital assets 94,984 96,778 98,993<br />
Other assets 3,610 4,192 4,905<br />
Total assets $110,513 $113,548 $114,714<br />
Current liabilities, excluding debt $16,511 $17,947 $17,624<br />
Mortgage debt 44,022 46,595 49,105<br />
Equipment leases 1,455 1,446 1,639<br />
Future income taxes 1,845 1,387 1,507<br />
Preferred shares (classified as debt) - - 1,400<br />
Total liabilities 63,833 67,375 71,275<br />
Shareholders's equity 46,680 46,173 43,439<br />
$110,513 $113,548 $114,714<br />
(1) Total revenue is comprised of ice rentals, food & beverage sales, sports store sales, sponsorship, advertising and management fees.<br />
(2) Direct expenses include all operating costs related to the operation of our facilities.<br />
14 <strong>Canlan</strong> <strong>Ice</strong> <strong>Sports</strong> Corp. <strong>2010</strong> <strong>Annual</strong> <strong>Report</strong>
N ICE<br />
Review of Fiscal <strong>2010</strong> Operations<br />
Revenue<br />
Total revenue increased by $2.7 million or 3.9% to $69.8 million compared<br />
to $67.2 million in 2009.<br />
After eliminating the revenue contribution from our new facility in Fort<br />
Wayne, IN we grew our revenue by $1.2 million or 1.8%, on a same store<br />
basis.<br />
Management Discussion & Analysis<br />
hockey aged players who wish to continue to play after the regular fall/<br />
winter season ends. We offer both the traditional “5 on 5” formats through<br />
the Youth Hockey League, as well as a “3 on 3” league for those players<br />
looking for something a little different.<br />
In <strong>2010</strong> we had 11,000 players (2009 – 10,100) registered in five different<br />
age categories. These leagues generated $2.7 million in gross revenue,<br />
which is 5% of our total ice sales.<br />
Camp <strong>Canlan</strong>, Hockey and Skating Academies<br />
Approximately 74% or $51.8 million (2009 - $48.8 million) of the Company’s<br />
total revenue is generated from ice sales and in-house programs.<br />
Approximately 67% of our total ice sales are generated through in-house<br />
programs that <strong>Canlan</strong> has developed. This gives us a distinct advantage as<br />
we have the flexibility to program our ice inventory based on demand.<br />
The Adult Safe Hockey League<br />
Our largest and most successful program is the Adult Safe Hockey League<br />
(“ASHL”). The ASHL operates in two seasons, the fall/winter season which<br />
is from September to April and the spring/summer season which operates<br />
from May to August each year. In <strong>2010</strong>, the ASHL generated $24.2 million<br />
in total registration revenue which represents 47% of our total ice sales.<br />
(2009: $22.8 million, 47% of ice sales). ASHL revenue increased by 6%<br />
in <strong>2010</strong>. While there was a decrease in team counts in the Toronto and<br />
Winnipeg markets due to economic conditions and competition from other<br />
league operators,we did increase the number of teams, overall, playing<br />
in the ASHL fall/winter season by 25 teams compared to prior season.<br />
Fourteen of these new teams came from our new facility in Fort Wayne. All<br />
of our adult leagues in western Canada experienced increases in fall/winter<br />
league registrations, and we established a new 37 team satellite league<br />
playing in the new Richmond Oval.<br />
In <strong>2010</strong> we saw our spring/summer league grow by 50 teams over 2009.<br />
Twenty- three of these new teams came from our US locations in Fort<br />
Wayne and Vineland.<br />
The ASHL is a full service adult recreational league for both men and<br />
women with a variety of divisions based on age and/or skill level. Services<br />
provided include scheduling, officiating, on-line statistics, accident<br />
insurance, prizing and various levels of championship play including our<br />
coveted North American Championship. The league is an integral part of<br />
our business and generated 35% of the Company’s total revenue in <strong>2010</strong>,<br />
compared to 34% in 2009.<br />
We have over 70,000 adult hockey players registered in our winter and a<br />
summer leagues combined.<br />
The Youth Hockey League and 3 on 3<br />
<strong>Canlan</strong> offers a variety of developmental programs through our branded<br />
Camp <strong>Canlan</strong> and Hockey and Skating Academies. Camp <strong>Canlan</strong> operates<br />
primarily in the summer months and is directed at the youth market, with<br />
a focus on hockey skills development.<br />
The Hockey and Skating Academies operate throughout the year and have<br />
a variety of weekly classes for both youth and adults. Classes include<br />
everything from learn to skate programs to power skating and team<br />
tactics.<br />
In <strong>2010</strong> we had 23,800 participants (2009 – 18,200) in these programs and<br />
generated $4.6 million in gross revenue, which is 9% of our total ice sales.<br />
Other ice revenue<br />
After providing the necessary allocation of ice times to operate our inhouse<br />
programs, we rent ice to third parties. Contract users are required<br />
to sign seasonal contracts for the fall/winter and spring/summer seasons<br />
and are charged a fixed hourly rate. The ice time is used by private groups,<br />
minor hockey associations, third party tournaments and camp operators<br />
as well as some adult leagues. Overall, third party contracts accounted for<br />
27% of our total ice sales in <strong>2010</strong>, or $14 million. As our in-house programs<br />
develop and require more ice time we expect revenue from contract users<br />
to decrease to approximately 25% of our total ice sales.<br />
Indoor Soccer<br />
<strong>Canlan</strong> operates two indoor soccer facilities, one in Burnaby built in 2000,<br />
and a second field in Winnipeg, built in 2006. Our approach to increasing<br />
the utilization of these synthetic turf fields is similar to how we approach<br />
the ASHL. We have developed successful indoor soccer leagues at both<br />
locations that consume all evening times. The Adult Indoor Soccer League<br />
(“AISL”) has over 3,000 players registered in both locations and the league<br />
operates in two separate seasons during the year, with a similar business<br />
plan to the ASHL. In addition, we work with local soccer associations in<br />
Burnaby and Winnipeg to develop training programs for their members.<br />
We generated $1.1 million in total revenue from our two indoor facilities,<br />
which is unchanged from 2009.<br />
In addition to the ASHL, <strong>Canlan</strong> also operates a variety of youth leagues<br />
in the spring and summer seasons. These leagues are designed for minor<br />
<strong>Canlan</strong> <strong>Ice</strong> <strong>Sports</strong> Corp. <strong>2010</strong> <strong>Annual</strong> <strong>Report</strong><br />
15
ANLA<br />
Management Discussion & Analysis<br />
Revenue generated from activity on our ice rinks and soccer fields:<br />
in thousands <strong>2010</strong> 2009<br />
Adult hockey leagues $24,185 47% $22,766 47%<br />
3rd party contract holders 13,561 27% 13,468 28%<br />
Hockey & skating schools 4,601 9% 4,227 9%<br />
Public programs & spot rentals 3,116 6% 2,599 6%<br />
Youth hockey leagues 2,698 5% 2,542 5%<br />
Soccer field rentals 1,122 2% 1,078 2%<br />
Figure skating 859 2% 708 1%<br />
In house tournaments 482 1% 679 1%<br />
Other 719 1% 711 1%<br />
$51,343 100% $48,778 100%<br />
Food & Beverage<br />
Revenue from our 15 restaurant operations was $11.8 million in <strong>2010</strong>, unchanged from 2009. On a same store basis<br />
we saw our restaurant sales decrease by $0.3 million, or 3%, a similar decline to 2009. Food and beverage sales<br />
accounted for 17% of total revenue, 1% lower than in 2009.<br />
We have seen a decrease in overall same store sales in our restaurants, which is consistent with the industry<br />
experience in the last 12 months. We have noticed reduced traffic in our restaurants as a result of lower team counts<br />
in the ASHL in Ontario. We believe spending habits of our customers have also been impacted by changes in driving<br />
laws and the introduction of the HST in both British Columbia and Ontario. We operate all our restaurants in-house<br />
to ensure our customers receive quality products and service. The product mix between food sales and liquor sales<br />
has changed slightly this year to 56% and 44% respectively, compared to 55% and 45% in previous years.<br />
<strong>Sports</strong> Stores<br />
During the year, <strong>Canlan</strong> operated ten sports stores that occupy approximately 6,600 square feet in our buildings.<br />
The Company rents to third party store operators under long term leases in another four facilities. Our sports stores<br />
generated $1.9 million in gross sales in <strong>2010</strong> compared to $2 million in 2009. <strong>Sports</strong> store revenue represents 3% of<br />
our total revenue. Skate sharpening revenue was $0.6 million, similar to 2009.<br />
Management Contracts<br />
Management services revenue is comprised of fees for managing ice rink facilities on behalf of owners and one-time<br />
consulting engagements. Our management services division generated management fee revenue in <strong>2010</strong> totaling<br />
$0.3 million, compared to $0.4 million in 2009. Currently we have four active management contracts, one less than<br />
in 2009.<br />
Tournament Operations<br />
The <strong>Canlan</strong> Classic Tournaments (CCT) was formed ten years ago to grow our in-house tournament business in<br />
the seasonally slow summer months, and reduce our reliance on third party tournament operators. This division<br />
continues to grow, and in <strong>2010</strong> held 51 tournaments (2009 – 46 tournaments) and generated $1.8 million in total<br />
revenue, compared to $1.6 million in 2009. While the majority of the CCT events are held in <strong>Canlan</strong> facilities, which<br />
increase our own ice and retail utilization, the division is diversifying and holds a number of tournaments outside<br />
our buildings, including Florida and Las Vegas.<br />
16 <strong>Canlan</strong> <strong>Ice</strong> <strong>Sports</strong> Corp. <strong>2010</strong> <strong>Annual</strong> <strong>Report</strong>
Other revenue<br />
N ICE<br />
Management Discussion & Analysis<br />
Other sources of revenue totaled $2.3 million in <strong>2010</strong> compared to $2.6 million in 2009. We often rent space within<br />
our buildings to complimentary types of business. We also include revenue from renting out our entire facility<br />
located in Candiac, Quebec, pursuant to the terms of an operating lease. In <strong>2010</strong> we recorded $1 million in facility<br />
and space rental revenue which is similar to 2009.<br />
Another significant component of other revenue is sponsorship revenue. During the year we had a dedicated<br />
advertising & sponsorship sales person whose sole responsibility was to develop relationships with a variety of<br />
national companies and sell our many opportunities. In <strong>2010</strong> we generated $1 million in sponsorship revenue<br />
compared to $0.7 million in 2009, a 31% increase.<br />
Revenue by business segment and geographic region:<br />
in thousands <strong>2010</strong> 2009<br />
Sales % of total Sales % of total<br />
<strong>Ice</strong> Sales $51,343 74.1% $48,778 72.6%<br />
Restaurant and Lounge 11,767 16.8% 11,804 17.5%<br />
<strong>Sports</strong> Store 1,960 2.8% 1,990 3.0%<br />
Tournament Division 1,785 2.6% 1,589 2.4%<br />
Management Fees & Consulting 286 0.4% 390 0.6%<br />
Other 2,708 3.3% 2,645 3.9%<br />
$69,849 100.0% $67,196 100.0%<br />
<strong>2010</strong> 2009<br />
in thousands Sales % of total Sales % of total<br />
Canada:<br />
British Columbia $17,005 24% $16,738 24.9%<br />
Alberta $139
ANLA<br />
Management Discussion & Analysis<br />
Revenue by Quarter<br />
The Company recorded the following revenue by quarter in <strong>2010</strong>. The revenue stream is seasonal with 57% of the<br />
Company’s revenue being generated in the fall and winter months (first and fourth quarters) and 43% in the spring<br />
and summer season (second and third quarters).<br />
<strong>2010</strong> 2009<br />
in thousands Revenue % of total Revenue % of total<br />
Q1 $19,873 28% $19,445 29%<br />
Q2 15,745 23% 14,606 22%<br />
Q3 14,215 20% 13,582 20%<br />
Q4 20,016 29% 19,563 29%<br />
Direct Operating Costs<br />
$69,849 100% $67,196 100%<br />
Total ice rink operating costs were $55.6 million in <strong>2010</strong> compared to $52.1 million in 2009, an increase of 6.7%.<br />
In <strong>2010</strong>, ice rink operating costs, including cost of goods sold in our restaurants and sports stores, represented 80%<br />
of revenue compared to 78% in <strong>2010</strong>. Also included in operating costs are facility and land lease payments related to<br />
five of our facilities. In <strong>2010</strong> rent payments totaled $1.4 million, compared to $1.1 million in 2009; the increase was<br />
related to the addition of Fort Wayne during the year.<br />
<strong>Ice</strong> rink operating costs are less seasonal than revenue, as our business does have a fixed cost component to it.<br />
<strong>2010</strong> 2009<br />
in thousands Costs % of total Costs % of total<br />
Q1 $14,025 25% $13,463 26%<br />
Q2 14,320 26% 13,036 25%<br />
Q3 13,169 24% 12,358 24%<br />
Q4 14,051 25% 13,285 25%<br />
$55,565 100% $52,142 100%<br />
Our five largest operating expenses, excluding corporate general and administration (G & A) expenses are as follows:<br />
in thousands <strong>2010</strong> 2009<br />
Wages $19,842 $17,810<br />
Utilities 6,833 6,456<br />
League operating costs 6,246 5,869<br />
Repairs and maintenance 3,032 2,860<br />
Property taxes 2,488 2,579<br />
$38,441 $35,574<br />
18 <strong>Canlan</strong> <strong>Ice</strong> <strong>Sports</strong> Corp. <strong>2010</strong> <strong>Annual</strong> <strong>Report</strong>
Wages<br />
N ICE<br />
Labour is our largest expense and represents 36% of our direct operating<br />
costs, compared to 34% in 2009. We continually monitor labour rates<br />
to stay competitive in all markets. Four of our facilities are subject to<br />
collective agreements with two different unions. On January 1, <strong>2010</strong><br />
we established a company sponsored RRSP program that allows eligible<br />
employees to contribute up to 4% of their wages to a retirement savings<br />
plan, which the Company matches.<br />
Utilities<br />
Utility expenses include the cost of electricity, gas and water. Total utility<br />
expense in <strong>2010</strong> represented 12% of our operating costs, similar to 2009.<br />
While we have entered into long term purchase contracts for electricity<br />
and gas when possible and have been successful in reducing consumption,<br />
we have seen an increase in our utility costs. As a result of the record<br />
low spot market for electricity, our electricity expense in Ontario has<br />
been subject to an extra charge called the Provincial Benefit. This is an<br />
additional charge being levied to close the gap between the spot market<br />
price and the price required for Ontario power producers to ensure the<br />
reliability of providing adequate generating capacity for Ontario. In<br />
spite of hydro purchase contracts <strong>Canlan</strong> entered into several years ago to<br />
stabilize our purchase price, we do not benefit from the low spot market<br />
for electricity, but are still subject to this additional charge.<br />
In <strong>2010</strong>, the additional electricity expense, as a result of the Ontario<br />
Provincial Benefit levy, was $0.5 million similar to what was charged in<br />
2009.<br />
In 2008 we hired a full time Director of Energy Management whose primary<br />
responsibility is to reduce energy consumption and manage our capital<br />
assets. We have seen the benefits of this new position. In <strong>2010</strong> we reduced<br />
our energy consumption, on a same store basis, by 1.6%. In financial<br />
terms we have saved $147,000 as a result of reduced consumption. In<br />
addition, we have been able to take advantage of financial incentives<br />
offered by Provincial energy conservation programs where the Provincial<br />
entities pay for a portion of capital costs spent on upgrading plant<br />
equipment that result in energy savings. In <strong>2010</strong>, <strong>Canlan</strong> spent $0.4<br />
million on such capital projects and received $0.1 million in financial<br />
incentives. We expect these projects, along with continued improvements<br />
in our best-practice guides, to result in more benefits in 2011 and beyond.<br />
League Operating Costs<br />
Management Discussion & Analysis<br />
Repairs and Maintenance<br />
In <strong>2010</strong>, we spent $3.0 million maintaining our buildings and equipment,<br />
which is consistent with 2009. This includes maintaining our fleet of 51 ice<br />
resurfacers, refrigeration equipment, building envelopes and parking lots.<br />
We use a computerized facility asset management system to ensure our<br />
preventative maintenance program is kept current and to aid in planning<br />
future capital projects.<br />
Property Taxes<br />
<strong>Canlan</strong> pays property tax in the various jurisdictions in which our<br />
seventeen owned and leased buildings are situated. In <strong>2010</strong> we paid $2.5<br />
million to local municipalities on account of property taxes. The amount<br />
paid in <strong>2010</strong> decreased as a result of a successful property tax appeal<br />
related to our facility in Vineland, New Jersey. The successful appeal was<br />
retroactive to 2009, and we recovered $0.1 million of property taxes paid<br />
related to 2009. Property tax assessments are reviewed annually to ensure<br />
our properties are assessed appropriately.<br />
Operating Margin before General and Administration expenses<br />
Operating margin is calculated as revenue less operating expenses<br />
expressed as a percentage of revenue. Operating margin for <strong>2010</strong> was<br />
20.4%, a decrease from 2009 which was 22.4%. The reduction in our<br />
operating margin was primarily a result of lower revenue growth compared<br />
to the increase in operating costs. As previously discussed, our same store<br />
revenue increased by 1.8% over last year, while our same store operating<br />
costs have increased by 3%.<br />
A contributing factor to lower than historical same store revenue growth<br />
was due to our strategy to keep price increases to a minimum. Price<br />
increases were kept low to help offset the effects of HST in British<br />
Columbia and Ontario and the lingering impact of the economic downturn<br />
from 2009.<br />
General and Administration Expenses<br />
Corporate G&A expenses were $4.8 million in <strong>2010</strong>, compared to $4.1<br />
million in 2009, representing an increase of $0.7 million, or 16.5%. G &<br />
A represents 6.9% of total revenue in <strong>2010</strong>, compared to 6.2% in 2009.<br />
Wages and related benefits accounted for 66% ($3.2 million) of our<br />
corporate general and administration expenses in <strong>2010</strong> compared to 63%<br />
($2.6 million) in 2009.<br />
Our league operating costs are variable and are directly related to volume<br />
in the ASHL. League expenses include the cost of officiating, accident<br />
insurance, statistics and prizing, in addition to ice rental costs for our two<br />
satellite leagues, located in Richmond BC, and Hamilton ON.<br />
Corporate wages include compensation expense related to the Stock<br />
Appreciation Rights (SARs) plan, which was established in 2005 and made<br />
available to the Company’s executives and directors. We expensed $0.4<br />
million in <strong>2010</strong> related to the SARs program, compared to $0.2 million in<br />
2009. A net change of $0.2 million, that was a direct result of the increase<br />
in market value of TSX: ICE.<br />
<strong>Canlan</strong> <strong>Ice</strong> <strong>Sports</strong> Corp. <strong>2010</strong> <strong>Annual</strong> <strong>Report</strong><br />
19
ANLA<br />
Management Discussion & Analysis<br />
During the year the Company made various personnel changes the cost of which has been expensed in <strong>2010</strong>. The<br />
Company also established a Company sponsored RRSP program and a Director retirement account. The combined<br />
corporate cost of these two programs was $0.2 million and was expensed in <strong>2010</strong>.<br />
Historically, the Company has been liable for Provincial Capital taxes in Quebec, Ontario and Manitoba. These<br />
jurisdictions began phasing out capital taxes in <strong>2010</strong>, thereby reducing our capital tax expense by approximately<br />
$0.1 million.<br />
Other expenses included in G&A are as follows:<br />
• Professional fees<br />
• Listing fees and investor relations<br />
• Director fees<br />
• Travel<br />
• Office<br />
Our administration expenses are generally consistent throughout the year.<br />
<strong>2010</strong> 2009<br />
in thousands Expense % of total Expense % of total<br />
Q1 $1,163 24% $959 23%<br />
Q2 1,127 24% 1,140 27%<br />
Q3 1,186 25% 1,185 29%<br />
Q4 1,277 27% 855 21%<br />
$4,753 100% $4,139 100%<br />
EBITA<br />
After accounting for ice rink operating costs of $55.6 million (2009: $52.1 million) and G&A expenses of $4.8 million<br />
(2009: $4.1 million), earnings before Interest, taxes and Amortization (EBITA) and gain on financial instruments<br />
decreased by $1.5 million to $9.5 million, a decrease of 13%.<br />
EBITA by Quarter<br />
The Company recorded the following EBITA by quarter in <strong>2010</strong> and 2009:<br />
<strong>2010</strong> 2009<br />
in thousands EBITA % of total EBITA % of total<br />
Q1 $4,685 49% $5,023 46%<br />
Q2 298 3% 430 4%<br />
Q3 (140) (1%) 39 -<br />
Q4 4,688 49% 5,423 50%<br />
$9,531 100% $10,915 100%<br />
20 <strong>Canlan</strong> <strong>Ice</strong> <strong>Sports</strong> Corp. <strong>2010</strong> <strong>Annual</strong> <strong>Report</strong>
N ICE<br />
As demonstrated by the accompanying chart, and consistent with our<br />
quarterly revenue stream, our industry is extremely seasonal. The Company<br />
generates the vast majority of its operating profit during the fall and<br />
winter seasons (first and fourth quarters) that produce 57% (2009 - 58%)<br />
of our total revenue. This seasonality contributes to quarterly variability<br />
of our earnings because a significant portion of our operating costs are<br />
relatively fixed.<br />
$25.0<br />
$20.0<br />
Management Discussion & Analysis<br />
Review of <strong>2010</strong> Non-operating Expenses<br />
Amortization<br />
Amortization expense of $4.8 million in <strong>2010</strong>, an increase of $0.3 million<br />
due to asset additions included the leasehold improvements in our Fort<br />
Wayne facility.<br />
The Company’s amortization policy was unchanged during the year. The<br />
policy calls for straight-line amortization of ice rink assets over periods<br />
ranging from five years to forty years.<br />
$15.0<br />
$10.0<br />
$5.0<br />
Revenue<br />
Costs<br />
EBITA<br />
Interest Expense<br />
Interest expense related to the financing of our facilities and equipment<br />
leases decreased by 7% to $3.3 million from $3.5 million in 2009 as a<br />
result of scheduled principal reductions.<br />
$0.0<br />
Q1 Q2 Q3 Q4<br />
A breakdown of our interest expense is as follows:<br />
Gross Margin<br />
Gross margin is calculated as revenue less operating and general and<br />
administration expenses expressed as a percentage of revenue. Gross<br />
margin for <strong>2010</strong> was 13.6% compared to 16.2% in 2009.<br />
Comments on US operations<br />
Currently we are operating two multi pad facilities in the United States.<br />
Our newest building is located in Fort Wayne, Indiana and commenced<br />
operations in February <strong>2010</strong>. During the year much attention was placed<br />
on ramping up facility operations and marketing this brand new facility<br />
to the community. As a result of a mid season start up, revenue was lower<br />
than planned and expenses were as expected which resulted in operating<br />
losses in its first year of operations. Our lease agreement did provide for<br />
rent abatement in year 1, as a result of the delayed opening. Management<br />
believes that our Fort Wayne facility will approach break even in 2011, and<br />
begin to contribute positive earnings shortly thereafter.<br />
Our second US facility is located in Vineland, New Jersey. We commenced<br />
operations in September 2008, pursuant to a 52 month operating lease.<br />
While the operating results of this two-pad facility improved over the<br />
prior year, it still has not reached breakeven as a result of lower than<br />
expected revenue. Management continues to explore new ways to increase<br />
utilization in this building.<br />
in thousands <strong>2010</strong> 2009<br />
Mortgage interest $3,095 $3,197<br />
Equipment lease interest 105 123<br />
Dividend on preferred shares - 126<br />
Amortization of deferred financing<br />
costs and other<br />
96 96<br />
$3,296 $3,542<br />
The preferred shares issued as part of the financing of the York acquisition<br />
in 2006 included a 12% dividend, paid quarterly, which was recorded<br />
as interest expense, pursuant to the Canadian Institute of Chartered<br />
Accountants (CICA) accounting standards. The Company redeemed the<br />
remaining 1.4 million 12% preferred shares on September 30, 2009, and<br />
paid the final dividend on that date.<br />
At year end, the Company had interest bearing, mortgage secured debt<br />
totaling $44.3 million (2009 – $47 million).<br />
The Company has fixed the interest rate on 87% of its mortgage debt, or<br />
$38.7 million at a weighted average rate of 6.74%. The remaining debt,<br />
totaling $5.7 million has a variable interest rate of prime plus 1.25%.<br />
Costs related to debt financing are amortized using the effective interest<br />
rate method in accordance with GAAP and classified as interest expense.<br />
In <strong>2010</strong> this amounted to $0.1 million, same as 2009.<br />
<strong>Canlan</strong> <strong>Ice</strong> <strong>Sports</strong> Corp. <strong>2010</strong> <strong>Annual</strong> <strong>Report</strong><br />
21
ANLA<br />
Management Discussion & Analysis<br />
Loss on held-for-trading financial liabilities<br />
As part of the $50 million refinancing that was completed on July 31, 2008 the Company entered into an interest<br />
rate swap to fix the interest rate on $13 million of the loan for a term of three years. The accounting for this interest<br />
rate swap is subject to rules for financial instruments pursuant to section 3855 of the CICA handbook. The fair value<br />
of this instrument of $0.2 million (2009 - $0.6 million) has been presented as a current liability. The reduction in the<br />
fair value of this liability from the prior year is $0.3 million. This expense recovery, although unrealized, has been<br />
fully recognized in the current year.<br />
Net Earnings before Income Taxes<br />
Net earnings before income taxes were $1.8 million in <strong>2010</strong> compared to $3.3 million in 2009; a decrease of $1.5<br />
million, similar to the reduction in EBITA. The <strong>2010</strong> net earnings results include a $0.3 million (2009 - $0.4 million)<br />
recovery of unrealized losses related to the interest rate swap described above.<br />
Taxes<br />
In <strong>2010</strong>, we reviewed and updated our assumptions regarding our future income tax asset to reflect the various tax<br />
pools still available to offset future income taxes. As a result of utilizing these tax pools related to tax loss carry<br />
forwards, capital cost allowance, cumulative eligible capital and a deferred revenue deductions, we are not liable to<br />
pay taxes for <strong>2010</strong>. Similar to the prior year, the Company has adjusted its future tax benefit as we have determined<br />
that the Company will benefit from its non-capital loss carry forwards and available tax pools in 2011 and beyond.<br />
The expected net future tax benefit from utilizing these available tax pools has been adjusted to $1.3 million, net<br />
of a valuation allowance for losses which originated in the USA. This decrease in the available tax pools resulted in a<br />
tax expense $1.1 million for the year ended December 31, <strong>2010</strong>, compared to a tax expense of $0.6 million in 2009.<br />
The Company has non-capital loss carry forwards available to offset future income taxes in the amount of $4.7<br />
million. The majority of these remaining losses originated in the USA and can be used to offset any future taxable<br />
income earned in the USA. The Company has recorded a full valuation allowance for these US tax losses.<br />
Net Earnings<br />
Net earnings after tax for the year ended December 31, <strong>2010</strong> was $0.7 million or $0.05 per share, compared to net<br />
earnings of $2.7 million in 2009 or $0.20 per share.<br />
22 <strong>Canlan</strong> <strong>Ice</strong> <strong>Sports</strong> Corp. <strong>2010</strong> <strong>Annual</strong> <strong>Report</strong>
N ICE<br />
Summary of Operations<br />
Management Discussion & Analysis<br />
in thousands <strong>2010</strong> 2009 2008<br />
Revenue<br />
<strong>Ice</strong> rinks and management contracts $69,849 $67,196 $64,669<br />
Expenses<br />
<strong>Ice</strong> rinks 55,565 52,142 49,768<br />
Earnings before general & administration 14,284 15,054 14,901<br />
General & administration 4,753 4,139 3,665<br />
EBITA 9,531 10,915 11,236<br />
Amortization 4,813 4,467 4,274<br />
Interest 3,296 3,542 3,894<br />
Loss on held for trading liability (341) (365) 933<br />
Other (78) (62) (14)<br />
7,690 7,582 9,087<br />
Net earnings before taxes 1,841 3,333 2,149<br />
Taxes, net of future tax benefit 1,134 599 (1,678)<br />
Net earnings from operations $707 $2,734 $3,827<br />
Gross margin before general & administration 20% 22% 23%<br />
Administration as a percentage of revenue 7% 6% 6%<br />
EBITA as a percentage of revenue 14% 16% 17%<br />
Summary of Quarterly Results<br />
The following tables present our unaudited consolidated quarterly results of operations for each of the last eight<br />
fiscal quarters. This data has been derived from our unaudited quarterly consolidated financial statements which are<br />
prepared on the same basis as our annual audited financial statements.<br />
<strong>2010</strong><br />
in thousands Q1 Q2 Q3 Q4 Total<br />
Gross revenue $19,873 $15,745 $14,215 $20,016 $69,849<br />
Operating costs (14,025) (14,320) (13,169) (14,051) (55,565)<br />
5,848 1,425 1,046 5,965 14,284<br />
General & administration (1,163) (1,127) (1,186) (1,277) (4,753)<br />
EBITA 4,685 298 (140) 4,688 9,531<br />
Amortization (1,198) (1,172) (1,210) (1,233) (4,813)<br />
Interest (806) (849) (827) (814) (3,296)<br />
Other 108 68 111 132 419<br />
Net earnings (loss) before taxes and other 2,789 (1,655) (2,066) 2,773 1,841<br />
Income taxes and other (787) 422 550 (1,319) (1,134)<br />
Net earnings (loss) $2,002 $(1,233) $(1,516) $1,454 $707<br />
Earnings (loss) per share $0.14 $(0.09) $(0.11) $0.11 $0.05<br />
<strong>Canlan</strong> <strong>Ice</strong> <strong>Sports</strong> Corp. <strong>2010</strong> <strong>Annual</strong> <strong>Report</strong><br />
23
ANLA<br />
Management Discussion & Analysis<br />
2009<br />
in thousands Q1 Q2 Q3 Q4 Total<br />
Gross revenue $19,445 $14,606 $13,582 $19,563 $67,196<br />
Operating costs (13,463) (13,036) (12,358) (13,285) (52,142)<br />
5,982 1,570 1,224 6,278 15,054<br />
General & administration (959) (1,140) (1,185) (855) (4,139)<br />
EBITA 5,023 430 39 5,423 10,915<br />
Amortization (1,102) (1,105) (1,117) (1,143) (4,467)<br />
Interest (918) (890) (908) (826) (3,542)<br />
Other 43 213 96 75 427<br />
Net earnings (loss) before taxes and other 3,046 (1,352) (1,890) 3,529 3,333<br />
Income taxes and other (1,064) 418 529 (482) (599)<br />
Net earnings (loss) $1,982 $(934) $(1,361) $3,047 $2,734<br />
Earnings (loss) per share $0.15 $(0.07) $(0.10) $0.23 $0.20<br />
Our business is highly seasonal in terms of when our revenue is being generated, which is demonstrated by the two<br />
year quarterly review above. 57% of our revenue is generated in the winter months. While our revenue is seasonal,<br />
our operating costs are relatively fixed, and therefore our quarterly earnings fluctuate significantly during the year.<br />
The Company reported EBITA of $9.3 million in Q1 and Q4 combined, compared to just $0.2 million in Q2 and Q3. In<br />
terms of net earnings, the Company has continually reported net losses in the spring and summer months.<br />
<strong>2010</strong> Fourth Quarter Results<br />
In Q4, the Company generated its highest quarterly revenue in its history, a total of $20 million. This represents an<br />
increase of 2% compared to $19.6 million in the same quarter last year.<br />
We currently have 2,733 teams registered across Canada and the USA for the <strong>2010</strong>/11 ASHL winter season, compared<br />
to 2,728 registered for the prior year. The ASHL represents 47% of our total ice sales, and continues to be our largest<br />
earnings contributor.<br />
Operating earnings before G&A expenses was $6.0 million in the quarter compared to $6.3 million in 2009.<br />
After recording G&A expenses of $1.3 million (2009 - $0.9 million) EBITA for the fourth quarter of <strong>2010</strong> was $4.7<br />
million compared to $5.4 million in 2009.<br />
After recording interest and depreciation totaling $2.0 million and some other non operating expenses, net earnings<br />
before taxes was $2.8 million compared to $3.5 million in the fourth quarter of 2009.<br />
After adjusting for income taxes, net earnings were $1.5 million in the fourth quarter of <strong>2010</strong>, or $0.11 per share,<br />
compared to $3.0 million in 2009 or $0.22 per share.<br />
24 <strong>Canlan</strong> <strong>Ice</strong> <strong>Sports</strong> Corp. <strong>2010</strong> <strong>Annual</strong> <strong>Report</strong>
N ICE<br />
Three months ended December 31<br />
in thousands <strong>2010</strong> 2009<br />
Statement of Operations<br />
Data:<br />
Total revenue $20,016 $19,563<br />
Direct expenses (14,051) (13,285)<br />
5,965 6,278<br />
General & administration<br />
expenses<br />
(1,277) (855)<br />
EBITA 4,688 5,423<br />
Other expenses:<br />
Amortization (1,233) (1,143)<br />
Interest (814) (826)<br />
Other 133 75<br />
Taxes (1,320) (482)<br />
Net Earnings $1,454 $3,047<br />
Basic and diluted earnings<br />
per share<br />
$0.11 $0.23<br />
Review of Assets<br />
The total book value of the Company’s assets as at December 31, <strong>2010</strong> was<br />
$110 million compared to $113 million at December 31, 2009.<br />
The table below summarizes the Company’s asset base:<br />
Management Discussion & Analysis<br />
Fort Wayne. The Company also leased five new ice resurfacing machines<br />
during the year. These expenditures, together with scheduled amortization<br />
of our assets, resulted in a net decrease to the book value of our ice rink<br />
properties.<br />
We expect to spend up to $2.0 million on capital expenditures annually in<br />
the foreseeable future as part of our long term capital plan.<br />
Review of Liabilities and Shareholders<br />
Equity<br />
The table below summarizes the Company’s capital structure:<br />
in thousands <strong>2010</strong> 2009<br />
Mortgages payable $44,022 $46,595<br />
Deferred revenue and<br />
customer deposits<br />
11,022 12,019<br />
Accounts payable 5,262 5,360<br />
Capital leases 1,455 1,446<br />
Future income taxes 1,845 1,387<br />
Financial liability held for<br />
trading<br />
227 568<br />
63,833 67,375<br />
Shareholders’ equity 46,680 46,173<br />
Shareholders’ equity per<br />
common share<br />
$110,513 $113,548<br />
$3.50 $3.46<br />
in thousands <strong>2010</strong> 2009<br />
<strong>Ice</strong> rink properties $94,128 $95,922<br />
Cash 8,903 9,213<br />
Accounts receivable 1,519 1,845<br />
Inventory 1,041 1,024<br />
Prepaid expenses and other<br />
assets<br />
895 841<br />
Land held for ice rink<br />
development<br />
856 856<br />
Future income taxes 3,171 3,847<br />
$110,513 $113,548<br />
Property, plant and equipment makes up 86% of our total asset base is<br />
comprised of land, building and equipment. During the year we spent<br />
$1.8 million on a variety of capital expenditure projects to renovate and<br />
improve our ice rink facilities using cash on hand. In addition we spent<br />
$0.5 million on leasehold improvements related to our newest facility in<br />
Total interest-bearing debt, which includes mortgages payable, preferred<br />
shares, and capital leases totaled $45.5 million as at December 31, <strong>2010</strong>,<br />
compared to $48 million at the end of fiscal 2009, a net decrease of<br />
$2.5 million. For financial statement presentation, our long-term debt<br />
is recorded net of related transaction costs, pursuant to the effective<br />
interest rate method of accounting for deferred financing costs.<br />
Mortgages<br />
At December 31, <strong>2010</strong>, total loans consist of three credit facilities, and<br />
has a combined annual debt service of $5.8 million. Our annual principal<br />
reduction based on scheduled mortgage repayments will be $2.7 million in<br />
2011.<br />
Specific terms of the three credit facilities are as follows:<br />
• $30 million loan maturing July 15, 2018, fixed interest rate of 6.79%<br />
per annum, amortized over 20 years with interest payable monthly and<br />
seasonal principal payments of $375,000 per month from September<br />
15 to December 15 annually.<br />
<strong>Canlan</strong> <strong>Ice</strong> <strong>Sports</strong> Corp. <strong>2010</strong> <strong>Annual</strong> <strong>Report</strong><br />
25
ANLA<br />
Management Discussion & Analysis<br />
• $13 million loan maturing September 30, 2011, variable interest rate<br />
of Prime plus 1.25%, amortized over 15 years with blended monthly<br />
payments. The Company has entered into an interest rate swap<br />
agreement to fix the interest rate on the principal borrowed at a<br />
rate of 4.12% per annum, plus applicable stamping fee at 2.5%. The<br />
interest rate for this loan has been fixed at 6.62%.<br />
• $7 million loan maturing September 30, 2011, variable interest rate<br />
of Prime plus 1.25%, amortized over 12 years with blended monthly<br />
payments. The prime rate is currently 3%.<br />
On March 22, 2011, the two credit facilities that mature on September 30,<br />
2011 were renewed by the Company’s Bank; therefore, they now mature<br />
on September 30, 2014. The interest rate and other terms of the renewed<br />
loans are similar to the current terms.<br />
In addition, the Bank also provided a $5 million revolving loan that<br />
the Company can use as bridge financing for potential future property<br />
acquisitions.<br />
We are in full compliance with all our debt covenants as at December 31,<br />
<strong>2010</strong>.<br />
Summarized statement of cash flows:<br />
in thousands <strong>2010</strong> 2009 2008<br />
Cash inflows and (outflows)<br />
by activity<br />
Operating activities $5,428 $8,050 $8,513<br />
Financing activities (3,308) (4,592) (3,159)<br />
Investing activities (2,430) (1,833) (2,336)<br />
(310) 1,625 3,018<br />
Cash position, beginning of<br />
year<br />
9,213 7,588 4,570<br />
Cash position, end of year $8,903 $9,213 $7,588<br />
Key ratios<br />
Working Capital $(5,277) $(5,262) $(8,213)<br />
Debt to equity ratio 1:1 1.05:1 1.20:1<br />
Customer Deposits and Deferred Revenue<br />
The largest single component of our current liabilities is comprised of<br />
deferred revenue related to league registrations and customer deposits<br />
received in advance which totaled $11 million as at December 31, <strong>2010</strong><br />
(2009 - $12 million). We recognize revenue as the ice is used; many of<br />
the seasonal contracts and league registrations are paid in advance as are<br />
league registrations.<br />
Capital Leases<br />
We use capital leases to finance the acquisition of various types of heavy<br />
equipment used in our facilities as well as ice resurfacers. In <strong>2010</strong> we<br />
acquired five new ice resurfacers and installed a new dehumidification<br />
system at <strong>Ice</strong> <strong>Sports</strong> Oshawa. The majority of our equipment leases have a<br />
term of five years.<br />
Liquidity and Capital Resources<br />
<strong>Canlan</strong>’s cash balance as at December 31, <strong>2010</strong> was $8.9 million, a decrease<br />
of $0.3 million from December 31, 2009. During the year we reduced<br />
our mortgage debt by $2.6 million, and spent $2.3 million on capital<br />
expenditures.<br />
Our balance sheet at the end of <strong>2010</strong> indicated a working capital<br />
deficiency of $5.3 million, consistent with 2009.<br />
The Company’s debt to equity ratio continues to improve and was 1:1 at<br />
the end of the year, compared to 1.05:1 last year. The ratio has decreased<br />
as a result of scheduled principal reductions of debt, combined with an<br />
increase in shareholders’ equity through net earnings. This ratio should<br />
continue to improve as debt levels decrease and the Company remains<br />
profitable.<br />
Cash Flow<br />
Our cash position fluctuates during the year as a result of the seasonality<br />
of our business, historically the highest cash position is December and<br />
lowest occurs in August. We generally collect registration fees for the ASHL<br />
in the first 3 months of each season, and program fees are collected upon<br />
registration.<br />
The Company cash position decreased slightly to $8.9 million compared<br />
to $9.2 million year ago. The decrease can be attributable to reduced<br />
operating earnings and timing differences of some working capital items.<br />
A strong year end cash position, together with seasonal principal payments<br />
related to 60% of our debt will benefit the Company in the negative<br />
cash flow months. We have built sufficient cash reserves to manage the<br />
seasonality of our business without having to borrow.<br />
The Company generated cash flow from operations before borrowing<br />
costs, debt principal and capital expenditures totaling $9.5 million. After<br />
providing for borrowing costs of $3.3 million, a $6.2 million positive cash<br />
flow resulted before principal repayments, preferred share redemption and<br />
capital expenditures.<br />
26 <strong>Canlan</strong> <strong>Ice</strong> <strong>Sports</strong> Corp. <strong>2010</strong> <strong>Annual</strong> <strong>Report</strong>
N ICE<br />
The Company made scheduled principal repayments during the year totaling $2.7 million.<br />
Management Discussion & Analysis<br />
Subject to the terms of the expected refinancing, total cash required to service our mortgage debt is expected to be<br />
$5.6 million in 2011.<br />
The following table provides a reconciliation of EBITA to the change in cash position for the last two years:<br />
in thousands <strong>2010</strong> 2009<br />
Earnings before Interest, Taxes and Amortization (EBITA) $9,531 $10,915<br />
Changes in working capital items (946) 551<br />
Interest expense (3,296) (3,542)<br />
Other 139 126<br />
Cash flow from operations 5,428 8,050<br />
Less:<br />
Mortgage principal reduction, net of refinancing (2,669) (2,606)<br />
Preferred shares (redemption) - (1,400)<br />
Capital expenditures, net of disposals (2,216) (1,883)<br />
Equipment lease payments (639) (586)<br />
Other (214) 50<br />
Change in cash position for the year $(310) $1,625<br />
On December 6, <strong>2010</strong> the Company announced the introduction of a quarterly dividend in the amount of $0.015 per<br />
common share. The first dividend was paid on January 17, 2011 to shareholders of record on December 15, <strong>2010</strong>. The<br />
initiation of a quarterly dividend reflects our continued confidence in our ability to generate strong consistent cash<br />
flow while paying down debt.<br />
Contractual Obligations and Off Balance Sheet Arrangements<br />
The following table presents the aggregate amount of future cash outflows for contractual obligations in each of the<br />
next five years and thereafter. The operating leases listed below for land and buildings fit the definition of off –<br />
balance sheet financing arrangements.<br />
in thousands 2011 2012 2013 2014 2015 Thereafter Total<br />
Long-term debt:<br />
Mortgage principal and interest $21,561 $3,228 $3,120 $3,024 $2,916 $22,685 $56,534<br />
Equipment leases, includes interest 632 489 370 187 61 - 1,739<br />
22,193 3,717 3,490 3,211 2,977 22,685 58,273<br />
Land and building leases 1,727 1,743 1,465 1,469 1,318 20,498 28,220<br />
Off balance sheet financing 1,727 1,743 1,465 1,469 1,318 20,498 28,220<br />
$23,920 $5,460 $4,955 $4,680 $4,295 $43,183 $86,493<br />
<strong>Canlan</strong> <strong>Ice</strong> <strong>Sports</strong> Corp. <strong>2010</strong> <strong>Annual</strong> <strong>Report</strong><br />
27
ANLA<br />
Management Discussion & Analysis<br />
Share Capital<br />
Transactions with Related Parties<br />
No new shares have been issued from treasury since November 2004, and<br />
the Company does not have a stock option plan.<br />
<strong>2010</strong> 2009<br />
Shares issued and<br />
outstanding 13,337,448 13,337,448<br />
Weighted average number of<br />
shares outstanding 13,337,448 13,337,448<br />
The Company established a stock appreciation rights (S ARs) plan in<br />
2005. The SARs plan provides eligible employees and directors with the<br />
right to receive cash equal to the appreciation of the Company’s common<br />
shares subsequent to the date of the grant. The granted SAR’s vest in equal<br />
installments over a three year period and expire five years from the grant<br />
date.<br />
The Company has outstanding stock appreciation rights as follows:<br />
<strong>Canlan</strong>’s controlling shareholder, Bartrac Investments Ltd., owns<br />
approximately 10.1 million shares of the Company, or 75% of the<br />
outstanding shares. Bartrac’s ownership position in TSX: ICE has remained<br />
unchanged since November 2004.<br />
The Company did not record any related party transactions with Bartrac in<br />
<strong>2010</strong>. During 2009 the Company did pay dividends totaling $0.2 million<br />
related to the issuance of preferred shares. The preferred shares were<br />
redeemed in 2009.<br />
The Chairman of the Board of Directors of the Company is a Director of a<br />
vendor from which the Company purchases services in the normal course<br />
of business. Purchases from this vendor for the year ended December 31,<br />
<strong>2010</strong> was $45,000 (2009 - $30,000).<br />
A Director of the Company is the Chairman of the Board of Directors of a<br />
vendor from which the Company purchases services in the normal course<br />
of business. Purchases from this vendor for the year ended December 31,<br />
<strong>2010</strong> was $45,000 (2009 - $30,000).<br />
Number of<br />
Exercise<br />
Expiry date Rights Price<br />
November 28, 2011 35,000 $ 1.20<br />
November 25, 2013 105,750 $ 0.80<br />
April 15, 2014 35,000 $ 1.50<br />
November 30, 2013 562,000 $ 2.00<br />
737,750<br />
During the year all remaining rights related to the initial 2005 SARS<br />
program were exercised; 579,500 rights were exercised at a cash cost of<br />
$458,000, the net expense recorded in <strong>2010</strong> related to the SARS program<br />
was $0.4 million.<br />
On November 30, <strong>2010</strong> the Board of Directors approved a new SARS<br />
program to replace the 2005 plan. 562,000 SARS were granted to<br />
executives and directors of the Company with an exercise price of $2.00.<br />
These new rights vest over a three year period and expire on November 30,<br />
2013. The first one third of these SARs will vest on November 30, 2011<br />
The liability related to the SARs program is adjusted quarterly and is based<br />
on the 10-day trading average closing price. As at December 31, <strong>2010</strong> the<br />
Company recorded a liability in the amount of $0.2 million and this amount<br />
was expensed. As at December 31, <strong>2010</strong> the 10 day average closing price<br />
was $2.07.<br />
Financial Instruments<br />
The Company initially measures all its financial instruments at fair value.<br />
Subsequent measurement and treatment of any gain of loss is recorded as<br />
follows:<br />
• Held for trading financial liabilities are measured at the fair value at<br />
the balance sheet date with any gain or loss recognized immediately<br />
in net income. The Company has entered into an interest-rate-swap<br />
agreement to fix the interest rate on a portion of its debt on ice<br />
rinks. The fair value of the instrument has been presented as a<br />
current liability on the balance sheet. At December 31, <strong>2010</strong>, the fair<br />
value was $0.2 million, compared to $0.6 million last year. Changes<br />
in the fair value of the instrument are recognized in net earnings.<br />
For the year ended December 31, <strong>2010</strong>, an expense recovery of $0.3<br />
million was recognized, compared to a recovery of $0.4 million in<br />
2009.<br />
• Transaction costs that are directly attributable to the issuance of<br />
financial assets or liabilities are accounted for as part of the carrying<br />
cost at inception and are recognized over the term of assets or<br />
liabilities using the effective interest method.<br />
The Company does not have held to maturity investments at December<br />
31, <strong>2010</strong>. The Company had no “other comprehensive income or loss”<br />
transactions during the year ended December 31, <strong>2010</strong> and no opening or<br />
closing balances for accumulated other comprehensive income or loss.<br />
28 <strong>Canlan</strong> <strong>Ice</strong> <strong>Sports</strong> Corp. <strong>2010</strong> <strong>Annual</strong> <strong>Report</strong>
N ICE<br />
International Financial <strong>Report</strong>ing<br />
Standards<br />
In February 2008 the CICA’s Accounting Standards Board confirmed<br />
its strategy of replacing Canadian GAAP with International Financial<br />
<strong>Report</strong>ing Standards (IFRS) for Canadian publically accountable<br />
enterprises. IFRS will be effective for our interim and annual financial<br />
statements beginning on January 1, 2011. The conversion to IFRS will<br />
impact our accounting policies, internal control over financial reporting,<br />
and financial statement presentation and disclosure. The transition to<br />
IFRS may also affect contractual arrangements and debt covenants. We<br />
have established a conversion plan and an IFRS project team. Starting in<br />
the first quarter of 2011, the Company will provide unaudited consolidated<br />
financial statements in accordance with IFRS including comparative figures<br />
for <strong>2010</strong>.<br />
The key elements of <strong>Canlan</strong>’s IFRS transition plan and progress are set out<br />
below. The IFRS transition is progressing as planned. This information is<br />
provided to allow readers to better understand <strong>Canlan</strong>’s transition plan and<br />
the resulting effects on its financial reporting. It is not appropriate to<br />
use this information for any other purpose. In addition, this information<br />
reflects our most recent assumptions and expectations. Circumstances<br />
may arise, such as change in IFRS, regulations or economic conditions<br />
which could change these assumptions and expectations.<br />
1. Canadian GAAP and IFRS Differences<br />
Management has completed an in-depth qualitative analysis of<br />
differences between Canadian GAAP and IFRS that will impact <strong>Canlan</strong>’s<br />
financial reporting. The key differences are related to the following<br />
areas:<br />
a) Property, plant and equipment re: measurement of carry amounts,<br />
component accounting, and start-up costs<br />
b) Impairment<br />
c) Employee benefits re: share-based compensation<br />
d) Investment properties re: balance sheet classification<br />
e) Leases<br />
f) Deferred income tax<br />
These areas of difference are discussed in more detail below. See<br />
“Reconciliation of Canadian GAAP to IFRS.”<br />
2. Application of IFRS 1 – First-time adoption<br />
Management has completed a review of IFRS 1 – First time adoption,<br />
and determined the relevant sections of this standard that will impact<br />
<strong>Canlan</strong>’s financial reporting. <strong>Canlan</strong>’s date of transition is set at<br />
January 1, <strong>2010</strong>. IFRS 1 requires that IFRSs are applied retrospectively<br />
at the date of transition with all adjustment to assets and liabilities<br />
taken to retained earnings, unless certain exemptions are applied. The<br />
Company elected to take the following IFRS 1 optional exemption:<br />
Management Discussion & Analysis<br />
Borrowing Costs – this exemption permits an entity to apply the<br />
provisions of IAS 23 on borrowing costs on a prospective basis, after<br />
the transition date. IAS 23 provides guidance on the capitalization of<br />
borrowing costs that are directly attributable to qualifying assets that<br />
are part of major development or construction projects.<br />
This exemption was elected because it was infeasible to perform the<br />
necessary detailed analysis of historical borrowing costs incurred<br />
upon construction of ice rink facilities. The application of this<br />
optional exemption has been approved by the Audit Committee.<br />
3. Systems and Processes<br />
Management has assessed the processes required in its accounting<br />
systems and procedures to ensure the Canadian GAAP vs IFRS<br />
differences identified above can be quantified as at the transition<br />
date and at each reporting date beginning March 31, 2011. Changes<br />
to worksheets and systems, as well as training for employees related<br />
to impacted areas are ongoing.<br />
4. Financial statement preparation<br />
An IFRS opening balance sheet as at the transition date, January<br />
1, <strong>2010</strong> is required to be included in the Company’s first set of IFRS<br />
financial statements. This balance sheet will serve as the opening<br />
position upon which <strong>2010</strong> results of operations under IFRS will be<br />
reported. The <strong>2010</strong> IFRS results of operations will be presented as<br />
comparative information at each reporting period beginning on March<br />
31, 2011.<br />
Management has quantified the effects of conversion to IFRS. An<br />
opening balance sheet and related note disclosures as at January<br />
1, <strong>2010</strong> that complies with IFRS 1 has been prepared. This opening<br />
balance sheet has been audited by the Company’s auditors and<br />
approved by the Audit Committee.<br />
For financial statements at each reporting date beginning on March<br />
31, 2011, management is in the process of developing the appropriate<br />
financial statement format and note disclosures. Where IFRS allows<br />
for two or more alternative accounting policies, management has<br />
selected the most appropriate accounting policy and this has been<br />
approved by the Audit Committee (discussed below). The March<br />
31, 2011 consolidated financial statements will be reviewed by the<br />
Company’s auditors.<br />
5. Business Activities<br />
The potential impact of the transition to IFRS on the Company’s loan<br />
covenants have been assessed and no significant impact is expected.<br />
<strong>Canlan</strong> <strong>Ice</strong> <strong>Sports</strong> Corp. <strong>2010</strong> <strong>Annual</strong> <strong>Report</strong><br />
29
ANLA<br />
Management Discussion & Analysis<br />
6. Control Environment<br />
Management has determined that the day-to-day systems of internal<br />
controls will not be affected by the transition to IFRS. Changes<br />
to controls over financial reporting and disclosures are ongoing.<br />
Review of the IFRS transition project and necessary approvals are<br />
being conducted by the Audit Committee on a quarterly basis or more<br />
frequently if required.<br />
Changes in regulations, economic conditions, business activities or<br />
other facts and circumstances could affect the conversion plan and<br />
result in changes to the key activities and planned milestones.<br />
Reconciliation of Canadian GAAP to IFRS<br />
In preparing the IFRS opening balance sheet, the Company has adjusted<br />
amounts reported previously in financial statements prepared in<br />
accordance with Canadian GAAP. Explanations of how the transition from<br />
Canadian GAAP to IFRSs will affect the Company’s financial position and<br />
how these sections are expected to affect the financial statements going<br />
forward are as follows:<br />
Property, plant and equipment (PP&E)<br />
(a) Measurement and Valuation<br />
Under Canadian GAAP, PP&E is recorded at historical cost net of<br />
accumulated depreciation, and revaluations are not permitted.<br />
Under IFRS, the Company may choose between the cost model or<br />
the revaluation model. Under the cost model, assets are carried at<br />
historical cost net of accumulated depreciation and accumulated<br />
impairment losses. Under the revaluation model, assets are carried at<br />
the revalued amount being the fair value at the revaluation date less<br />
subsequent accumulated depreciation and accumulated impairment<br />
losses. The revaluations must be kept up to date and fair values must<br />
be reliably measured at each reporting date.<br />
The Company will use the cost model for accounting for property, plant<br />
and equipment as this method is most appropriate given the nature of<br />
our operations.<br />
Upon transition, the Company tested each rink facility for impairment<br />
accordingly. Where a property’s carrying amount under previous<br />
Canadian GAAP was greater than its fair value or value in use under<br />
IFRS, an adjustment was made to write the carrying amount down at<br />
the transition date. The revaluation adjustment made at January 1,<br />
<strong>2010</strong> was $2.0 million.<br />
(b) Classification<br />
Under Canadian GAAP, the carrying amount of an ice rink property from<br />
which the Company holds for the purpose of earning rental income was<br />
classified as ice rink property, plant and equipment. Under IFRS, such<br />
properties are classified as investment properties. As a result, one rink<br />
property’s deemed cost of $4.5 million was reclassified from property,<br />
plant and equipment to investment property on the balance sheet.<br />
(c) Component accounting and depreciation<br />
Under IFRS, component accounting must be applied to property,<br />
plant and equipment. The Company identified rink board systems and<br />
refrigeration equipment to be two components within property, plant<br />
and equipment that should be accounted for separately and depreciated<br />
separately from buildings. Retrospective application of this accounting<br />
policy resulted in an increase to accumulated depreciation of $2.8<br />
million at January 1, <strong>2010</strong>.<br />
The changeover to component accounting will increase total<br />
depreciation expense each year beginning in 2011.<br />
(d) Start-up costs<br />
Under previous Canadian GAAP, the Company capitalized certain costs<br />
related to the start-up of newly constructed rink properties and<br />
included these costs in property, plant and equipment. Under IFRS,<br />
these costs should be expensed. The resulting adjustment made to<br />
reduce property, plant, and equipment at January 1, <strong>2010</strong> was $ 0.2<br />
million.<br />
Employee Benefits<br />
Under IFRS, liabilities related to cash-settled share-based compensation<br />
are measured at fair value at the grant date and re-measured at each<br />
reporting date. Under previous Canadian GAAP, the Company measured<br />
the liability related to its Stock Appreciation Plan at intrinsic values.<br />
As a result, an adjustment of $0.1 million was made to increase accrued<br />
liabilities at the transition date.<br />
IAS 36 provides guidance on impairment testing of PP&E and<br />
investment properties. Under this section, an asset is impaired if its<br />
carrying amount exceeds its recoverable amount. The recoverable<br />
amount is the greater of its fair value or its value-in-use. The valuein-use<br />
equals the discounted future net cash flows from the continuing<br />
use of the asset. The impairment loss equals the amount by which the<br />
carrying value exceeds its recoverable amount. Under Canadian GAAP,<br />
impairment is assessed based on whether the carrying value exceeds<br />
the sum of the undiscounted cash flows expected in the future.<br />
Deferred tax<br />
The Canadian GAAP to IFRS adjustments related to the deemed cost,<br />
componentization and start-up costs of property, plant and equipment<br />
discussed above result in an increase to the temporary differences between<br />
accounting and tax values of fixed assets. This ultimately resulted in an<br />
increase to deferred tax assets and a decrease to deferred tax liabilities<br />
at January 1, <strong>2010</strong>. On a net basis, deferred tax assets increased by $1.2<br />
million.<br />
30 <strong>Canlan</strong> <strong>Ice</strong> <strong>Sports</strong> Corp. <strong>2010</strong> <strong>Annual</strong> <strong>Report</strong>
Shareholders’ Equity<br />
N ICE<br />
The net effect of all of the above adjustments was charged to retained<br />
earnings (deficit), which reduces shareholders’ equity on the opening<br />
balance sheet.<br />
Leases<br />
Under Canadian GAAP, the classification of leases between operating and<br />
capital was based on a number of indicators that result from quantitative<br />
calculations. These quantitative thresholds served as bright line criteria<br />
and few other indicators were considered. Under IFRS, the quantitative<br />
thresholds are also used as guidance but much consideration is also<br />
given to the substance of lease agreements and classification depends on<br />
whether substantially all of the risks and rewards incidental to ownership<br />
of a leased asset have been transferred to the lessee.<br />
Under Canadian GAAP, all of the facilities leased by the Company are<br />
accounted for as operating leases. Management is currently reviewing the<br />
Lease section of IFRS to determine if changes to lease classifications are<br />
required upon transition.<br />
As the International Accounting Standards Board continues to issue new<br />
standards during our conversion period, the final impact of IFRS on our<br />
financial statements and note disclosures will only be measured once the<br />
IFRS applicable at our conversion date are known. Our transition plans<br />
relating to IFRS are on schedule and we will continue to provide updates in<br />
our quarterly MD&A.<br />
Management Discussion & Analysis<br />
Risk Factors<br />
<strong>Canlan</strong> is engaged primarily in the operation of multi-pad ice rink facilities<br />
throughout North America, and is exposed to a number of risks and<br />
uncertainties that can affect operating performance and profitability. Our<br />
past performance is no guarantee of our performance in future periods.<br />
Some of the risks and uncertainties we are exposed to, together with<br />
a description of management’s action to minimize our exposure, are<br />
summarized below.<br />
Seasonality of operations<br />
The Company’s business cycle is highly seasonal with 57% of total revenues<br />
and virtually all of the operating profit being generated in the first and<br />
last quarter. This seasonality of operations impacts reported quarterly<br />
earnings. The operating result for any particular quarter is not necessarily<br />
a good indicator of operating results for the other fiscal quarters or the<br />
entire fiscal year. As a result of the seasonality, the highest cash flow<br />
period for the Company is in the fourth quarter when customer deposits<br />
for future ice contracts are received, and the lowest cash flow is in the<br />
summer months, when traffic is reduced.<br />
Mitigating factors and strategies:<br />
Various programs are developed to increase traffic during the summer<br />
period.<br />
Variable operating costs are reduced during the summer period.<br />
Forward Looking Statements<br />
Certain statements in this MD&A may constitute ‘’forward looking’’<br />
statements which involve known and unknown risks, uncertainties<br />
and other factors which may cause the actual results, performance or<br />
achievements of the Company to be materially different from any future<br />
results, performance or achievements expressed or implied by such forward<br />
looking statements. When used in this MD&A, such statements may use<br />
such words as ‘’may’’, ‘’will’’, ‘’expect’’, ‘’believe’’, ‘’plan’’ and other similar<br />
terminology. These statements reflect management’s current expectations<br />
regarding future events and operating performance and speak only as<br />
of the date of this MD&A. These forward looking statements involve a<br />
number of risks and uncertainties. Some of the factors that could cause<br />
actual results to differ materially from those expressed in or underlying<br />
such forward looking statements are the effects of, as well as changes<br />
in: international, national and local business and economic conditions;<br />
political or economic instability in the Company’s markets; competition;<br />
legislation and governmental regulation; and accounting policies and<br />
practices. The foregoing list of factors is not exhaustive.<br />
Competition<br />
The ice rink industry is highly competitive and <strong>Canlan</strong> competes with other<br />
private operators in its three major markets, B.C., Ontario and Quebec, as<br />
well as Municipal Governments that have different mandates and usually<br />
operate with significant losses. Other private operators may have more<br />
resources and less debt than <strong>Canlan</strong>, and municipal operators can operate<br />
at a loss for an indefinite period without the same negative consequences<br />
such losses would have on private companies.<br />
Mitigating factors and strategies:<br />
<strong>Canlan</strong> has developed customer loyalty by providing superior customer<br />
service and facilities.<br />
The ice rink industry is capital intensive with high start up expenses;<br />
therefore barriers to enter the business exist.<br />
We have developed expertise in all aspects of the ice rink development and<br />
operations.<br />
Insurance<br />
We maintain property and general liability insurance in addition to<br />
accident insurance for our various in-house programs.<br />
A large part of our revenue is achieved through the development and<br />
organization of adult hockey leagues that play in our owned and managed<br />
<strong>Canlan</strong> <strong>Ice</strong> <strong>Sports</strong> Corp. <strong>2010</strong> <strong>Annual</strong> <strong>Report</strong><br />
31
ANLA<br />
Management Discussion & Analysis<br />
facilities. Due to the nature of the sport, injuries can occur. The Company<br />
purchases liability and accident insurance, the cost of which is dependant<br />
upon the history of the number of claims and the quantum of such claims.<br />
There is always a risk that the cost of acquiring sufficient insurance to<br />
cover any such injury claims will become prohibitive or that such insurance<br />
will become unavailable.<br />
Mitigating factors and strategies:<br />
• Company maintains its facilities to high standards and continually<br />
monitors league activities and enforces a strict set of rules.<br />
• Company has developed risk management procedures and emergency<br />
preparedness guides at all of its locations.<br />
• Management works closely with insurance providers.<br />
Interest Rate and Loan Renewal Risk<br />
Mortgage debt of $5.7 million, is subject to variable interest rates. For<br />
every 1% change in the prime rate, interest expense will change by<br />
$57,000 per annum.<br />
Our loans are periodically refinanced with varying maturity dates. There<br />
is a risk that the loans will not be renewed or the renewal terms may be<br />
less favourable to the Company than they are currently, which may have an<br />
adverse impact on our business and cash flow.<br />
method of amortization and length of the amortization period could have<br />
a material impact on amortization expense and the net book value of our<br />
assets. Assets may become obsolete or require replacement before the end<br />
of their estimated useful lives, in which case any remaining unamortized<br />
costs would be written off.<br />
Revenue recognition<br />
Revenue from ice rink operations and management services is recognized<br />
as the product or service is supplied. Deferred revenue relates to amounts<br />
received in advance for our adult hockey leagues; revenue is recognized<br />
as games are played. A certain amount of judgment is required in the<br />
determination of revenue recognition based on our estimates. Any<br />
differences are recognized upon completion of the season.<br />
Valuation of future income tax assets<br />
In determining our income tax provision, the Company is required to make<br />
assumptions about expected timing of the reversal of our future tax asset.<br />
In the event that our assumptions differ from those of the tax authorities or<br />
that the timing of the reversals were not as anticipated, the tax provision<br />
could increase or decrease.<br />
Disclosure Controls and Procedures<br />
Mitigating factors and strategies:<br />
• The Company has fixed the interest rate on 86% of its mortgage debt,<br />
which totals $38.7 million<br />
• The Company maintains good relationships with its lenders through<br />
regular communications’ and reporting.<br />
• As at the date of this report, two of the three loan facilities mature<br />
on September 30, 2014 and one loan facility matures on July 15, 2018,<br />
which provides the Company with a reasonable period to operate<br />
without significant risk.<br />
Critical Accounting Policies and Estimates<br />
<strong>Canlan</strong>’s significant accounting policies are described in Note 4 to the<br />
consolidated financial statements. The preparation of these financial<br />
statements requires us to make estimates and judgments that affect<br />
the reported amount of assets, liabilities, revenues and expenses and<br />
disclosure of contingent liabilities.<br />
The most critical of these policies are those related to ice rink properties<br />
and revenue recognition.<br />
Useful lives of depreciable assets<br />
<strong>Ice</strong> rink properties and administrative assets, such as furniture, computer<br />
equipment and software are amortized on a straight-line basis over the<br />
estimated useful life of the asset. A large proportion of our total assets<br />
are comprised of our ice rink properties (<strong>2010</strong> - 86%). The selection<br />
We have established and maintain disclosure controls and procedures<br />
designed to provide reasonable assurance that material information<br />
relating to the Company is made known to the appropriate level of<br />
management in a timely manner.<br />
Based on current securities legislation in Canada, our Chief Executive<br />
Officer (CEO) and Chief Financial Officer (CFO) are required to certify<br />
that they have assessed the effectiveness of our disclosure controls and<br />
procedures as at December 31, <strong>2010</strong>.<br />
Our management has evaluated, under the supervision and with the<br />
participation of our CEO and CFO, the design and effectiveness of the<br />
Company’s disclosure controls and procedures as at the year ended<br />
December 31, <strong>2010</strong>. Management has concluded that these disclosure<br />
controls and procedures, as defined in National Instrument 52-109 –<br />
Certification of Disclosure in Issuers <strong>Annual</strong> and Interim Filings (NI 52-<br />
109), are adequate and effective and that material information relating<br />
to the Company was made known to them and reported within the time<br />
periods specified under applicable securities legislation.<br />
Our management, under the supervision of our CEO and CFO, has also<br />
designed and evaluated the effectiveness of the Company’s internal<br />
controls over financial reporting (ICFR) using the Internal Control –<br />
Integrated Framework as published by the Committee of Sponsoring<br />
Organization of the Treadway Commission (COSO) Framework. Based on our<br />
evaluation management has concluded that ICFR, as defined in NI 52-109<br />
and using the COSO integrated framework are effective as of December 31,<br />
<strong>2010</strong>.<br />
32 <strong>Canlan</strong> <strong>Ice</strong> <strong>Sports</strong> Corp. <strong>2010</strong> <strong>Annual</strong> <strong>Report</strong>
N ICE<br />
Management Discussion & Analysis<br />
Outlook<br />
The <strong>2010</strong> operating results were disappointing and did not meet management’s expectations. The primary<br />
contributing factors include lower than expected revenue from our two newest facilities in the USA,<br />
competition from local governments in three of our markets in Canada and the changing landscape in our food<br />
& beverage business. While we continue to generate positive cash flow and reduce our debt, we saw minimal<br />
same store growth in many of our markets.<br />
Our newest facility located in Fort Wayne Indiana is in its first full operating season and is gaining momentum;<br />
we’ve seen ice utilization increase steadily in Fort Wayne with growth in adult hockey, youth hockey, and public<br />
programs. Our two pad facility in Vineland New Jersey increased revenue by 38% over 2009 and has reduced its<br />
operating loss significantly. Management is working closely with the local operations team to provide guidance<br />
on increasing revenue and controlling costs.<br />
Our facilities located in Regina, Winnipeg and Oshawa have been faced with significant new competition from<br />
local governments. New multi pad facilities have been built in these markets creating an oversupply of ice. We<br />
are attempting to work with local governments to find solutions and create mutually beneficial arrangements.<br />
Our food and beverage operation contributed 17% of our total revenue in <strong>2010</strong>, or $11.8 million in gross<br />
revenue. On a same store basis we have seen a revenue decline, due to economic conditions, changes in driving<br />
laws and the introduction of HST in Ontario and British Columbia. We have improved our operating procedures<br />
in this area of our business and are now more cost effective which is expected to improve profitability.<br />
We have made a number of operational changes recently and expect 2011 to show improvement over this past<br />
year. We continue to reduce our debt and have rewarded our shareholders with the introduction of a quarterly<br />
dividend.<br />
The recent renewal of $17 million of mortgage debt and the added acquisition financing provided by the<br />
Company’s Bank ensures we have adequate financing to operate in the near future, and enables us to execute<br />
our growth strategies.<br />
Michael F. Gellard<br />
Senior Vice President and Chief Financial Officer<br />
<strong>Canlan</strong> <strong>Ice</strong> <strong>Sports</strong> Corp. <strong>2010</strong> <strong>Annual</strong> <strong>Report</strong><br />
33
Auditors <strong>Report</strong> to the Shareholders<br />
KPMG LLP<br />
Chartered Accountants<br />
PO Box 10426 777 Dunsmuir Street<br />
Vancouver BC<br />
V7Y 1K3<br />
Canada<br />
t · 604 · 691 · 3000<br />
f · 604 · 691 · 3031<br />
www.kpmg.com<br />
Independent Auditors’ <strong>Report</strong><br />
To the Shareholders of <strong>Canlan</strong> <strong>Ice</strong> <strong>Sports</strong> Corp.<br />
We have audited the accompanying consolidated financial statements of <strong>Canlan</strong> <strong>Ice</strong> <strong>Sports</strong> Corp., which comprise the balance sheets<br />
as at December 31, <strong>2010</strong> and December 31, 2009, and the consolidated statements of earnings, comprehensive income and deficit<br />
and cash flows for the years then ended, and notes, comprising a summary of significant accounting policies and other explanatory<br />
information.<br />
Management’s Responsibility for the Consolidated Financial Statements<br />
Management is responsible for the preparation and fair presentation of these consolidated financial statements in accordance with<br />
Canadian generally accepted accounting principles, and for such internal control as management determines is necessary to enable the<br />
preparation of consolidated financial statements that are free from material misstatement, whether due to fraud or error.<br />
Auditors’ Responsibility<br />
Our responsibility is to express an opinion on these consolidated financial statements based on our audits. We conducted our audits in<br />
accordance with Canadian generally accepted auditing standards. Those standards require that we comply with ethical requirements<br />
and plan and perform the audit to obtain reasonable assurance about whether the consolidated financial statements are free from<br />
material misstatement.<br />
An audit involves performing procedures to obtain audit evidence about the amounts and disclosures in the consolidated financial<br />
statements. The procedures selected depend on our judgment, including the assessment of the risks of material misstatement of<br />
the consolidated financial statements, whether due to fraud or error. In making those risk assesments, we consider internal control<br />
relevant to the entity’s preparation and fair presentation of the consolidated financial statements in order to design audit procedures<br />
that are appropriate in the circumstances, but not for the purpose of expressing an opinion on the effectiveness of the entity’s internal<br />
control. An audit also includes evaluating the appropriateness of accounting policies used and the reasonableness of accounting<br />
estimates made by management, as well as evaluating the overall presentation of the consolidated financial statements.<br />
We believe that the audit evidence we have obtained in our audits is sufficient and appropriate to provide a basis for our audit opinion.<br />
Opinion<br />
In our opinion, the consolidated financial statements present fairly, in all material respects, the consolidated financial position of <strong>Canlan</strong><br />
<strong>Ice</strong> <strong>Sports</strong> Corp. as at December 31, <strong>2010</strong> and December 31, 2009, and its consolidated results of operations and its consolidated<br />
cash flows for the years then ended in accordance with Canadian generally accepted accounting principles.<br />
Chartered Accountants<br />
Vancouver, Canada<br />
March 22, <strong>2010</strong><br />
<strong>Canlan</strong> <strong>Ice</strong> <strong>Sports</strong> Corp. <strong>2010</strong> <strong>Annual</strong> <strong>Report</strong><br />
35
Consolidated Balance Sheets<br />
December 31, <strong>2010</strong> and 2009<br />
(In thousands of dollars)<br />
<strong>2010</strong> 2009<br />
Assets<br />
Current assets:<br />
Cash and cash equivalents $ 8,903 $ 9,213<br />
Accounts receivable 1,519 1,845<br />
Inventory 1,041 1,024<br />
Prepaid expenses 456 496<br />
Future income taxes (note 12) 2,585 3,326<br />
14,504 15,904<br />
Properties:<br />
<strong>Ice</strong> rinks and recreational properties (note 5) 94,128 95,922<br />
Held for ice rink development 856 856<br />
94,984 96,778<br />
Future income taxes (note 12) 586 521<br />
Other assets 439 345<br />
Liabilities and Shareholders’ Equity<br />
$ 110,513 $ 113,548<br />
Current liabilities:<br />
Accounts payable and accrued liabilities $ 5,262 $ 5,360<br />
Deferred revenue and customer deposits 11,022 12,019<br />
Financial liability held for trading (note 13) 227 568<br />
Current portion of:<br />
Obligations under capital leases (note 6) 533 534<br />
Debt on ice rinks (note 7) 2,737 2,685<br />
19,781 21,166<br />
Long-term liabilities:<br />
Obligations under capital leases (note 6) 922 912<br />
Debt on ice rinks (note 7) 41,285 43,910<br />
Future income taxes (note 12) 1,845 1,387<br />
44,052 46,209<br />
63,833 67,375<br />
Shareholders’ equity:<br />
Share capital (note 8) 63,109 63,109<br />
Contributed surplus 543 543<br />
Deficit (16,972) (17,479)<br />
46,680 46,173<br />
Nature of operations (note 2)<br />
Commitments and contingencies (note 11)<br />
Subsequent events (note 17)<br />
See accompanying notes to consolidated financial statements.<br />
Approved on behalf of the Board:<br />
$ 110,513 $ 113,548<br />
W. Grant Ballantyne Director Joey St-Aubin Director<br />
36 <strong>Canlan</strong> <strong>Ice</strong> <strong>Sports</strong> Corp. <strong>2010</strong> <strong>Annual</strong> <strong>Report</strong>
Consolidated Statements of Earnings, Comprehensive Income and Deficit<br />
Years ended December 31, <strong>2010</strong> and 2009<br />
(In thousands of dollars, except for per share amounts)<br />
<strong>2010</strong> 2009<br />
Revenue:<br />
<strong>Ice</strong> rinks (note 15) $ 69,849 $ 67,196<br />
Expenses:<br />
<strong>Ice</strong> rinks 55,565 52,142<br />
<strong>Ice</strong> rinks operations 14,284 15,054<br />
General and administration expenses 4,753 4,139<br />
Earnings before the undernoted 9,531 10,915<br />
Other expenses (income):<br />
Amortization 4,813 4,467<br />
Interest 3,296 3,542<br />
Foreign exchange (43) (30)<br />
Sale of assets (35) (32)<br />
Held-for-trading financial liabilities (note 13) (341) (365)<br />
7,690 7,582<br />
Earnings from operations before income taxes 1,841 3,333<br />
Income taxes (note 12):<br />
Future expense 1,134 599<br />
Net earnings and comprehensive income 707 2,734<br />
Deficit, beginning of year (17,479) (20,213)<br />
Dividend on common shares (note 8) (200) –<br />
Deficit, end of year $ (16,972) $ (17,479)<br />
Basic and fully diluted earnings per common share $ 0.05 $ 0.20<br />
Weighted average common shares issued for basic and<br />
diluted earnings per share calculations 13,337,448 13,337,448<br />
See accompanying notes to consolidated financial statements.<br />
<strong>Canlan</strong> <strong>Ice</strong> <strong>Sports</strong> Corp. <strong>2010</strong> <strong>Annual</strong> <strong>Report</strong><br />
37
Consolidated Statements of Cash Flows<br />
Years ended December 31, <strong>2010</strong> and 2009<br />
(In thousands of dollars, except for per share amounts)<br />
<strong>2010</strong> 2009<br />
Cash provided by (used in):<br />
Operations:<br />
Net earnings $ 707 $ 2,734<br />
Items not involving cash:<br />
Amortization 4,813 4,467<br />
Amortization of deferred financing costs 96 96<br />
Gain on sale of assets (35) (32)<br />
Future income tax expense 1,134 599<br />
Gain on financial liability held for trading (341) (365)<br />
Net change in non-cash working capital (note 16(a)) (946) 551<br />
5,428 8,050<br />
Financing:<br />
Principal repayments of debt on ice rinks (2,669) (2,606)<br />
Principal repayments on obligations under capital lease (643) (586)<br />
Redemption of preferred shares – (1,400)<br />
(3,312) (4,592)<br />
Investments:<br />
Proceeds on sale of assets 37 50<br />
Expenditures on ice rink and recreational properties (2,249) (1,787)<br />
Other assets (214) (96)<br />
(2,426) (1,833)<br />
Increase (decrease) in cash and cash equivalents (310) 1,625<br />
Cash and cash equivalents, beginning of year 9,213 7,588<br />
Cash and cash equivalents, end of year $ 8,903 $ 9,213<br />
Supplemental cash flow information (note 16(b)).<br />
See accompanying notes to consolidated financial statements.<br />
38 <strong>Canlan</strong> <strong>Ice</strong> <strong>Sports</strong> Corp. <strong>2010</strong> <strong>Annual</strong> <strong>Report</strong>
Notes to Consolidated Financial Statements<br />
(tabular amounts expressed in thousands of dollars, except per share amounts)<br />
Years ended December 31, <strong>2010</strong> and 2009<br />
1. General:<br />
<strong>Canlan</strong> <strong>Ice</strong> <strong>Sports</strong> Corp. (the Company) focuses on the development,<br />
lease, acquisition and operation of multi-purpose recreation and<br />
entertainment facilities.<br />
2. Nature of operations:<br />
The Company has refinanced its long term debt with principal<br />
payments coinciding with the Company’s seasonal business such that<br />
the Company expects that it will no longer require shareholder support<br />
for financing during the off peak hockey season. The Company has<br />
two debt agreements, one of which matures on September 30, 2011<br />
and the other on July 15, 2018. Subsequent to year end, the Company<br />
has entered into an agreement to renew the September 30, 2011 debt<br />
agreement (note 17).<br />
At December 31, <strong>2010</strong>, the Company has a working capital deficiency of<br />
$5,277,000 as the Company finances a portion of its long term assets<br />
through customer deposits.<br />
3. Significant accounting policies:<br />
These financial statements are prepared in accordance with Canadian<br />
generally accepted accounting principles (GAAP).<br />
(a) Principles of consolidation:<br />
These consolidated financial statements include the accounts of<br />
the Company and the following wholly-owned subsidiaries:<br />
P.C. Development Inc.<br />
Les Quatre Glaces (1994) Inc.<br />
<strong>Ice</strong>plex 2000 Ltd.<br />
<strong>Canlan</strong> <strong>Ice</strong> <strong>Sports</strong> (USA) Corp.<br />
<strong>Canlan</strong> Management Services Ltd.<br />
(b) Inventory:<br />
Inventory consists of hockey equipment, supplies and sportswear<br />
held for sale, and food and beverage supplies. Inventory is<br />
recorded at the lower of cost, determined on a first-in first-out<br />
basis, and estimated net realizable value.<br />
(c) Long-lived assets:<br />
Long-lived assets are reviewed for impairment whenever events<br />
or changes in circumstances indicate that the carrying amount<br />
of an asset may not be recoverable. Long-lived assets are tested<br />
and measured for impairment at the individual ice rink property<br />
level, the lowest level for which identifiable cash flows are largely<br />
independent.<br />
A two-step process is used to assess the impairment of longlived<br />
assets held for use, with the first step determining whether<br />
impairment needs to be recognized, and the second step measuring<br />
the amount of the impairment. Impairment losses are recognized<br />
when the carrying amount of long-lived assets exceeds the sum<br />
of the undiscounted cash flows expected to result from their use<br />
and eventual disposition. An impairment loss is determined as<br />
the amount by which the carrying amount of a long-lived asset<br />
exceeds its fair value.<br />
<strong>Ice</strong> rink properties are amortized on a straight-line basis over<br />
the estimated useful lives of the respective assets, which are as<br />
follows:<br />
Assets<br />
Buildings<br />
Building improvements<br />
Machinery and equipment<br />
Computers, furniture and fixtures<br />
<strong>Ice</strong> resurfacing equipment<br />
(d) Revenue recognition:<br />
Rate<br />
40 years<br />
10 years<br />
10 years<br />
5 years<br />
5 years<br />
Revenue from ice contracts, programs and leagues is recorded as<br />
earned and collection is reasonably assured. Deferred revenue<br />
represents payments received in advance for events which have<br />
not yet occurred, and services which have not yet been performed.<br />
These amounts are recorded in revenue as earned.<br />
(e) Management contracts:<br />
The Company’s financial results include the revenue and expenses<br />
of facilities operated under management contracts where the<br />
Company’s return is subject to the risks and rewards of operation.<br />
For facilities where this is not the case, the Company records only<br />
the revenue received in the form of fixed management fees.<br />
(f) Foreign currency:<br />
Monetary items denominated in foreign currency are translated<br />
into Canadian dollars at exchange rates in effect at the balance<br />
sheet date, and non-monetary items are translated at rates of<br />
exchange in effect when the assets were acquired or obligations<br />
incurred. Revenue and expenses are translated at rates in effect<br />
at the time of the transactions. Foreign exchange gains and losses<br />
are included in operations.<br />
(g) Financial Instruments:<br />
The Company designated its cash and cash equivalents as available<br />
for sale, which are measured at fair value. Accounts receivable<br />
are classified as loans and receivables, which are measured at<br />
amortized cost. Accounts payable, accrued liabilities, and debt<br />
on ice rinks are classified as other financial liabilities, which are<br />
measured at amortized cost. Derivative contracts are measured at<br />
fair value. Transaction costs are offset against the outstanding<br />
principal of the related debt and are amortized using the effective<br />
interest rate method. The Company did not have held-to-maturity<br />
instruments at December 31, <strong>2010</strong>.<br />
(h) Derivative financial instruments:<br />
Derivative instruments are financial contracts whose value is<br />
derived from interest rates, foreign exchange rates or other<br />
financial or commodity indices.<br />
<strong>Canlan</strong> <strong>Ice</strong> <strong>Sports</strong> Corp. <strong>2010</strong> <strong>Annual</strong> <strong>Report</strong><br />
39
Notes to Consolidated Financial Statements<br />
(tabular amounts expressed in thousands of dollars, except per share amounts)<br />
Years ended December 31, <strong>2010</strong> and 2009<br />
On August 1, 2008, the Company entered into an interest rate<br />
swap contract used to manage the exposure to market risks from<br />
changing interest rates. This instrument has not been designated<br />
as a hedge and is marked to market. The resulting unrealized<br />
gains and losses during the period are recorded in other expenses<br />
(income) with a corresponding asset or liability recorded on the<br />
balance sheet. Payments and receipts under the interest rate<br />
swap contract are recognized as adjustments to interest expense<br />
on long-term debt.<br />
(i) Earnings per share:<br />
Basic and fully diluted earnings per share have been calculated<br />
using the weighted average number of common shares outstanding.<br />
(j) Stock-based compensation:<br />
Stock appreciation rights (SARs) are settled in cash and are<br />
recognized over their vesting period and re-measured at each<br />
reporting period, until settlement, using quoted market values.<br />
SARs are accounted for as compensation expense and recorded in<br />
accounts payable and accrued liabilities.<br />
(k) Employee future benefits:<br />
The Company matches contributions to a defined contribution<br />
pension plan to a maximum of 4% of salaries. Included in ice rink<br />
and general and administrative expenses is $323,000 (2009 - nil)<br />
in respect of the Company’s contributions for <strong>2010</strong>.<br />
(l) Measurement uncertainty:<br />
The preparation of financial statements requires management to<br />
make estimates and assumptions that affect the reported balances.<br />
In determining estimates of net recoverable amounts for its ice<br />
rinks and net realizable values for accounts receivable, inventory<br />
and other assets, management makes assumptions regarding<br />
applicable industry performance and prospects, as well as general<br />
business and economic conditions that prevail and are expected to<br />
prevail. Assumptions underlying asset valuations are limited by<br />
the availability of reliable comparable data and the uncertainty of<br />
predictions concerning future events.<br />
By nature, asset valuations are subjective and do not necessarily<br />
result in precise determinations. Should the underlying<br />
assumptions change, the estimated net recoverable amounts and<br />
net realizable values may change, and the amount of the change<br />
may be material.<br />
(m) Income taxes:<br />
Incomes taxes are accounted for by the asset and liability method.<br />
Under this method, future income tax assets and liabilities are<br />
determined on temporary differences (differences between the<br />
tax basis and accounting basis of assets and liabilities) and are<br />
measured using the enacted, or substantively enacted tax rates<br />
expected to apply when the asset is realized or the liability is<br />
settled. A valuation allowance is recorded against any future<br />
income tax asset to reduce it to an amount that management<br />
considers is more likely than not to be realized.<br />
4. Future changes in accounting policies:<br />
Publicly accountable Canadian enterprises will be required to prepare<br />
financial statements in accordance with International Financial<br />
<strong>Report</strong>ing Standard (“IFRS”), as issued by the International Accounting<br />
Standards Board. The Company will report its financial results in<br />
accordance with IFRS effective January 1, 2011.<br />
40 <strong>Canlan</strong> <strong>Ice</strong> <strong>Sports</strong> Corp. <strong>2010</strong> <strong>Annual</strong> <strong>Report</strong>
Notes to Consolidated Financial Statements<br />
(tabular amounts expressed in thousands of dollars, except per share amounts)<br />
Years ended December 31, <strong>2010</strong> and 2009<br />
5. <strong>Ice</strong> rinks and recreational properties:<br />
Accumulated<br />
Net book<br />
<strong>2010</strong> Cost amortization value<br />
Land $ 14,616 $ - $ 14,616<br />
Buildings and building improvements 107,584 34,917 72,667<br />
Machinery and equipment 8,413 5,128 3,285<br />
Computers, furniture and fixtures 7,323 4,872 2,451<br />
<strong>Ice</strong> resurfacing equipment 3,960 2,851 1,109<br />
$ 141,896 $ 47,768 $ 94,128<br />
Accumulated<br />
Net book<br />
2009 Cost amortization value<br />
Land $ 14,616 $ - $ 14,616<br />
Buildings and building improvements 107,155 32,026 75,129<br />
Machinery and equipment 7,802 4,598 3,204<br />
Computers, furniture and fixtures 6,018 4,110 1,908<br />
<strong>Ice</strong> resurfacing equipment 3,537 2,472 1,065<br />
$ 139,128 $ 43,206 $ 95,922<br />
Included in ice rinks are assets under capital leases with a cost of $2,916,000 (2009 - $2,846,000) and accumulated amortization of $1,048,000 (2009<br />
- $863,000).<br />
6. Obligations under capital leases:<br />
Total minimum lease payments are as follows:<br />
2011 $ 632<br />
2012 489<br />
2013 370<br />
2014 187<br />
2015 61<br />
1,739<br />
Interest (rates vary from 4% to 8%) 284<br />
Present value of minimum capital lease payments 1,455<br />
Current portion 533<br />
Long-term portion $ 922<br />
Lease obligations are secured directly by the leased assets.<br />
Interest of $119,000 (2009 - $123,000) relating to capital lease obligations has been included in interest expense.<br />
<strong>Canlan</strong> <strong>Ice</strong> <strong>Sports</strong> Corp. <strong>2010</strong> <strong>Annual</strong> <strong>Report</strong><br />
41
Notes to Consolidated Financial Statements<br />
(tabular amounts expressed in thousands of dollars, except per share amounts)<br />
Years ended December 31, <strong>2010</strong> and 2009<br />
7. Debt on ice rinks:<br />
Maturity dates Interest rates <strong>2010</strong> 2009<br />
Fixed rate 2018 6.79% $ 27,000 $ 28,500<br />
Variable rate 2011 Prime + 1.25% 11,671 12,247<br />
2011 Prime + 1.25% 5,700 6,293<br />
44,371 47,040<br />
Less: deferred financing costs (349) (445)<br />
44,022 46,595<br />
Current portion 2,737 2,685<br />
Long-term portion $ 41,285 $ 43,910<br />
As at December 31, <strong>2010</strong>, debt on ice rinks consists of three credit facilities with two lending institutions as follows:<br />
• $30,000,000 loan maturing on July 15, 2018, fixed interest at 6.79% per annum, payable monthly. At December 31, <strong>2010</strong>, the balance outstanding<br />
was $27,000,000;<br />
• $13,000,000 loan maturing on September 30, 2011, interest at Prime rate plus 1.25% payable monthly. The Company has entered into an interest rate<br />
swap agreement to fix the interest rate on the total principal borrowed at a rate of 4.12% per annum, plus applicable stamping fees at 2.50%, under<br />
an agreement expiring in September 2011. At December 31, <strong>2010</strong>, the balance outstanding was $11,671,000. Subsequent to year end, the Company<br />
entered into an agreement to renew its loan (note 17). Accordingly, the loan has been classified as long-term; and<br />
• $7,000,000 loan maturing on September 30, 2011, interest at Prime rate plus 1.25% per annum, payable monthly. At December 31, <strong>2010</strong>, the balance<br />
outstanding was $5,700,000. Subsequent to year end, the Company entered into an agreement to renew its loan (note 17). Accordingly, the loan has<br />
been classified as long-term.<br />
Amortization of deferred financing costs totaling $96,000 (2009 - $96,000) was recorded as interest expense. Debt on ice rinks is secured by first<br />
mortgages, demand debentures, general security agreements, general assignments of book debts, assignments of rents and insurance, and specific<br />
pledging of title to and interest in the respective land and buildings.<br />
The Company has available, a $1,000,000 uncommitted operating line of credit that was unused at December 31, <strong>2010</strong>. Outstanding amounts would<br />
incur interest at the Prime rate plus 1.75%, and be secured by general security agreements. The operating line of credit expires on September 30,<br />
2011.<br />
8. Share capital:<br />
The common shares of the Company are listed on the Toronto Stock Exchange.<br />
Shares<br />
Amount<br />
(a) Authorized:<br />
500,000,000 common shares of no par value<br />
(b) Issued and outstanding:<br />
December 31, 2009 and <strong>2010</strong> 13,337,448 $ 63,109<br />
During <strong>2010</strong>, the Company announced that its Board of Directors approved the introduction of a quarterly dividend. On December 6, <strong>2010</strong>, the<br />
Company declared a quarterly dividend of $0.015 per share payable on January 17, 2011. At December 31, <strong>2010</strong>, the Company recognized dividends<br />
payable of $200,000 (2009 - nil).<br />
9. Stock-based compensation:<br />
In 2005, the Company established a Stock Appreciation Rights plan (the SAR Plan) granted by the Company’s Board of Directors subject to terms and<br />
conditions of the <strong>Canlan</strong> <strong>Ice</strong> <strong>Sports</strong> Corp. Director and Employee Stock Appreciation Rights Plan (2006). The SAR Plan provides eligible directors<br />
and employees of the Company with the right to receive cash equal to the appreciation of the Company’s common shares subsequent to the date of<br />
grant. The stock appreciation rights granted under the SAR Plan vest in equal installments over a three year period commencing in November 2006.<br />
All unexercised stock appreciation rights expire five years from the grant date.<br />
42 <strong>Canlan</strong> <strong>Ice</strong> <strong>Sports</strong> Corp. <strong>2010</strong> <strong>Annual</strong> <strong>Report</strong>
Notes to Consolidated Financial Statements<br />
(tabular amounts expressed in thousands of dollars, except per share amounts)<br />
Years ended December 31, <strong>2010</strong> and 2009<br />
9. Stock-based compensation (continued):<br />
The table below summarizes the change in the number of SAR during the year ended December 31, <strong>2010</strong>:<br />
Number<br />
of SAR<br />
Weighted<br />
average<br />
exercise price<br />
Number of SAR outstanding, December 31, 2009 755,250 $ 1.15<br />
Exercised (579,500) 1.20<br />
Forfeited - -<br />
Granted 562,000 2.00<br />
Balance, December 31, <strong>2010</strong> 737,750 $ 1.77<br />
The following table summarizes information about the stock appreciation rights outstanding at December 31, <strong>2010</strong><br />
Rights outstanding<br />
Rights exercisable<br />
Weighted Weighted Weighted<br />
average average average<br />
Number remaining exercise Number exercise<br />
Exercise price outstanding contractual life price exercisable price<br />
$ 1.20 35,000 11 months $ 1.20 35,000 $ 1.20<br />
$ 0.80 105,750 35 months $ 0.80 70,500 $ 0.80<br />
$ 1.50 35,000 40 months $ 1.50 11,667 $ 1.50<br />
$ 2.00 562,000 35 months $ 2.00 - $ 2.00<br />
During <strong>2010</strong> the Company recognized a compensation expense of $389,000 (2009 - $211,000) in respect of the SAR Plan.<br />
10. Capital risk management:<br />
The Company defines capital that it manages as the sum of cash and cash equivalents, debt on ice rinks, preferred shares, and shareholders’ equity<br />
The Company’s objectives when managing its capital are:<br />
(a) To safeguard the entity’s ability to continue as a going concern so that it can provide services to its customers and continue to reduce debt;<br />
(b) To comply with debt covenants; and<br />
(c) To maintain a financial position suitable for supporting the Company’s growth strategies and provide an adequate return to shareholders.<br />
<strong>Canlan</strong> <strong>Ice</strong> <strong>Sports</strong> Corp. <strong>2010</strong> <strong>Annual</strong> <strong>Report</strong><br />
43
Notes to Consolidated Financial Statements<br />
(tabular amounts expressed in thousands of dollars, except per share amounts)<br />
Years ended December 31, <strong>2010</strong> and 2009<br />
The Company’s debt on ice rinks (note 7) contains a covenant that requires the Company’s debt to tangible net worth ratio, as defined in its debt<br />
agreements, to be no greater than 1.50. Tangible net worth is calculated as follows:<br />
Shareholders’ equity $ 46,680<br />
Less:<br />
Net future income tax asset 1,326<br />
Net worth 45,354<br />
Current and long-term portions of:<br />
Debt on ice rinks 44,371<br />
Capital leases 1,455<br />
Total debt $ 45,826<br />
Tangible net worth ratio 1.01<br />
The Company has not made any changes to its overall capital management strategy during the year ended December 31, <strong>2010</strong>.<br />
11. Commitments and contingencies:<br />
(a) At December 31, <strong>2010</strong>, the Company has lease agreements with third parties under the terms of which the Company leases and operates certain<br />
ice rink and recreational facilities. The Company assumes the financial risks and rewards of the facilities’ operations, but there will be no transfer<br />
of ownership. Accordingly, the lease agreements have been accounted for as operating leases. The total minimum lease payments are as follows:<br />
Years ending Langley <strong>Ice</strong> <strong>Sports</strong> <strong>Ice</strong> <strong>Sports</strong> <strong>Ice</strong> <strong>Sports</strong> <strong>Ice</strong> <strong>Sports</strong><br />
December 31: Twin Rinks Victoria Park York Vineland Fort Wayne<br />
2011 $ 220 $ 328 $ 298 $ 324 $ 557<br />
2012 220 328 298 324 573<br />
2013 220 328 298 - 619<br />
2014 220 328 298 - 623<br />
2015 - 328 298 - 692<br />
Thereafter - - 1,339 8,582 - 10,577<br />
(i) <strong>Ice</strong> <strong>Sports</strong> Langley Twin Rinks is a two-pad facility in British Columbia with a lease term that ends on December 31, 2014.<br />
(ii) <strong>Ice</strong> <strong>Sports</strong> Victoria Park is a two-pad facility in Ontario with a lease term that ends on January 31, 2020.<br />
(iii)<br />
(iv)<br />
On August 1, 2006, the Company purchased an ice rink facility in Toronto, Ontario. Upon purchase, the Company assumed a forty-nine<br />
year land lease agreement related to the land on which the facility is situated. The land lease agreement is with a third party and ends<br />
on October 30, 2044.<br />
<strong>Ice</strong> <strong>Sports</strong> Vineland is a two-pad facility in New Jersey with a lease term that ends on December 31, 2012. At the conclusion of the<br />
lease, the Company will have the option to purchase the facility for USD$3,800,000.<br />
(v) <strong>Ice</strong> <strong>Sports</strong> Fort Wayne is a three-pad facility in Indiana with a lease term that began on February 12, <strong>2010</strong> and will end on January 31,<br />
2030. The lease gives the Company the option to purchase the facility from the lessor for USD$9,300,000 anytime during the first five<br />
years of the lease, and USD$9,800,000 during years six and seven.<br />
(b) Effective January 1, 2008, the Company entered into an agreement with a third party under the terms of which the Company leases an ice rink<br />
facility it owns to the third party and the lessee operates the facility. The annual lease payment payable to the Company is $325,000 and the<br />
term of the lease is for a period of five years. At the end of the term, the lessee has an option to purchase the facility from the Company for<br />
$4,500,000.<br />
44 <strong>Canlan</strong> <strong>Ice</strong> <strong>Sports</strong> Corp. <strong>2010</strong> <strong>Annual</strong> <strong>Report</strong>
Notes to Consolidated Financial Statements<br />
(tabular amounts expressed in thousands of dollars, except per share amounts)<br />
Years ended December 31, <strong>2010</strong> and 2009<br />
11. Commitments and contingencies (continued):<br />
(c) Due to the nature of the sports and recreation business, various lawsuits involving the Company are pending. The financial impact of these<br />
lawsuits is not determinable, but management believes, based on legal counsels’ opinions, that the outcome will not materially affect the<br />
Company’s financial position.<br />
12. Income taxes:<br />
(a) The major factors which caused variations from the Company’s expected combined federal and provincial income tax rate of 31% for <strong>2010</strong> (2009<br />
- 32%) were as follows:<br />
<strong>2010</strong> 2009<br />
Statutory rate applied to earnings from continuing<br />
operations before income taxes $ 578 $ 1,067<br />
Change in valuation allowance 320 376<br />
Non-deductible expenses 6 121<br />
Substantively enacted tax rate changes 275 (30)<br />
Recognition of future benefits related to loss carry forwards – (777)<br />
Other (45) (158)<br />
Income taxes $ 1,134 $ 599<br />
(b) The tax effects of temporary differences that give rise to future income tax assets and future income tax liabilities at December 31, <strong>2010</strong> and<br />
2009 are presented below:<br />
<strong>2010</strong> 2009<br />
Future income tax assets:<br />
Unused tax losses $ 1,564 $ 1,217<br />
Deferred revenue 2,251 2,907<br />
Properties 865 755<br />
Unrealized loss on financial instruments 69 172<br />
Other 315 369<br />
5,064 5,420<br />
Less: valuation allowance (1,893) (1,573)<br />
Total future income tax asset 3,171 3,847<br />
Current portion of future income tax asset 2,585 3,326<br />
Non-current future income tax asset $ 586 $ 521<br />
Future income tax liability:<br />
Properties - non-current $ (1,845) $ (1,387)<br />
Net future income taxes $ 1,326 $ 2,460<br />
Presented on balance sheets as:<br />
Future income tax asset - current $ 2,585 $ 3,326<br />
Future income tax asset - non-current 586 521<br />
Future income tax liability - non-current (1,845) (1,387)<br />
$ 1,326 $ 2,460<br />
(c) At December 31, <strong>2010</strong> the Company has non-capital loss carry forwards for income tax purposes of approximately $4,682,000 (2009 - $3,599,000)<br />
available to offset future taxable income in Canada and the United States. The benefit of these losses will expire starting in 2011 through to 2030.<br />
None of these losses carried forward are restricted as to use.<br />
<strong>Canlan</strong> <strong>Ice</strong> <strong>Sports</strong> Corp. <strong>2010</strong> <strong>Annual</strong> <strong>Report</strong><br />
45
Notes to Consolidated Financial Statements<br />
(tabular amounts expressed in thousands of dollars, except per share amounts)<br />
Years ended December 31, <strong>2010</strong> and 2009<br />
13. Financial instruments:<br />
(a) Fair value:<br />
The carrying values of certain of the Company’s financial instruments, including accounts receivable, accounts payable and accrued liabilities,<br />
and obligations under capital leases are considered by management to approximate their fair values due to their short-term nature.<br />
The Company’s financial instruments of a long-term nature, being debt on ice rinks, may be impacted by changes in market yields, which can<br />
result in differences between their carrying values and their fair values.<br />
The fair values of debt on ice rinks included in the balance sheet are as follows:<br />
<strong>2010</strong> 2009<br />
Carrying<br />
Carrying<br />
amount Fair value amount Fair value<br />
Debt on ice rinks $ 44,022 $ 44,275 $ 46,595 $ 47,665<br />
The fair value of debt on ice rinks was estimated at the present value of contractual future payments of principal and interest, discounted at the<br />
current market rates of interest available to the Company for the same or similar debt instruments.<br />
The Company has also entered into an interest-rate-swap agreement to fix the interest rate on a portion of its debt on ice rinks (note 7). The fair<br />
value of the instrument has been presented as a current liability on the balance sheet and is classified as Level 2 in the fair value hierarchy. At<br />
December 31, <strong>2010</strong>, the fair value was $227,000 (2009 - $568,000). Changes in the fair value of the instrument are recognized in net earnings.<br />
For the year ended December 31, <strong>2010</strong>, a gain of $342,000 (2009 - $365,000) was recognized.<br />
(b) Interest rate risk:<br />
The terms of the Company’s outstanding debt are described in note 7. As certain of the Company’s debt instruments bear interest at floating rates<br />
and are not hedged by interest rate swaps, fluctuations in these rates will impact the cost of financing incurred in the future. A change in the<br />
Canadian Prime rate by 1% will increase or decrease interest expense by approximately $57,000 (2009 - $63,000) per annum.<br />
(c) Liquidity risk:<br />
Liquidity risk is the risk from the Company’s potential inability to meet its financial obligations. The Company constantly monitors its cash<br />
flows and operations to ensure current and long-term obligations can be met. The Company’s capital resources are comprised of cash and cash<br />
equivalents and cash flow from operating activities. A portion of the cash and cash equivalents at December 31, <strong>2010</strong> consists of customer<br />
deposits received in advance of the services being provided.<br />
(d) Credit risk:<br />
Credit risk is the risk of financial loss to the Company if a counterparty to a financial instrument fails to meet its contractual obligations, and<br />
arises principally from the Company’s accounts receivable. Effective monitoring of accounts receivable is a core control procedure of the Company<br />
and appropriate provisions are recorded for impaired accounts. The Company does not face any material concentrations of credit risk.<br />
The Company’s credit risk on cash and cash equivalents is limited as it maintains its cash and cash equivalents with large financial institutions.<br />
14. Related party transactions:<br />
(a) During the year, the company paid nil (2009 - $153,700) preferred share dividends to an affiliate of the Company’s controlling shareholder as<br />
the preferred shares were fully redeemed in 2009.<br />
(b) During the year, the Company paid $109,000 (2009 - $119,800) in directors’ fees.<br />
(c) The Chairman of the Board of Directors of the Company is a Director of a vendor from which the Company purchases services in the normal course<br />
of business. Purchases from this vendor for the year ended December 31, <strong>2010</strong> was $45,000 (2009 - $30,000).<br />
(d) A Director of the Company is the Chairman of the Board of Directors of a vendor from which the Company purchases services in the normal course<br />
of business. Purchases from this vendor for the year ended December 31, <strong>2010</strong> was $45,000 (2009 - $30,000).<br />
46 <strong>Canlan</strong> <strong>Ice</strong> <strong>Sports</strong> Corp. <strong>2010</strong> <strong>Annual</strong> <strong>Report</strong>
Notes to Consolidated Financial Statements<br />
(tabular amounts expressed in thousands of dollars, except per share amounts)<br />
Years ended December 31, <strong>2010</strong> and 2009<br />
15. Segmented information:<br />
The Company’s operations consist of full service ice rink and recreational facilities, primarily in Canada, which constitute a single operating segment.<br />
<strong>Ice</strong> rink revenue by services provided are as follows:<br />
<strong>2010</strong> 2009<br />
<strong>Ice</strong> sales $ 51,343 $ 48,778<br />
Restaurant and lounge 11,797 11,804<br />
<strong>Sports</strong> store 1,960 1,990<br />
Management and consulting fees 286 390<br />
Other 4,463 4,234<br />
$ 69,849 $ 67,196<br />
There is no single customer who accounts for 10% or more of the Company’s revenue.<br />
16. Supplemental cash flow information:<br />
<strong>2010</strong> 2009<br />
(a) Net changes in non-cash working capital:<br />
Accounts receivable $ 326 $ (19)<br />
Inventory (17) 47<br />
Prepaid expenses 40 (165)<br />
Accounts payable and accrued liabilities (298) (361)<br />
Deferred revenue and customer deposits (997) 1,049<br />
$ (946) $ 551<br />
(b) Supplemental cash flow information:<br />
Interest paid $ 3,201 $ 3,461<br />
Non-cash transactions:<br />
Capital lease obligations 647 395<br />
17. Subsequent events:<br />
(a) Two of the Company’s credit facilities mature on September 30, 2011 (note 7). On March 22, 2011, the Company has entered into an agreement<br />
to renew the terms of these two credit facilities effective October 1, 2011. The terms of the two renewed credit facilities are as follows:<br />
• $13,000,000 loan maturing on September 30, 2014, interest at Prime rate plus 1.25% payable monthly; and<br />
• $7,000,000 loan maturing on September 30, 2014, interest at Prime rate plus 1.25% per annum, payable monthly.<br />
In addition, the lending institution made available to the Company, a $5,000,000 committed revolving credit facility. Outstanding amounts<br />
would incur interest at Prime rate plus 1.25%. The revolving credit facility expires on September 30, 2014.<br />
(b) On March 22, 2011, the Company declared a quarterly dividend of $0.015 per share payable on April 15, 2011.<br />
<strong>Canlan</strong> <strong>Ice</strong> <strong>Sports</strong> Corp. <strong>2010</strong> <strong>Annual</strong> <strong>Report</strong><br />
47
Five Year Review<br />
(expressed in thousands except statistics)<br />
<strong>2010</strong> 2009 2008 2007 2006<br />
Assets:<br />
<strong>Ice</strong> rink properties $94,128 $95,922 $98,137 $99,046 $100,464<br />
Other 13,214 13,779 12,011 9,131 9,599<br />
Future income tax benefit 3,171 3,847 4,566 1,380 2,140<br />
$110,513 $113,548 $114,714 $109,557 $112,203<br />
Liabilities:<br />
<strong>Ice</strong> rink mortgages $44,022 $46,595 $49,105 $50,264 $53,195<br />
Preferred Shares - - 1,400 2,650 3,650<br />
Other 17,966 19,393 19,263 17,031 16,552<br />
Future income tax liability 1,845 1,387 1,507 - -<br />
$63,833 $67,375 $71,275 $69,945 $73,397<br />
Shareholders' Equity:<br />
Share capital $63,109 $63,109 $63,109 $63,109 $63,109<br />
Contributed surplus 543 543 543 543 543<br />
Retained earnings (deficit) (16,972) (17,479) (20,213) (24,040) (24,846)<br />
$46,680 $46,173 $43,439 $39,612 $38,806<br />
Statistics:<br />
Debt to equity ratio 1:1 1.05:1 1.21:1 1.37:1 1.49:1<br />
Share price range $1.50-2.25 $1.00-1.50 $1.00-2.00 $1.20-2.70 $0.80-1.40<br />
48 <strong>Canlan</strong> <strong>Ice</strong> <strong>Sports</strong> Corp. <strong>2010</strong> <strong>Annual</strong> <strong>Report</strong>
Five Year Review<br />
<strong>2010</strong> 2009 2008 2007 2006<br />
Revenue:<br />
<strong>Ice</strong> rinks $69,849 $67,196 $64,669 $62,539 $55,231<br />
Operating expenses:<br />
<strong>Ice</strong> Rinks 55,565 52,142 49,768 48,856 43,107<br />
General and administative 4,753 4,139 3,665 3,526 2,775<br />
60,318 56,281 53,433 52,382 45,882<br />
Earnings before interest, amortization and taxes 9,531 10,915 11,236 10,157 9,349<br />
Other expenses:<br />
Amortization 4,813 4,467 4,224 4,131 3,888<br />
Interest 3,296 3,542 3,944 4,440 3,955<br />
Loss on financial instruments (341) (365) 933 0 0<br />
Other (78) (62) (14) 20 341<br />
Taxes (recovery) 1,134 599 (1,678) 760 (189)<br />
8,824 8,181 7,409 9,351 7,995<br />
Net earnings $707 $2,734 $3,827 $806 $1,354<br />
Basic & fully diluted earnings per common share: $0.05 $0.20 $0.29 $0.06 $0.10<br />
Issued and average shares outstanding at year end<br />
13,337 13,337 13,337 13,337 13,337<br />
(000s)<br />
<strong>Canlan</strong> <strong>Ice</strong> <strong>Sports</strong> Corp. <strong>2010</strong> <strong>Annual</strong> <strong>Report</strong><br />
49
Corporate Information<br />
Directors<br />
Charles Allen<br />
Chairman, TeraGo Inc.<br />
Whitby, ON<br />
W. Grant Ballantyne<br />
Chairman, <strong>Canlan</strong> <strong>Ice</strong> <strong>Sports</strong> Corp.<br />
Victoria, BC<br />
Frank D. Barker<br />
Partner, Kinetic Capital Partners<br />
Vancouver, BC<br />
Geoffrey J. Barker<br />
Vice-President,<br />
Properties & Development<br />
Bartrac Holdings Ltd.<br />
Vancouver, BC<br />
Edwin Cohen<br />
Private Investor<br />
Toronto, ON<br />
William B. Pattison<br />
President<br />
Pattison Information Inc.<br />
Victoria, BC<br />
Joey St-Aubin<br />
President & CEO<br />
<strong>Canlan</strong> <strong>Ice</strong> <strong>Sports</strong> Corp.<br />
Courtice, ON<br />
Officers<br />
W. Grant Ballantyne<br />
Chairman<br />
Joey St-Aubin<br />
President & CEO<br />
Michael F. Gellard<br />
Senior Vice-President & CFO<br />
Mark Faubert<br />
Senior Vice-President of Operations<br />
Ken Male<br />
Vice-President<br />
Partnership Solutions<br />
Paul Dillion<br />
Vice-President<br />
Sales, Marketing & Service<br />
Shari Lichterman<br />
Vice-President<br />
Eastern Operations<br />
Greg Porcellato<br />
Vice-President<br />
Western Operations<br />
Mark E. Reynolds<br />
Vice-President<br />
Human Resources & Chief Privacy Officer<br />
Ivan C. Wu<br />
Vice-President Finance & Controller<br />
Head Office<br />
6501 Sprott Street, Burnaby, B.C. V5B 3B8<br />
t 604 736 9152 f 604 736 9170<br />
Toronto Office<br />
989 Murray Ross Parkway (on the campus of York University)<br />
North York, Ontario M3J 3M4<br />
t 416 661 4423 f 416 661 4422<br />
Solicitors & Registered Office<br />
Edwards, Kenny & Bray LLP, 19th Floor, 1040 West Georgia Street,<br />
Vancouver, BC V6E 4H3<br />
Auditors<br />
KPMG LLP, 777 Dunsmuir Street, Vancouver, BC V7Y 1K3<br />
Registrar & Transfer Agent<br />
Computershare Investor Services, 8th Floor, 151 Front Street, Toronto,<br />
ON M5J 2N1 and<br />
510 Burrard Street, Vancouver, BC V6C 3B9<br />
Shares Listed<br />
Toronto Stock Exchange, Symbol ICE<br />
Web site<br />
www.icesports.com<br />
50 <strong>Canlan</strong> <strong>Ice</strong> <strong>Sports</strong> Corp. <strong>2010</strong> <strong>Annual</strong> <strong>Report</strong>
Where the experience is everything!<br />
Toronto Office<br />
989 Murray Ross Parkway<br />
North York, ON<br />
M3J 3M4<br />
Head Office<br />
6501 Sprott St.<br />
Burnaby B.C.<br />
V5B 3B8