Interaction of bubbles with sugar in bread
Interaction of bubbles with sugar in bread
Interaction of bubbles with sugar in bread

You also want an ePaper? Increase the reach of your titles
YUMPU automatically turns print PDFs into web optimized ePapers that Google loves.
<strong>Interaction</strong> <strong>of</strong> <strong>bubbles</strong> <strong>with</strong> <strong>sugar</strong> <strong>in</strong> <strong>bread</strong><br />
L. Tr<strong>in</strong>h and P. J. Mart<strong>in</strong><br />
University <strong>of</strong> Manchester, Manchester, UK (P.Mart<strong>in</strong>@manchester.ac.uk)<br />
ABSTRACT<br />
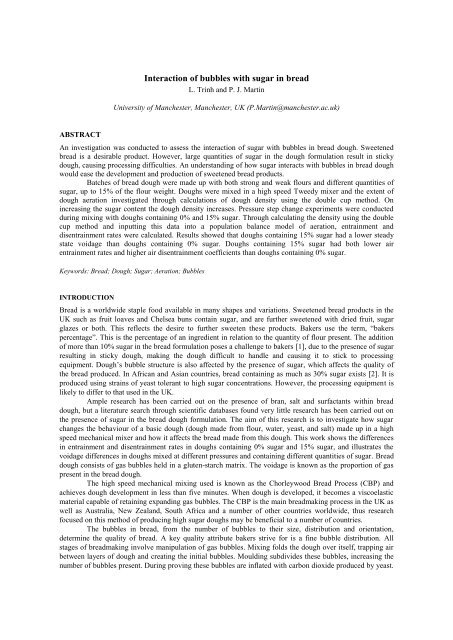
An <strong>in</strong>vestigation was conducted to assess the <strong>in</strong>teraction <strong>of</strong> <strong>sugar</strong> <strong>with</strong> <strong>bubbles</strong> <strong>in</strong> <strong>bread</strong> dough. Sweetened<br />
<strong>bread</strong> is a desirable product. However, large quantities <strong>of</strong> <strong>sugar</strong> <strong>in</strong> the dough formulation result <strong>in</strong> sticky<br />
dough, caus<strong>in</strong>g process<strong>in</strong>g difficulties. An understand<strong>in</strong>g <strong>of</strong> how <strong>sugar</strong> <strong>in</strong>teracts <strong>with</strong> <strong>bubbles</strong> <strong>in</strong> <strong>bread</strong> dough<br />
would ease the development and production <strong>of</strong> sweetened <strong>bread</strong> products.<br />
Batches <strong>of</strong> <strong>bread</strong> dough were made up <strong>with</strong> both strong and weak flours and different quantities <strong>of</strong><br />
<strong>sugar</strong>, up to 15% <strong>of</strong> the flour weight. Doughs were mixed <strong>in</strong> a high speed Tweedy mixer and the extent <strong>of</strong><br />
dough aeration <strong>in</strong>vestigated through calculations <strong>of</strong> dough density us<strong>in</strong>g the double cup method. On<br />
<strong>in</strong>creas<strong>in</strong>g the <strong>sugar</strong> content the dough density <strong>in</strong>creases. Pressure step change experiments were conducted<br />
dur<strong>in</strong>g mix<strong>in</strong>g <strong>with</strong> doughs conta<strong>in</strong><strong>in</strong>g 0% and 15% <strong>sugar</strong>. Through calculat<strong>in</strong>g the density us<strong>in</strong>g the double<br />
cup method and <strong>in</strong>putt<strong>in</strong>g this data <strong>in</strong>to a population balance model <strong>of</strong> aeration, entra<strong>in</strong>ment and<br />
disentra<strong>in</strong>ment rates were calculated. Results showed that doughs conta<strong>in</strong><strong>in</strong>g 15% <strong>sugar</strong> had a lower steady<br />
state voidage than doughs conta<strong>in</strong><strong>in</strong>g 0% <strong>sugar</strong>. Doughs conta<strong>in</strong><strong>in</strong>g 15% <strong>sugar</strong> had both lower air<br />
entra<strong>in</strong>ment rates and higher air disentra<strong>in</strong>ment coefficients than doughs conta<strong>in</strong><strong>in</strong>g 0% <strong>sugar</strong>.<br />
Keywords: Bread; Dough; Sugar; Aeration; Bubbles<br />
INTRODUCTION<br />
Bread is a worldwide staple food available <strong>in</strong> many shapes and variations. Sweetened <strong>bread</strong> products <strong>in</strong> the<br />
UK such as fruit loaves and Chelsea buns conta<strong>in</strong> <strong>sugar</strong>, and are further sweetened <strong>with</strong> dried fruit, <strong>sugar</strong><br />
glazes or both. This reflects the desire to further sweeten these products. Bakers use the term, “bakers<br />
percentage”. This is the percentage <strong>of</strong> an <strong>in</strong>gredient <strong>in</strong> relation to the quantity <strong>of</strong> flour present. The addition<br />
<strong>of</strong> more than 10% <strong>sugar</strong> <strong>in</strong> the <strong>bread</strong> formulation poses a challenge to bakers [1], due to the presence <strong>of</strong> <strong>sugar</strong><br />
result<strong>in</strong>g <strong>in</strong> sticky dough, mak<strong>in</strong>g the dough difficult to handle and caus<strong>in</strong>g it to stick to process<strong>in</strong>g<br />
equipment. Dough’s bubble structure is also affected by the presence <strong>of</strong> <strong>sugar</strong>, which affects the quality <strong>of</strong><br />
the <strong>bread</strong> produced. In African and Asian countries, <strong>bread</strong> conta<strong>in</strong><strong>in</strong>g as much as 30% <strong>sugar</strong> exists [2]. It is<br />
produced us<strong>in</strong>g stra<strong>in</strong>s <strong>of</strong> yeast tolerant to high <strong>sugar</strong> concentrations. However, the process<strong>in</strong>g equipment is<br />
likely to differ to that used <strong>in</strong> the UK.<br />
Ample research has been carried out on the presence <strong>of</strong> bran, salt and surfactants <strong>with</strong><strong>in</strong> <strong>bread</strong><br />
dough, but a literature search through scientific databases found very little research has been carried out on<br />
the presence <strong>of</strong> <strong>sugar</strong> <strong>in</strong> the <strong>bread</strong> dough formulation. The aim <strong>of</strong> this research is to <strong>in</strong>vestigate how <strong>sugar</strong><br />
changes the behaviour <strong>of</strong> a basic dough (dough made from flour, water, yeast, and salt) made up <strong>in</strong> a high<br />
speed mechanical mixer and how it affects the <strong>bread</strong> made from this dough. This work shows the differences<br />
<strong>in</strong> entra<strong>in</strong>ment and disentra<strong>in</strong>ment rates <strong>in</strong> doughs conta<strong>in</strong><strong>in</strong>g 0% <strong>sugar</strong> and 15% <strong>sugar</strong>, and illustrates the<br />
voidage differences <strong>in</strong> doughs mixed at different pressures and conta<strong>in</strong><strong>in</strong>g different quantities <strong>of</strong> <strong>sugar</strong>. Bread<br />
dough consists <strong>of</strong> gas <strong>bubbles</strong> held <strong>in</strong> a gluten-starch matrix. The voidage is known as the proportion <strong>of</strong> gas<br />
present <strong>in</strong> the <strong>bread</strong> dough.<br />
The high speed mechanical mix<strong>in</strong>g used is known as the Chorleywood Bread Process (CBP) and<br />
achieves dough development <strong>in</strong> less than five m<strong>in</strong>utes. When dough is developed, it becomes a viscoelastic<br />
material capable <strong>of</strong> reta<strong>in</strong><strong>in</strong>g expand<strong>in</strong>g gas <strong>bubbles</strong>. The CBP is the ma<strong>in</strong> <strong>bread</strong>mak<strong>in</strong>g process <strong>in</strong> the UK as<br />
well as Australia, New Zealand, South Africa and a number <strong>of</strong> other countries worldwide, thus research<br />
focused on this method <strong>of</strong> produc<strong>in</strong>g high <strong>sugar</strong> doughs may be beneficial to a number <strong>of</strong> countries.<br />
The <strong>bubbles</strong> <strong>in</strong> <strong>bread</strong>, from the number <strong>of</strong> <strong>bubbles</strong> to their size, distribution and orientation,<br />
determ<strong>in</strong>e the quality <strong>of</strong> <strong>bread</strong>. A key quality attribute bakers strive for is a f<strong>in</strong>e bubble distribution. All<br />
stages <strong>of</strong> <strong>bread</strong>mak<strong>in</strong>g <strong>in</strong>volve manipulation <strong>of</strong> gas <strong>bubbles</strong>. Mix<strong>in</strong>g folds the dough over itself, trapp<strong>in</strong>g air<br />
between layers <strong>of</strong> dough and creat<strong>in</strong>g the <strong>in</strong>itial <strong>bubbles</strong>. Mould<strong>in</strong>g subdivides these <strong>bubbles</strong>, <strong>in</strong>creas<strong>in</strong>g the<br />
number <strong>of</strong> <strong>bubbles</strong> present. Dur<strong>in</strong>g prov<strong>in</strong>g these <strong>bubbles</strong> are <strong>in</strong>flated <strong>with</strong> carbon dioxide produced by yeast.
F<strong>in</strong>ally, dur<strong>in</strong>g bak<strong>in</strong>g, the <strong>bubbles</strong> embedded <strong>in</strong> the prote<strong>in</strong> starch matrix ruptures and gas escapes from<br />
these <strong>bubbles</strong>. As the heat causes the structure <strong>of</strong> the <strong>bread</strong> to set, the dough becomes <strong>in</strong>terconnected <strong>with</strong><br />
<strong>bubbles</strong>. Adapt<strong>in</strong>g the CBP, through first understand<strong>in</strong>g how <strong>sugar</strong> affects each <strong>of</strong> these stages may be the<br />
key to produc<strong>in</strong>g high <strong>sugar</strong> <strong>bread</strong>s.<br />
MATERIALS & METHODS<br />
The Effect <strong>of</strong> Sugar on Dough Density after Mix<strong>in</strong>g<br />
Doughs were made up <strong>in</strong> a Tweedy 1 mixer, operated at a speed <strong>of</strong> 720rpm. Doughs were mixed under<br />
compressed air for three m<strong>in</strong>utes at absolute pressures <strong>of</strong> 0.25 bara, 0.50 bara, 1.00 bara, 1.50 bara, 2.00 bara<br />
and 2.50 bara, whilst ma<strong>in</strong>ta<strong>in</strong><strong>in</strong>g the flow rate <strong>of</strong> compressed air at 10-15L/m<strong>in</strong> when mix<strong>in</strong>g above<br />
atmospheric pressure. Doughs were made up from both strong and weak flour (3663, High Wycombe, UK).<br />
The weak flour had a prote<strong>in</strong> content <strong>of</strong> 10.1% and the strong had a prote<strong>in</strong> content <strong>of</strong> 11.0%, as stated on the<br />
packag<strong>in</strong>g. Tap water was used, and its temperature controlled us<strong>in</strong>g ice to achieve a f<strong>in</strong>al dough temperature<br />
<strong>of</strong> 30±2°C. Caster <strong>sugar</strong> (Tate and Lyle, London, UK) was used due to its f<strong>in</strong>eness. Table salt and fresh yeast<br />
were purchased from a local supermarket (Sa<strong>in</strong>sburys, London, UK). The dough formulations made up are<br />
listed <strong>in</strong> Table 1. Six samples were taken from each dough mix and the density <strong>of</strong> each measured us<strong>in</strong>g<br />
Campbell et al’s double cup technique [3]. This <strong>in</strong>volves us<strong>in</strong>g the weight <strong>of</strong> the dough <strong>in</strong> air and the weight<br />
<strong>of</strong> the dough <strong>in</strong> silicon oil (Basildon Chemicals, Oxon, UK) to calculate the density <strong>of</strong> the dough, as detailed<br />
<strong>in</strong> (1). Silicon oil was used as it is a low hazard, non-wett<strong>in</strong>g and non-dissolv<strong>in</strong>g liquid.<br />
Table 1. Dough formulation. The first number for the water quantity is that used <strong>in</strong> the strong flour dough formulation<br />
and the second number is the quantity <strong>of</strong> water used <strong>in</strong> the weak flour dough formulation.<br />
Sugar Content (%) Sugar (g) Flour (g) Yeast (g) Salt (g) Water (g)<br />
0.0 0 400 10 7.2 232 / 225<br />
1.5 6 400 10 7.2 232 / 225<br />
5.0 20 400 10 7.2 232 / 225<br />
10.0 40 400 10 7.2 232 / 225<br />
15.0 60 400 10 7.2 232 / 225<br />
mair<br />
d<br />
<br />
m m<br />
air<br />
Where ρ d is the dough density; m air and m oil the weight <strong>of</strong> the dough <strong>in</strong> air and oil; and ρ oil is the density <strong>of</strong><br />
the oil.<br />
Pressure Step Change dur<strong>in</strong>g Mix<strong>in</strong>g<br />
Both pressure step <strong>in</strong>crease and pressure step decrease experiments were conducted <strong>in</strong> a Tweedy 1 mixer. In<br />
the pressure step <strong>in</strong>crease experiment, the pressure was changed from 1.0 to 2.0 bara us<strong>in</strong>g compressed air. In<br />
the pressure step decrease experiment the pressure was changed from 1.0 bara to 0.5 bara. For both<br />
experiments the doughs were mixed for 230 seconds, <strong>with</strong> the step change at 110 seconds. Numerous mix<strong>in</strong>g<br />
sessions were carried out us<strong>in</strong>g separate dough mixes <strong>of</strong> the 0% and 15% <strong>sugar</strong> strong and weak flour dough<br />
formulations <strong>in</strong> Table 1. The times <strong>in</strong> seconds <strong>in</strong> which mix<strong>in</strong>g was stopped to take density measurements<br />
were 110, 115, 120, 130, 140, 150, 160, 170, 180, 190, 200, 210, 220, 230. The density <strong>of</strong> the dough was<br />
taken us<strong>in</strong>g the double cup method detailed above. By <strong>in</strong>putt<strong>in</strong>g the values for dough density <strong>in</strong>to a<br />
population balance model <strong>of</strong> aeration developed by Mart<strong>in</strong> et al [4], the entra<strong>in</strong>ment and disentra<strong>in</strong>ment rates<br />
were obta<strong>in</strong>ed.<br />
oil<br />
<br />
oil<br />
(1)
Density <strong>of</strong> Dough removed from Mixer<br />
RESULTS & DISCUSSION<br />
The Effect <strong>of</strong> Sugar on Dough Density after Mix<strong>in</strong>g<br />
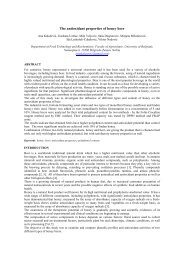
Figure 1 shows the density <strong>of</strong> strong flour doughs conta<strong>in</strong><strong>in</strong>g different quantities <strong>of</strong> <strong>sugar</strong> mixed at different<br />
pressures. Throughout all the doughs, as the pressure <strong>in</strong>creases, the density <strong>of</strong> the dough once removed from<br />
the mixer decreases. This is due to the <strong>in</strong>crease <strong>in</strong> pressure caus<strong>in</strong>g more air molecules to enter the mixer<br />
headspace and thus the dough, once the pressure is released the <strong>bubbles</strong> expand. The doughs conta<strong>in</strong><strong>in</strong>g<br />
10.0% and 15.0% <strong>sugar</strong> also consistently have a lower voidage. There is some overlap <strong>in</strong> results between the<br />
0.0%, 1.5% and 5.0% <strong>sugar</strong> doughs, where a less dense dough has been obta<strong>in</strong>ed <strong>in</strong> doughs conta<strong>in</strong><strong>in</strong>g 1.5%<br />
and 5.0% <strong>sugar</strong> than 0.0% <strong>sugar</strong>, although this effect is <strong>with</strong><strong>in</strong> the bounds <strong>of</strong> experimental error. It is known<br />
that bakers sometimes add 1.0-2.0% <strong>sugar</strong> to the dough formulation to favour the growth <strong>of</strong> yeast. The results<br />
<strong>in</strong> Figure 1 may suggest that up to 5.0% <strong>sugar</strong> has the beneficial effect <strong>of</strong> also lower<strong>in</strong>g the dough density. A<br />
sticky dough mak<strong>in</strong>g entra<strong>in</strong>ment <strong>of</strong> air dur<strong>in</strong>g mix<strong>in</strong>g less efficient may be a cause <strong>of</strong> denser doughs <strong>in</strong> the<br />
10.0% and 15.0% <strong>sugar</strong> doughs. Sugar also successfully competes <strong>with</strong> starch and prote<strong>in</strong>s for water. Water<br />
is required for the hydration <strong>of</strong> starch and prote<strong>in</strong> which make up bubble walls, thus the presence <strong>of</strong> less<br />
available water could <strong>in</strong>terfere <strong>with</strong> this. The gas free dough density <strong>of</strong> each dough can be obta<strong>in</strong>ed by<br />
extrapolation to an absolute pressure <strong>of</strong> 0.0 bara. In Figure 1, extension <strong>of</strong> the l<strong>in</strong>ear fit l<strong>in</strong>e would show a<br />
general <strong>in</strong>crease <strong>in</strong> the gas free dough density <strong>with</strong> an <strong>in</strong>crease <strong>in</strong> <strong>sugar</strong>. Experimental repeats <strong>with</strong> the weak<br />
flour dough illustrated the same trend.<br />
1.30<br />
1.25<br />
1.20<br />
1.15<br />
1.10<br />
0.0% <strong>sugar</strong><br />
1.5% <strong>sugar</strong><br />
5.0% <strong>sugar</strong><br />
10.0% <strong>sugar</strong><br />
15.0% <strong>sugar</strong><br />
1.05<br />
0.0 0.5 1.0 1.5 2.0 2.5<br />
Figure 1. Change <strong>in</strong> density at different pressures <strong>with</strong> different <strong>sugar</strong> content strong flour doughs. A l<strong>in</strong>ear fit l<strong>in</strong>e has<br />
been applied to each set <strong>of</strong> po<strong>in</strong>ts. The error bars <strong>in</strong>dicate the standard deviation <strong>of</strong> the six measured samples.<br />
Pressure Step Change dur<strong>in</strong>g Mix<strong>in</strong>g<br />
Mixer Headspace Absolute Pressure (Bara)<br />
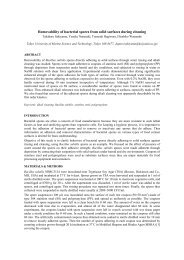
Figures 2 shows the results <strong>of</strong> the pressure step <strong>in</strong>crease experiment for two strong flour doughs. It shows a<br />
sudden decrease <strong>in</strong> <strong>in</strong>-situ voidage on <strong>in</strong>creas<strong>in</strong>g the pressure. The voidage decreases because the pressure<br />
<strong>in</strong>crease compresses the <strong>bubbles</strong> and reduces their volume. As mix<strong>in</strong>g cont<strong>in</strong>ues the voidage <strong>in</strong>creases as<br />
more air is entra<strong>in</strong>ed than disentra<strong>in</strong>ed. The levell<strong>in</strong>g <strong>of</strong>f and reach<strong>in</strong>g <strong>of</strong> steady state observed beyond 200<br />
seconds, is due to the air entra<strong>in</strong>ment rate becom<strong>in</strong>g balanced <strong>with</strong> the disentra<strong>in</strong>ment rate, which <strong>in</strong>creases<br />
<strong>with</strong> voidage. The result for the 0% <strong>sugar</strong> dough at 230 seconds is likely to be an anomaly, s<strong>in</strong>ce it appears<br />
as though the voidage was levell<strong>in</strong>g <strong>of</strong>f. The dough conta<strong>in</strong><strong>in</strong>g no <strong>sugar</strong> consistently has a higher voidage<br />
than the dough conta<strong>in</strong><strong>in</strong>g 15% <strong>sugar</strong> which corresponds to the results displayed <strong>in</strong> Figure 1. Experimental<br />
repeats <strong>with</strong> the weak flour dough illustrated the same trend.
Voidage <strong>of</strong> Dough Removed<br />
from Mixer<br />
Voidage <strong>of</strong> Dough removed<br />
from Mixer<br />
0.09<br />
0.08<br />
0.07<br />
0.06<br />
0.05<br />
0.04<br />
0.03<br />
0.02<br />
0.01<br />
0<br />
90 110 130 150 170 190 210 230 250<br />
Time (seconds)<br />
0% <strong>sugar</strong><br />
15%<br />
<strong>sugar</strong><br />
Figure 2. Pressure step change experiment for strong flour doughs <strong>with</strong> an <strong>in</strong>crease <strong>in</strong> headspace pressure from 1 bara to<br />
2 bara occurr<strong>in</strong>g at 110 seconds. Error bars <strong>in</strong>dicate the standard deviation <strong>of</strong> six measured samples.<br />
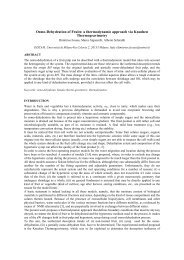
Figure 3 shows the results <strong>of</strong> the pressure step decrease experiment for two strong flour doughs. The opposite<br />
trend to that shown <strong>in</strong> Figure 2 is displayed. It shows a sudden <strong>in</strong>crease <strong>in</strong> voidage on decreas<strong>in</strong>g the<br />
pressure. The cause to the voidage <strong>in</strong>crease is the pressure decrease pull<strong>in</strong>g the <strong>bubbles</strong> outwards and<br />
result<strong>in</strong>g <strong>in</strong> the <strong>bubbles</strong> occupy<strong>in</strong>g a larger volume. However, <strong>in</strong> addition to their expansion, a number <strong>of</strong><br />
<strong>bubbles</strong> will also rupture. It can take up to 15 seconds for the mixer to reach a pressure <strong>of</strong> 0.5 bara. As the air<br />
is sucked out <strong>of</strong> the mixer and a partial vacuum is obta<strong>in</strong>ed, the entra<strong>in</strong>ment <strong>of</strong> air becomes difficult. New<br />
<strong>bubbles</strong> cannot be formed through mix<strong>in</strong>g under a vacuum [5]. Consistent <strong>with</strong> Figures 1 and 2 the dough<br />
conta<strong>in</strong><strong>in</strong>g no <strong>sugar</strong> consistently has a greater voidage than the dough conta<strong>in</strong><strong>in</strong>g 15% <strong>sugar</strong>. Experimental<br />
repeats <strong>with</strong> the weak flour dough illustrated the same trend.<br />
0.12<br />
0.1<br />
0.08<br />
0.06<br />
0.04<br />
0.02<br />
0% <strong>sugar</strong><br />
15% <strong>sugar</strong><br />
0<br />
90 110 130 150 170 190 210 230 250<br />
Time (seconds)<br />
Figure 3. Pressure step decrease experiment <strong>with</strong> the decrease <strong>in</strong> pressure from one bara to half bara occurr<strong>in</strong>g at 110<br />
seconds.<br />
Tables 2 and 3 show the entra<strong>in</strong>ment rate and disentra<strong>in</strong>ment coefficient for the pressure step change<br />
experiments. In the pressure step <strong>in</strong>crease experiment, the ratio <strong>of</strong> entra<strong>in</strong>ment rate to disentra<strong>in</strong>ment<br />
coefficient is approximately 1.6 times greater <strong>in</strong> the doughs conta<strong>in</strong><strong>in</strong>g no <strong>sugar</strong> than the dough conta<strong>in</strong><strong>in</strong>g<br />
15% <strong>sugar</strong>, imply<strong>in</strong>g greater aeration <strong>of</strong> doughs conta<strong>in</strong><strong>in</strong>g no <strong>sugar</strong>, <strong>in</strong> agreement <strong>with</strong> the results <strong>in</strong> Figure<br />
1. In the pressure step decrease experiment, the entra<strong>in</strong>ment rate to disentra<strong>in</strong>ment coefficient is<br />
approximately 4.5 times greater <strong>in</strong> the no <strong>sugar</strong> strong flour dough than 15% <strong>sugar</strong> strong flour dough and<br />
approximately 5.1 times greater <strong>in</strong> the no <strong>sugar</strong> weak flour dough than 15% <strong>sugar</strong> weak flour dough. Tak<strong>in</strong>g
<strong>in</strong>to account the voidage <strong>of</strong> the dough before and immediately after the step change, the proportion the<br />
voidage changed was calculated. Although the quantity <strong>of</strong> the voidage changes varies between doughs<br />
conta<strong>in</strong><strong>in</strong>g no <strong>sugar</strong> and 15% <strong>sugar</strong>, the proportion to the voidage before the step change <strong>of</strong> which the<br />
voidage changes is similar. S<strong>in</strong>ce the same proportion <strong>of</strong> air is entra<strong>in</strong>ed or disentra<strong>in</strong>ed, this suggests that the<br />
difference <strong>in</strong> dough density is based on the steady state density <strong>of</strong> each dough, which as illustrated <strong>in</strong> Figure<br />
1 is lower <strong>in</strong> the dough conta<strong>in</strong><strong>in</strong>g more <strong>sugar</strong>. As the <strong>in</strong>ternal structure <strong>of</strong> the dough has not been observed at<br />
this key stage, it is not known if the voidage decrease observed dur<strong>in</strong>g the pressure step <strong>in</strong>crease experiments<br />
is due to more <strong>bubbles</strong> ruptur<strong>in</strong>g or shr<strong>in</strong>k<strong>in</strong>g. Conversely, it is not known if the voidage <strong>in</strong>crease observed<br />
dur<strong>in</strong>g the pressure step decrease is due to the <strong>bubbles</strong> expand<strong>in</strong>g or more <strong>bubbles</strong> form<strong>in</strong>g. It is unlikely to<br />
be due to the formation <strong>of</strong> new <strong>bubbles</strong> s<strong>in</strong>ce mix<strong>in</strong>g is necessary <strong>in</strong> the formation <strong>of</strong> new <strong>bubbles</strong>. Sugar<br />
weakens the gluten structure [1], thus mak<strong>in</strong>g rupture <strong>of</strong> <strong>bubbles</strong> more likely. It may be that for the doughs<br />
conta<strong>in</strong><strong>in</strong>g 15% <strong>sugar</strong>, bubble rupture at the surface lead<strong>in</strong>g to gas disentra<strong>in</strong>ment is more likely than <strong>in</strong><br />
doughs conta<strong>in</strong><strong>in</strong>g no <strong>sugar</strong>, especially at this po<strong>in</strong>t <strong>in</strong> mix<strong>in</strong>g when the gluten has not had sufficient time to<br />
develop.<br />
The entra<strong>in</strong>ment and disentra<strong>in</strong>ment rates for the two flours show similar rates throughout the<br />
mix<strong>in</strong>g process. The largest difference between the entra<strong>in</strong>ment and disentra<strong>in</strong>ment ratio <strong>in</strong> the two flours is<br />
<strong>in</strong> the 0% <strong>sugar</strong> dough <strong>with</strong> a pressure step decrease. However, when exam<strong>in</strong><strong>in</strong>g the proportional change <strong>in</strong><br />
voidage before and after the step change, they both change by a factor <strong>of</strong> 1.89. This illustrates that <strong>sugar</strong> is<br />
responsible for the changes <strong>in</strong> the entra<strong>in</strong>ment and disentra<strong>in</strong>ment rates.<br />
Table 2. Entra<strong>in</strong>ment rate, disentra<strong>in</strong>ment coefficients and voidage changes for different strong flour doughs follow<strong>in</strong>g<br />
pressure step changes dur<strong>in</strong>g mix<strong>in</strong>g. PSI stands for pressure step <strong>in</strong>crease and PSD stands for pressure step decrease.<br />
Mix<br />
Entra<strong>in</strong>ment, Disentra<strong>in</strong>ment, v/k Voidage change at<br />
v (rev -1 )<br />
k (rev -1 )<br />
step change<br />
PSI, 0% <strong>sugar</strong> 8.05x10 -5 0.897x10 -3 0.0898 ± 0.00149 Decrease 0.0259<br />
± 1.23x10 -6 ± 2.78x10 -5 (x 0.513)<br />
PSI, 15% <strong>sugar</strong> 7.12x10 -5 1.30x10 -3 0.0547 ± 0.000905 Decrease 0.0186<br />
± 1.04x10 -6 ± 3.80x10 -5 (x 0.511)<br />
PSD, 0% <strong>sugar</strong> 7.00x10 -5 1.15x10 -3 0.0669 ± 0.00379 Increase 0.0489<br />
± 2.20x10 -6 ± 2.73x10 -5 (x 1.89)<br />
PSD, 15% <strong>sugar</strong> 3.50x10 -5 2.56x10 -3 0.0150 ± 0.00454 Increase 0.0353<br />
± 9.27x10 -7 ± 3.09x10 -5 (x 1.93)<br />
Table 3. Entra<strong>in</strong>ment rate, disentra<strong>in</strong>ment coefficients and voidage changes for different weak flour doughs follow<strong>in</strong>g<br />
pressure step changes dur<strong>in</strong>g mix<strong>in</strong>g. PSI stands for pressure step <strong>in</strong>crease and PSD stands for pressure step decrease.<br />
Mix<br />
Entra<strong>in</strong>ment, Disentra<strong>in</strong>ment, v/k Voidage change at<br />
v (rev -1 )<br />
k (rev -1 )<br />
step change<br />
PSI, 0% <strong>sugar</strong> 8.08x10 -5 0.904x10 -3 0.0894 ± 0.00130 Decrease 0.0280<br />
± 1.06x10 -6 ± 2.54x10 -5 (x 0.516)<br />
PSI, 15% <strong>sugar</strong> 6.24x10 -5 1.14x10 -3 0.0546 ± 0.000770 Decrease 0.0209<br />
± 1.40x10 -6 ± 4.05x10 -5 (x 0.511)<br />
PSD, 0% <strong>sugar</strong> 13.4x10 -5 1.74x10 -3 0.0768 ± 0.00553 Increase 0.0513<br />
± 4.08x10 -5 ± 7.90x10 -5 (x 1.89)<br />
PSD, 15% <strong>sugar</strong> 4.56x10 -5 3.08x10 -3 0.0148 ± 0.00169 Increase 0.0356<br />
± 7.71x10 -7 ± 3.03x10 -5 (x 1.92)<br />
CONCLUSION<br />
This study has illustrated some key ways <strong>in</strong> which dough <strong>sugar</strong> content affects the aeration processes dur<strong>in</strong>g<br />
<strong>bread</strong> dough mix<strong>in</strong>g. Less dense dough was obta<strong>in</strong>ed follow<strong>in</strong>g mix<strong>in</strong>g <strong>with</strong> more <strong>sugar</strong> <strong>in</strong>dicat<strong>in</strong>g a change<br />
<strong>in</strong> the rates <strong>of</strong> gas entra<strong>in</strong>ment and disentra<strong>in</strong>ment dur<strong>in</strong>g mix<strong>in</strong>g. Although results show the addition <strong>of</strong> more<br />
<strong>sugar</strong> generally <strong>in</strong>creases the density <strong>of</strong> dough, it is not known if this <strong>in</strong>crease <strong>in</strong> density is due to a decrease<br />
<strong>in</strong> the number <strong>of</strong> gas <strong>bubbles</strong> or a decrease <strong>in</strong> the size <strong>of</strong> these <strong>bubbles</strong>. Results <strong>of</strong> the step change<br />
experiments show less entra<strong>in</strong>ment <strong>of</strong> air and suggest a weaken<strong>in</strong>g <strong>of</strong> the bubble structure so that doughs<br />
conta<strong>in</strong><strong>in</strong>g more <strong>sugar</strong> cannot reta<strong>in</strong> as large a quantity <strong>of</strong> air. If this were the case, fewer <strong>bubbles</strong> would be<br />
present due to the likely rupture <strong>of</strong> a larger proportion <strong>of</strong> <strong>bubbles</strong> later on <strong>in</strong> the <strong>bread</strong>mak<strong>in</strong>g process. A<br />
method employ<strong>in</strong>g x-ray imag<strong>in</strong>g is currently be<strong>in</strong>g developed to <strong>in</strong>vestigate the <strong>in</strong>ternal structure <strong>of</strong> <strong>bread</strong><br />
dough.
REFERENCES<br />
[1] McGee H. 2004. McGee on Food and Cook<strong>in</strong>g, Hodder & Stoughton, London, 525.<br />
[2] Cauva<strong>in</strong> S. P., Young L. S., 2007. Technology <strong>of</strong> Breadmak<strong>in</strong>g, Spr<strong>in</strong>ger Science & Bus<strong>in</strong>ess Media, New York, 87.<br />
[3] Campbell G. M., Herrero-Sanchez R., Payo-Rodriguez R., Merchan M. L., 2001. Measurement <strong>of</strong> Dynamic dough<br />
Density, and the Effect <strong>of</strong> Surfactants and Flour Type on Aeration dur<strong>in</strong>g Mix<strong>in</strong>g and Gas Retention dur<strong>in</strong>g Prov<strong>in</strong>g.<br />
Cereal Chemistry, (78), 272-277.<br />
[4] Mart<strong>in</strong> P.J., Ch<strong>in</strong> N. L., Campbell G. M. 2004. Aeration Dur<strong>in</strong>g Bread Dough Mix<strong>in</strong>g II. A Population Balance Model<br />
<strong>of</strong> Aeration. Food and Bioproducts Process<strong>in</strong>g, 82(C4), 268-281.<br />
[5] Baker J. C., Mize M. D., 1941. The Orig<strong>in</strong> <strong>of</strong> the Gas Cell <strong>in</strong> Bread Dough. Cereal Chemistry, (18), 19-34.