Oil migration from whole almonds to surrounding chocolate
Oil migration from whole almonds to surrounding chocolate
Oil migration from whole almonds to surrounding chocolate

You also want an ePaper? Increase the reach of your titles
YUMPU automatically turns print PDFs into web optimized ePapers that Google loves.
<strong>Oil</strong> <strong>migration</strong> <strong>from</strong> <strong>whole</strong> <strong>almonds</strong> <strong>to</strong> <strong>surrounding</strong> <strong>chocolate</strong><br />
K.L. McCarthy a , A. Altan b , M.J. McCarthy a ,<br />
a Dept. of Food Science and Technology, University of California, Davis, Davis, CA, USA<br />
(klmccarthy@ucdavis.edu; mjmccarthy@ucdavis.edu)<br />
b Dept. of Food Engineering, University of Mersin, Ciftlikkoy, Mersin, Turkey (aaltan@mersin.edu.tr)<br />
ABSTRACT<br />
<strong>Oil</strong> <strong>migration</strong> <strong>from</strong> high oil content <strong>whole</strong> <strong>almonds</strong> in<strong>to</strong> enrobing <strong>chocolate</strong> can cause changes in product<br />
quality. The objective of this study was <strong>to</strong> evaluate oil <strong>migration</strong> <strong>from</strong> <strong>whole</strong> <strong>almonds</strong> in<strong>to</strong> <strong>surrounding</strong><br />
<strong>chocolate</strong> as a function of almond roasting conditions, <strong>chocolate</strong> formulation, and s<strong>to</strong>rage conditions. Plastic<br />
sample containers were designed <strong>to</strong> have 8 compartments and a protective lid. Each compartment contained<br />
an almond embedded in either dark or milk <strong>chocolate</strong>. Roasting conditions for the <strong>almonds</strong> were air roasted<br />
or oil roasted. Sample containers were s<strong>to</strong>red at 20, 25, and 30ºC for 400 days. Magnetic resonance imaging<br />
(MRI) was used <strong>to</strong> moni<strong>to</strong>r spatial and temporal changes of liquid lipid content over the experimental time<br />
frame. A multi-slice spin echo pulse (MSSE) sequence was used <strong>to</strong> acquire images with a 6.9 ms echo time<br />
and a 1000 ms repetition time using 1.03T Aspect AI MRI spectrometer. Data analysis was performed by<br />
identifying the almond region and <strong>chocolate</strong> region in each image and quantifying liquid oil content in those<br />
regions. No detectable oil <strong>migration</strong> occurred in any of the sample trays. This assessment was based on the<br />
average signal intensity in each region and its coefficient of variation. The goal of this work was <strong>to</strong> provide<br />
the California almond industry with processing and s<strong>to</strong>rage guidelines that ensure the maintenance of high<br />
quality almond confectionary products.<br />
Keywords: <strong>almonds</strong>; <strong>chocolate</strong>; magnetic resonance imaging (MRI); oil <strong>migration</strong><br />
INTRODUCTION<br />
The intent of this research project was <strong>to</strong> improve knowledge about the impact of processing and s<strong>to</strong>rage on<br />
oil <strong>migration</strong> <strong>from</strong> <strong>whole</strong> <strong>almonds</strong> <strong>to</strong> <strong>surrounding</strong> media. This knowledge will be helpful in designing<br />
appropriate processing, s<strong>to</strong>rage and formulations for <strong>whole</strong> <strong>almonds</strong> in confectionary products.<br />
Specific objectives:<br />
1. Quantify oil <strong>migration</strong> <strong>from</strong> <strong>almonds</strong> as a function of roasting conditions,<br />
2. Quantify oil <strong>migration</strong> <strong>from</strong> <strong>almonds</strong> as a function of s<strong>to</strong>rage temperature (e.g., 20, 25, 30ºC), and<br />
3. Quantify the influence of <strong>surrounding</strong> media on the <strong>migration</strong> of oil <strong>from</strong> <strong>almonds</strong>.<br />
MATERIALS & METHODS<br />
Experimental design<br />
To evaluate oil <strong>migration</strong>, <strong>almonds</strong> were embedded in dark <strong>chocolate</strong> or milk <strong>chocolate</strong>. The experimental<br />
fac<strong>to</strong>rs were: type of roast (air and oil), level of roast (light, medium and heavy), and s<strong>to</strong>rage temperature (20,<br />
25, and 30ºC). Trays which contained 6 embedded <strong>almonds</strong> and a raw almond as reference were prepared in<br />
late summer 2009. Data were acquired through December 2010 <strong>to</strong> assess s<strong>to</strong>rage stability.<br />
Sample preparation<br />
Almonds (Nonpareil variety) were provided by the Almond Board of California (Modes<strong>to</strong>, CA). Two types<br />
of <strong>almonds</strong> were provided: raw and commercially air roasted <strong>almonds</strong> at different roasting levels. The<br />
roasting conditions of air roasted <strong>almonds</strong> were as follows: 137.8C for 22 min; 148.9C for 19 min; 160C<br />
for 16 min. Roasting ranged <strong>from</strong> qualitatively light roast <strong>to</strong> heavy roast. The <strong>almonds</strong> were sorted <strong>to</strong> obtain<br />
uniformly shaped, unbroken, and minimally scuffed pieces for use in the study. In addition, the mass of each<br />
almond was between 1.10 and 1.25 g. The sorted raw <strong>almonds</strong> were divided in<strong>to</strong> two groups: one group was<br />
oil roasted and the other group was used as the control. The oil roasting was performed in cocoa butter <strong>to</strong><br />
ensure that only two types of fat were present: cocoa butter and almond oil. For oil roasting in cocoa butter,<br />
40 g of <strong>almonds</strong> were placed in an enclosed wire mesh basket and submerged in a Fisher HiTemp Bath<br />
(Model 160A, Fisher Scientific) containing 2 L of cocoa butter maintained at the roasting temperature. The<br />
oil temperature was moni<strong>to</strong>red using a digital thermometer connected with 2 type K thermocouples. The
oasting time was 10 min at 130ºC for light roast, 135ºC for medium roast, and 140ºC for heavy roast.<br />
Commercial dark <strong>chocolate</strong> (Solitaire) and milk <strong>chocolate</strong> (Heritage) were purchased <strong>from</strong> Guittard<br />
Chocolate Company (Burlingame, CA). Dark <strong>chocolate</strong> was semi-sweet <strong>chocolate</strong>; ingredients included<br />
sugar, <strong>chocolate</strong> liquor, cocoa butter, soya lecithin and pure vanilla. Milk <strong>chocolate</strong> consisted of sugar, cocoa<br />
butter, milk, <strong>chocolate</strong> liquor, soya lecithin and pure vanilla. Cocoa solid contents of dark <strong>chocolate</strong> and milk<br />
<strong>chocolate</strong> were 63% and 32.5 %, respectively. Complete proximate analyses for the <strong>almonds</strong> and the<br />
<strong>chocolate</strong>s are given in Table 1. The <strong>chocolate</strong>s were tempered using a tempering machine (Revolation2,<br />
ChocoVision Corp., Poughkeepsie, NY).<br />
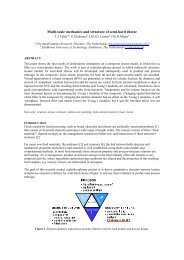
Each tray had eight compartments, each with dimensions of 14.5 mm wide, 26 mm long and 25.5 mm depth,<br />
and a protective lid (Wilmad-Labglass, Buena, NJ). Six treated <strong>almonds</strong> (embedded) and one raw almond<br />
(not embedded) were included in the tray. Compartments were numbered as given in Fig. 1. Detailed<br />
designation of batches and samples is given in Table 2.<br />
Table 1. Proximate analyses for <strong>almonds</strong> and <strong>chocolate</strong>, given in percent (wb). Analyses performed by Covance<br />
Labora<strong>to</strong>ries Inc. (Madison, WI).<br />
Substrate type Fat Moisture Carbohydrates Protein Ash Sum<br />
(as measured)<br />
Raw Almonds 52.1 5.1 21.5 19.4 3.1 101.2 54.9<br />
Air Roasted - Light 54.7 2.8 20.8 20.3 3.1 101.7 56.2<br />
Air Roasted - Medium 53.3 2.9 22.3 19.7 3.1 101.3 54.9<br />
Air Roasted - Heavy 53.7 3.0 21.3 19.9 3.0 100.9 55.3<br />
Cocoa Butter Roasted - Light 55.5 3.9 19.1 19.6 3.0 101.1 57.7<br />
Cocoa Butter Roasted - Medium 55.7 3.6 19.1 19.7 3.1 101.2 57.8<br />
Cocoa Butter Roasted - Heavy 55.2 3.8 20.2 18.8 2.9 100.9 57.4<br />
Dark Choc - Guittard 33.1 0.4 61.8 4.82 2.1 102.2 33.2<br />
Milk Choc - Guittard 32.5 0.6 62.8 5.26 1.6 102.8 32.7<br />
Fat<br />
(db)<br />
Table 2. Detailed designation of Batches and Samples (compartment numbers are given). Two trays each were s<strong>to</strong>red at<br />
20, 25, and 30ºC. The temperature was constant <strong>to</strong> ±0.5ºC in each of the incuba<strong>to</strong>rs.<br />
Batch Type of almond Surrounding medium<br />
A Air roast Cocoa butter roast<br />
1-heavy 5-heavy Dark <strong>chocolate</strong> Dark <strong>chocolate</strong><br />
2-medium 6-medium Dark <strong>chocolate</strong> Dark <strong>chocolate</strong><br />
3-light 7-light Dark <strong>chocolate</strong> Dark <strong>chocolate</strong><br />
4-no sample<br />
8- Raw almond<br />
B Air roast Air roast<br />
1-heavy 5-heavy Dark <strong>chocolate</strong> Milk <strong>chocolate</strong><br />
2-medium 6-medium Dark <strong>chocolate</strong> Milk <strong>chocolate</strong><br />
3-light 7-light Dark <strong>chocolate</strong> Milk <strong>chocolate</strong><br />
4-no sample<br />
8- Raw almond<br />
MRI Measurements<br />
Magnetic resonance imaging (MRI) measurements were performed using the 1T Aspect AI<br />
magnet/spectrometer, equipped with a solenoid coil with 44 MHz for 1 H-resonance frequency. A multi-slice<br />
spin echo pulse (MSSE) sequence provided 8 images (slices) with a 6.9 ms echo time and a 1000 ms<br />
repetition time. Each image was 128x128 pixels and represented signal averaged over a slice thickness of 5<br />
mm. The field of view was 68 mm. Two scans were acquired for each measurement. The acquisition time<br />
was approximately 256 s. Of the eight images (slices) acquired in the MR imaging pro<strong>to</strong>col, slice numbers 3<br />
and 7 were analyzed for oil <strong>migration</strong>. These images were chosen due <strong>to</strong> their central positioning over the<br />
<strong>almonds</strong>.
5<br />
6<br />
7<br />
8<br />
1<br />
2<br />
3<br />
Figure 1. A tray is illustrated in the holder prior <strong>to</strong> be inserted in<strong>to</strong> the MR magnet.<br />
Compartments 1, 2, 3, 5, 6, 7, and 8 are referred <strong>to</strong> as “samples”.<br />
x 10 5<br />
4.5<br />
20<br />
4<br />
3.5<br />
40<br />
60<br />
80<br />
100<br />
120<br />
3<br />
2.5<br />
2<br />
1.5<br />
1<br />
0.5<br />
20 40 60 80 100 120<br />
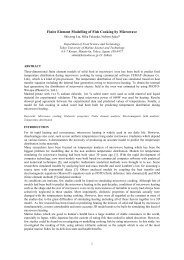
Figure 2. Representative image of air roasted <strong>almonds</strong> embedded in milk <strong>chocolate</strong> (Day 301).<br />
The image includes Compartments 5, 6, 7 and 8.<br />
RESULTS & DISCUSSION<br />
Figure 2 illustrates a representative MR image of air roasted <strong>almonds</strong> in milk <strong>chocolate</strong> taken at slice 7<br />
(Batch B). MR signal intensity (SI) reflects the hydrogen content of the sample region. With both <strong>almonds</strong><br />
and <strong>chocolate</strong>, the hydrogen signal is due <strong>to</strong> the water and liquid oil content of a voxel (volume element).<br />
Due <strong>to</strong> the low moisture nature of both <strong>chocolate</strong> (especially) and <strong>almonds</strong>, the signal is due primarily <strong>to</strong> the<br />
liquid oil content. There are a number of general observations in this study consistent with oil and/or<br />
moisture content, as given in Table 1:<br />
1. SI(almond) > SI(<strong>chocolate</strong>) due <strong>to</strong> the greater amount of liquid fat per unit volume,<br />
2. SI (<strong>chocolate</strong> at 30ºC) > SI (<strong>chocolate</strong> at 25ºC) > SI (<strong>chocolate</strong> at 20ºC) due <strong>to</strong> the<br />
temperature dependence of the solid <strong>to</strong> liquid fat ratio in <strong>chocolate</strong>,<br />
3. SI (milk <strong>chocolate</strong>) > SI (dark <strong>chocolate</strong>) due <strong>to</strong> the higher liquid fat content of milk<br />
<strong>chocolate</strong> compared <strong>to</strong> dark <strong>chocolate</strong>,<br />
4. SI (oil roasted <strong>almonds</strong>) > SI (air roasted <strong>almonds</strong>) due <strong>to</strong> the higher moisture and fat<br />
content of the oil roasted <strong>almonds</strong> compared <strong>to</strong> the air roasted <strong>almonds</strong>, and<br />
5. SI (raw <strong>almonds</strong>) > SI (air roasted <strong>almonds</strong>) due <strong>to</strong> the higher moisture content.
For data analysis, the signal intensity data at the initial time (Day 1) were used <strong>to</strong> identify three different<br />
regions of each sample. The three regions were designated as: almond, boundary, and <strong>surrounding</strong> medium<br />
(dark or milk <strong>chocolate</strong>). In this masking process, the almond region was entirely almond, the <strong>chocolate</strong><br />
region was entirely <strong>surrounding</strong> medium. The boundary region was primarily <strong>surrounding</strong> medium, but could<br />
be influenced by signal intensity <strong>from</strong> the almond due <strong>to</strong> partial volume averaging. This masking procedure<br />
was successfully used throughout the experimental time frame because the sample tray could be precisely<br />
positioned within the magnet using the sample tray holder shown in Fig. 1.<br />
Day-<strong>to</strong>-day signal variations of the spectrometer were addressed by summing signal intensity <strong>from</strong> the three<br />
regions (almond, boundary, and <strong>surrounding</strong> medium) <strong>to</strong> 1.0. <strong>Oil</strong> <strong>migration</strong> could then be detected over time<br />
using changes in the relative fraction of signal <strong>from</strong> each of the three regions. In other words, the fraction of<br />
signal intensity <strong>from</strong> the almond region in a single sample was:<br />
<br />
SI<br />
almond<br />
<br />
<br />
SI<br />
<br />
SI<br />
boundary<br />
almond<br />
<br />
<br />
SI<br />
<strong>surrounding</strong> medium<br />
The fractions of the signal intensity <strong>from</strong> the boundary region and the <strong>surrounding</strong> medium region were<br />
calculated in a similar fashion. The disadvantage of this approach was that if there were phase changes (e.g.,<br />
solid fat liquefies), the changes would not be observed by a net increase or decrease in signal intensity over<br />
time. However, based on previous experience with Guittard <strong>chocolate</strong> at similar temperatures reported in [1],<br />
phase changes were not expected in the <strong>chocolate</strong>.<br />
The statistics calculated for each region were mean signal intensity <strong>from</strong> that region and the coefficient of<br />
variation over time, calculated as the ratio of the standard deviation (stdev) <strong>to</strong> the mean of the signal<br />
intensity,<br />
stdev<br />
COV <br />
(2)<br />
SI <br />
Figure 3 illustrates the fraction signal intensity over time for Batch A at T=30ºC for the almond and<br />
<strong>chocolate</strong> regions. Each vertical dotted line represents a data acquisition day. Sample 8 in the <strong>to</strong>p figure is<br />
the signal intensity <strong>from</strong> the raw almond, which was considered time invariant and gives the expected noise<br />
in the other samples. At Day 270, the spectrometer was upgraded and data were more consistent after the<br />
upgrade. However, no trend in oil <strong>migration</strong> is evident for either the almond region or the <strong>chocolate</strong> region<br />
for Samples 1-3 (air roasted) or Samples 5-7 (cocoa butter roasted) (Samples 1 and 5 are not shown in the<br />
Fig. 5). No significant changes in SI were observed in the trays s<strong>to</strong>red at 20 or 25ºC either.<br />
The statistics for Batch A samples s<strong>to</strong>red at T=30ºC are given in Table 3. Although statistics were calculated<br />
for all s<strong>to</strong>rage temperatures, the focus of the discussion will be on samples s<strong>to</strong>red at T=30ºC since the<br />
greatest changes were expected at the higher s<strong>to</strong>rage temperature. To illustrate the normalization procedure,<br />
the first row of Table 3 gives the fraction of signal intensity in Almond, Boundary and Chocolate as 0.69,<br />
0.08, and 0.22 respectively. These fractions sum <strong>to</strong> 0.99; they are short of 1.00 due <strong>to</strong> round off error.<br />
Consider the next row, 0.74+0.08+0.18=1.00. Two cells and 2 columns are highlighted. The 2 cells are<br />
fraction of signal due <strong>to</strong> almond in Sample 8 (raw almond): 0.96 and 0.94. These values are typical of the<br />
signal intensity obtained with the mask for the almond region. The samples in Batch A have coefficient of<br />
variation for the almond region between 0.01 – 0.04. This small value indicates signal intensity in the<br />
almond region was not changing over time. The <strong>chocolate</strong> column is highlighted <strong>to</strong> illustrate the relative<br />
contribution of that region at around 20% <strong>to</strong> the <strong>to</strong>tal signal intensity. Although the COV is higher (at around<br />
0.10), there was no evidence of almond oil migrating in<strong>to</strong> the <strong>chocolate</strong> region.<br />
Figure 4 summarizes the results for Batch B at T=30ºC. Batch B was developed <strong>to</strong> provide information<br />
regarding oil <strong>migration</strong> in milk <strong>chocolate</strong> versus dark <strong>chocolate</strong>. Sample 8 (<strong>to</strong>p figure, <strong>to</strong>p curve) again gives<br />
the expected noise in the other samples. No trends were evident in either the almond region or the <strong>chocolate</strong><br />
region, although there is greater contribution of signal intensity of the milk <strong>chocolate</strong> region (Samples 5-7)<br />
compared <strong>to</strong> dark <strong>chocolate</strong> region (Samples 1-3) in the <strong>chocolate</strong> region due <strong>to</strong> the higher liquid fat content.<br />
(1)
The statistics for Batch B samples s<strong>to</strong>red at T=30ºC are given in Table 4. Again, two cells and 2 columns are<br />
highlighted. The 2 cells are fraction of signal due <strong>to</strong> almond in Sample 8 (raw almond): 0.95 and 0.93, which<br />
was indicative of a successful masking procedure. The samples in Batch B have coefficient of variation for<br />
the almond region between 0.01 – 0.04. This small value indicates signal intensity in the almond region was<br />
not changing over time. The <strong>chocolate</strong> column in Table 4 is highlighted <strong>to</strong> illustrate the greater contribution<br />
of signal intensity of the milk <strong>chocolate</strong> region (Samples 5-7, dark shading) compared <strong>to</strong> dark <strong>chocolate</strong><br />
region (Samples 1-3, light shading).<br />
1<br />
Almond region Intensity<br />
0.95<br />
0.9<br />
0.85<br />
0.8<br />
0.75<br />
0.7<br />
0.65<br />
2345678910 11 12 1314 15 1617 18 192 2528313437 46 47 53 60 7074 81 88 98102 109 123 142 158 172 186 200 214 228 242 256 270 284 298 327 353 387 428<br />
0.4<br />
0.35<br />
Chocolate region intensity<br />
2<br />
3<br />
6<br />
7<br />
8<br />
0.3<br />
0.25<br />
0.2<br />
0.15<br />
0.1<br />
0.05<br />
0<br />
2345678910 11 12 1314 15 1617 18 192 2528313437 46 47 53 60 7074 81 88 98102 109 123 142 158 172 186 200 214 228 242 256 270 284 298 327 353 387 428<br />
Figure 3. Signal intensity over 428 days for the almond region and the <strong>chocolate</strong> region for Batch A, s<strong>to</strong>rage temperature<br />
of 30ºC, replication 1. Each vertical dotted line represents a data acquisition day. Sample 8 in the <strong>to</strong>p figure (<strong>to</strong>p curve)<br />
is the signal intensity <strong>from</strong> the raw almond, which was considered time invariant.<br />
Table 3. Statistics for Batch A: mean signal intensity and coefficient of variation.<br />
Temp Rep Sample Almond COV_almond Boundary COV_boundary Chocolate COV_<strong>chocolate</strong><br />
30 1 1 0.69 0.04 0.08 0.10 0.22 0.10<br />
30 1 2 0.74 0.03 0.08 0.09 0.18 0.10<br />
30 1 3 0.74 0.04 0.08 0.09 0.18 0.12<br />
30 1 5 0.68 0.04 0.10 0.08 0.23 0.10<br />
30 1 6 0.76 0.03 0.08 0.07 0.16 0.10<br />
30 1 7 0.74 0.03 0.08 0.09 0.18 0.11<br />
30 1 8 0.96 0.01 0.04 0.18<br />
30 2 1 0.70 0.03 0.09 0.08 0.21 0.09<br />
30 2 2 0.77 0.03 0.07 0.07 0.16 0.10<br />
30 2 3 0.73 0.03 0.08 0.07 0.19 0.10<br />
30 2 5 0.67 0.04 0.09 0.06 0.24 0.10<br />
30 2 6 0.72 0.03 0.08 0.07 0.20 0.10<br />
30 2 7 0.73 0.03 0.09 0.07 0.19 0.10<br />
30 2 8 0.94 0.01 0.06 0.14
1<br />
Almond region Intensity<br />
0.95<br />
0.9<br />
0.85<br />
0.8<br />
0.75<br />
0.7<br />
0.65<br />
12345678910 11 12 13 20 27 34 4448 55 62 7276 83 97 11 116 132 147 160 174 188 202 217 231 245 259 273 301 328 362 404<br />
0.4<br />
0.35<br />
Chocolate region intensity<br />
2<br />
3<br />
6<br />
7<br />
8<br />
0.3<br />
0.25<br />
0.2<br />
0.15<br />
0.1<br />
0.05<br />
0<br />
12345678910 11 12 13 20 27 34 4448 55 62 7276 83 97 11 116 132 147 160 174 188 202 217 231 245 259 273 301 328 362 404<br />
Figure 4. Signal intensity over 404 days for the almond region and the <strong>chocolate</strong> region for Batch B, s<strong>to</strong>rage temperature<br />
of 30ºC, replication 1. Each vertical dotted line represents a data acquisition day. Sample 8 in the <strong>to</strong>p figure (<strong>to</strong>p curve) is<br />
the signal intensity <strong>from</strong> the raw almond, which was considered time invariant.<br />
Table 4. Statistics for Batch B: mean signal intensity and coefficient of variation.<br />
Temp Rep Sample Almond COV_almond Boundary COV_boundary Chocolate COV_<strong>chocolate</strong><br />
30 1 1 0.70 0.03 0.09 0.06 0.21 0.08<br />
30 1 2 0.76 0.02 0.08 0.05 0.17 0.07<br />
30 1 3 0.75 0.02 0.07 0.06 0.18 0.06<br />
30 1 5 0.63 0.03 0.11 0.05 0.27 0.07<br />
30 1 6 0.64 0.02 0.10 0.04 0.27 0.04<br />
30 1 7 0.65 0.02 0.11 0.04 0.24 0.05<br />
30 1 8 0.95 0.01 0.05 0.18<br />
30 2 1 0.71 0.02 0.08 0.08 0.21 0.08<br />
30 2 2 0.76 0.02 0.07 0.05 0.16 0.08<br />
30 2 3 0.73 0.03 0.08 0.09 0.19 0.09<br />
30 2 5 0.56 0.04 0.12 0.04 0.32 0.06<br />
30 2 6 0.62 0.02 0.11 0.04 0.27 0.04<br />
30 2 7 0.68 0.02 0.11 0.04 0.22 0.05<br />
30 2 8 0.93 0.02 0.07 0.26<br />
CONCLUSION<br />
Sample trays were prepared <strong>to</strong> evaluate oil <strong>migration</strong> <strong>from</strong> <strong>almonds</strong> <strong>to</strong> two types of <strong>chocolate</strong>: dark <strong>chocolate</strong><br />
and milk <strong>chocolate</strong>. Different roast conditions and levels were incorporated in<strong>to</strong> the experimental design.<br />
Samples were held at different, but constant, s<strong>to</strong>rage temperatures. No oil <strong>migration</strong> was detected <strong>from</strong> <strong>whole</strong><br />
almond <strong>to</strong> its <strong>surrounding</strong> (or vice versa) by magnetic resonance imaging in any of the sample trays over a<br />
time frame of 14 months. This assessment was based on the mean signal intensity and COV in each of the<br />
three designated regions: almond, boundary, and <strong>surrounding</strong> medium.<br />
REFERENCES<br />
[1] Lee W.L., McCarthy M.J. & McCarthy K.L. 2010. <strong>Oil</strong> <strong>migration</strong> in 2-component confectionery systems. Journal of<br />
Food Science, 75(1), E83-E89.