bv0018
bv0018
bv0018

You also want an ePaper? Increase the reach of your titles
YUMPU automatically turns print PDFs into web optimized ePapers that Google loves.
ISSN 007-2621<br />
No. 2- 1985<br />
published quarterly<br />
To Advance Techniques in Acoustical, Electrical and Mechanical Measurement<br />
~ Bruel & Kjcer
PREVIOUSLY ISSUED NUMBERS OF<br />
BRUEL & KJJER TECHNICAL REVIEW<br />
1-1985 Local Thermal Discomfort<br />
4-1984 Methods for the Calculation of Contrast<br />
Proper Use of Weighting Functions for Impact Testing<br />
Computer Data Acquisition from B & K Digital Frequency Analyzers<br />
2131 I 2134 using their Memory as a Buffer<br />
3-1984 The Hilbert Transform<br />
Microphone System for Extremely Low Sound Levels<br />
Averaging Times of Level Recorder 2317<br />
2-1984 Dual Channel FFT Analysis (Part 11)<br />
1-1984 Dual Channel FFT Analysis (Part I)<br />
4-1983 Sound Level Meters- The Atlantic Divide<br />
Design principles for Integrating Sound Level Meters<br />
3-1983 Fourier Analysis of Surface Roughness<br />
2-1983 System Analysis and Time Delay Spectrometry (Part 11)<br />
1-1983 System Analysis and Time Delay Spectrometry (Part I)<br />
4-1982 Sound Intensity (Part 11 Instrumentation and Applications)<br />
Flutter Compensation of Tape Recorded Signals for Narrow Band<br />
Analysis<br />
3-1982 Sound Intensity (Part I Theory).<br />
2-1982 Thermal Comfort.<br />
1-1982 Human Body Vibration Exposure and its Measurement.<br />
4-1981 Low Frequency Calibration of Acoustical Measurement Systems.<br />
Calibration and Standards. Vibration and Shock Measurements.<br />
3-1981 Cepstrum Analysis.<br />
2-1981 Acoustic Emission Source Location in Theory and in Practice.<br />
1-1981 The Fundamentals of Industrial Balancing Machines and their<br />
Applications.<br />
4-1980 Selection and Use of Microphones for Engine and Aircraft Noise<br />
Measurements.<br />
3-1980 Power Based Measurements of Sound Insulation.<br />
Acoustical Measurement of Auditory Tube Opening.<br />
2-1980 Zoom-FFT.<br />
1-1980 Luminance Contrast Measurement.<br />
4-1979 Prepolarized Condenser Microphones for Measurement<br />
Purposes.<br />
Impulse Analysis using a Real-Time Digital Filter Analyzer.<br />
3-1979 The Rationale of Dynamic Balancing by Vibration Measurements.<br />
Interfacing Level Recorder Type 2306 to a Digital Computer.<br />
2-1979 Acoustic Emission.<br />
1-1979 The Discrete Fourier Transform and FFT Analyzers.<br />
(Continued on cover page 3)
TECHNICAL REVIEW<br />
No. 2- 1985
Contents<br />
Heat Stress<br />
by Bjarne W. Olesen ................................................................................ 3<br />
A New Thermal Anemometer Probe for Indoor Air Velocity·<br />
Measurements<br />
by Finn Johannessen ................................................................................ 38
HEAT STRESS<br />
by<br />
Bjarne W. 0/esen, (Ph.D.)<br />
ABSTRACT<br />
Heat stress is a major problem in several working environments. Although<br />
technology has brought about remote control of industrial processes from airconditioned<br />
cabins, there are still many people who have to work in hot environments.<br />
Several methods for evaluation of heat stress have been presented In the<br />
literature.<br />
This article describes the method of evaluation of heat stress by means of the<br />
WBGT -index, which has been standardized recently in the International Standard<br />
ISO 7243. Physiological reactions in hot environments are shortly described.<br />
Through the years several heat stress indices (both empirical and analytical) have<br />
been developed and used. The most common are also presented here.<br />
SOMMAIRE<br />
La contrainte thermique est un probleme important sur de nombreux postes de<br />
travail. Bien que grace aux progres technologiques on puisse utiliser la commande<br />
a distance des precedes industrials a partir de cabines a air conditionne, il y a<br />
toujours beaucoup de gens qui doivent travailler dans des environnements tres<br />
chauds. On trouve dans la litterature plusieurs methodes d'evaluatlon de la<br />
contrainte thermique.<br />
Cet article decrit la methode d'evaluation de la contrainte thermique fondee sur<br />
l'indice WBGT qui a ete standardise recemment dans la Norme internationale ISO<br />
7243. Les reactions physiologiques aux environnements tres chauds sont decrites<br />
brievement. Au cours des annees passees, plusieurs indices de contrainte thermique<br />
(empiriques comme analytiques) ont ete elabores et utilises. Les plus eaurants<br />
sont passes en revue ici.<br />
ZUSAMMENFASSUNG<br />
An verschiedenen Arbeitspliitzen spielt Hitzestref> eine wesentliche Rolle. Zwar<br />
ermOglichen neue Technologien in zunehmenden Maf>e industrielle Prozesse von<br />
klimatisierten Kabinen aus fernzusteuern - viele Tiitigkeiten mOssen jedoch<br />
unter extremen thermischen Bedingungen durchgefOhrt werden. In der Literatur<br />
werden verschiedene Methoden zur Beurteilung von Hitzestref> behandelt.<br />
Dieser Artikel beschreibt, wie Hitzestref> an hand des WBGT -Index beurteilt warden<br />
kann. Diese Methode wurde kOrzlich in ISO 7243 international festgelegt. Die<br />
physiologischen Reaktionen unter extremer Hitzeeinwirkung werden kurz beschrieben.<br />
Die gebriiuchlichsten der in den letzten Jahren ausgearbeiteten und<br />
benutzten Hitzestref>-lndizes (sowohl empirische als auch analytische) werden<br />
vorgestellt.<br />
3
Introduction<br />
For several years "heat stress" has been a common subject in literature<br />
dealing with the thermal environment. There are many books, technical<br />
papers and recommendations that deal with the problem of heat stress,<br />
how the human body reacts to it, how it should be evaluated and what limitations<br />
apply, [1 ,2,3,4].<br />
Heat stress may occur in environments with high air temperatures<br />
(summer-time), high thermal radiation (foundries, steel mills, glass and<br />
ceramic factories, brick factories, cement plants, coke ovens etc.) high<br />
levels of humidity (mines, laundries) or at workplaces where a high<br />
activity level (increasing metabolic rate) or protective clothing are needed.<br />
Also outdoor work like construction, agriculture, sport activities<br />
and others in hot climates may result in heat stress.<br />
Whenever heat stress from the thermal environment is imposed on the<br />
human body, there will be a resulting strain in the body. This may result<br />
in physiological reactions such as increased skin temperature, sweat<br />
production, increased heart rate and higher core temperature. Under<br />
severe conditions the strain may attain such a magnitude as to cause<br />
health impairment.<br />
The purpose of this present article is to give a short description of the<br />
physiological reactions and health risks, that may occur by working in<br />
hot environments.<br />
The heat stress imposed on the human body by a certain environment is<br />
often evaluated by a "heat stress index", which by a single value<br />
combines the influence of one or more of the environmental factors as<br />
air temperature, mean radiant temperature, air velocity, humidity, activity<br />
and clothing. Several heat stress indices have been proposed in<br />
literature. In this article the most common indices will be described<br />
shortly.<br />
Finally a detailed presentation of the WBGT-index (Wet Bulb Globe<br />
Temperature) and how it is used is given. This heat stress index is the<br />
most widely used and has been internationally standardized in ISO 7243<br />
(5).<br />
Physiological reactions in hot environments<br />
Man's thermoregulation<br />
As in moderate thermal environments the thermoregulatory system of<br />
the human body tries to keep a heat balance, i.e. the heat produced by<br />
4
the activity should be equal to the amount of heat gain/loss due to<br />
convection, radiation and evaporation. The heat balance equation is<br />
written as:<br />
S =M- W-R-C-E-C, 85 -Ere 5 -K<br />
where<br />
S<br />
M<br />
w<br />
R<br />
c<br />
E<br />
Cres<br />
Eres<br />
K<br />
= heat storage rate Wlrrt<br />
= metabolic rate Wlrrt<br />
=external work Wlrrf<br />
= heat loss by radiation Wlrrt<br />
= heat loss by convection Wl rrt<br />
= heat loss by evaporation Wlrrf<br />
= dry heat loss by respiration Wlrrt<br />
= latent heat loss by respiration Wlrrf<br />
= heat loss by conduction Wlrrt<br />
Heat Is lost by conduction (K) from parts of the body which are in<br />
contact with surrounding surfaces or tools (hands, feet). This heat loss<br />
has no significant influence on total heat exchange of the body as a<br />
whole and is therefore generally neglected in the heat balance equation.<br />
lt may, however, have a significant Influence on local heat discomfort or<br />
cause burns. The heat exchanges by respiration (C, 85 , E, 85 ) are also<br />
negligible in hot environments and the external work ( W) may in most<br />
situations also be set to zero, to be on the safe side.<br />
If the heat content of the body has to remain constant, i.e. heat storage<br />
(S) is equal to zero, then the combined heat loss by convection (C),<br />
radiation (R) and evaporation must be equal to the metabolic heat<br />
production (M-W). In hot environments it is often a question of heat gain<br />
by radiation and possibly also convection, because the mean radiant<br />
temperature and also the air temperature are often higher than the body<br />
temperature.<br />
The environmental heat load may then be caused by a situation, where<br />
the evaporative heat loss is not sufficient to compensate for the heat<br />
gain from radiation and from convection. The heat load on the body may<br />
also be caused by a high metabolic heat production. Activity or muscle<br />
work results in an energy production. Because the mechanical work<br />
efficiency of the human body (W/M) can vary between 0 and 25%<br />
depending, on the type of work at least 75% of the energy is transformed<br />
to heat. Well-trained atheletes may during 5-10 min intensive activity<br />
reach a heat production around 2000 W (6) and during a longer activity<br />
around 1500W. Theoretically the produced heat during one work period<br />
5
at this level may increase the body temperature of a 70 kg person from<br />
37°C to 60°C if no heat is exchanged with the environment.<br />
The aim of the temperature regulation is to control the body temperature<br />
and then the heat balance. The regulation tries to keep the temperature<br />
constant at - 37°C in certain organs like the brain, the heart and<br />
intestinal canal. The centre for the temperature regulation is in the<br />
hypothalamus in the brain. Its function is similar to a thermostat and its<br />
set point can be changed by different physiological conditions. Temperature<br />
sensors located mainly in the skin influence the set point of the<br />
thermostat.<br />
When a person is exposed to hot environments or is engaged in<br />
increased activity the blood vessels will dilate (vasodilation). The blood<br />
flow will increase in the peripheral blood vessels and the heat will be<br />
conducted from the body core to the skin. This will facilitate the transport<br />
of metabolic heat to the skin surface. Skin temperature will increase<br />
especially on the extremities (arms, hands, legs, feet). If the environmental<br />
temperatures (air temperature, mean radiant temperature) are lower<br />
th~n skin temperature the heat loss due to radiation and convection will<br />
increase or else the heat gain by convection and/or radiation will<br />
decrease. If the heat load is high enough the sweat glands will be<br />
activated and the evaporation of sweat will cool the skin. 1 g of water<br />
(sweat) which evaporates removes 2,47 kJ. A person may have about<br />
2000 sweat glands in the skin, but the activation of sweat glands on<br />
different skin areas is not the same for different individuals. The individual<br />
variation is great. Some individuals have no sweat glands at all.<br />
When a human body starts sweating, sweat is not produced evenly over<br />
the whole skin surface. Sweating starts locally and then spreads gradually<br />
over a greater surface area. At a certain stage, often before the whole<br />
surface is covered with sweat, some sweat will drip off. This sweat does<br />
not help to cool the body, because it does not evaporate at the skin<br />
surface. Instead it increases the strain on the body system. The increased<br />
skin temperature and sweating will result in an increase of the heart<br />
rate.<br />
When the evaporation of sweat is not enough to keep the body in heat<br />
balance, the internal body temperature increases. A new heat balance<br />
may be established at a higher body temperature or the internal temperature<br />
may increase even further in an uncontrolled manner that may<br />
result in heat casualties and eventually even death.<br />
6
The strain in the body can thus be expressed in terms of increase in skin<br />
temperature, deep body temperature, heart rate and sweat loss. There<br />
are of course limitations to the level of strain which the body can<br />
tolerate. Most of these limitations are shown in Table 1, which are the<br />
values suggested in an International Draft Standard, ISO/DIS 7933(7).<br />
The limits are shown for two levels of strain: Warning and danger. On the<br />
warning level the work may proceed provided extra precautions are<br />
taken, because some persons may have problems. On the danger level<br />
the work should be stopped and a new work/rest routine should be<br />
established. Besides the limits are dependent on whether or not the<br />
person is acclimatized (see later).<br />
From the table it is seen that a person can sweat more when he is active<br />
than when he is resting. The skin wettedness is the skin surface area<br />
which is covered with sweat as percentage of the total body surface<br />
area. The pain threshold for the skin temperature is approximately 45°C.<br />
Acclimatization to heat<br />
Heat acclimatization is the physiological adjustments that can occur<br />
when a person not accustomed to hot environments is exposed to heat<br />
for a period of time. After a few days exposure to a hot environment a<br />
person is more capable of tolerating the conditions than at the beginning<br />
Rectal<br />
temp. Pulse Sweat rate<br />
min- 1<br />
' C<br />
kg/h<br />
1,4<br />
39,0 170<br />
38,5 150<br />
1,3<br />
38,0 130<br />
0 2 4 6 8 days<br />
Fig. 1. Effect of heat acclimatization<br />
7
of the period. This improvement in heat tolerance Is due to an increased<br />
ability of sweating, a lowered skin- and body temperature and a lower<br />
heart rate, (Fig.1 ). In addition, sweating starts already at a lower core<br />
and skin temperature and the content of salt in the sweat is reduced.<br />
Most of the changes take place during 4-7 days of exposure to heat and<br />
after 12-14 days the acclimatization is complete. A person In good<br />
condition and well-trained can better tolerate heat than a person in bad<br />
condition, but training cannot substitute acclimatization completely.<br />
The effect of acclimatization may last several weeks after a period of<br />
exposure to heat. A certain decrease in heat tolerance can be seen after<br />
a couple of days after the heat exposure. This may happen after a long<br />
weekend, so it is always recommended not to work under most severe<br />
conditions on a monday. This is especially important if the person is<br />
tired and has consumed alcohol.<br />
Assessment of heat strain by physiological measurements<br />
By measuring physiological parameters as heat rate, skin temperature,<br />
deep body temperature and sweat loss it is possible to evaluate the heat<br />
stress and the strain lt imposes on the body. This way of measuring may<br />
also take individual differences into account.<br />
Heart rate<br />
Heart rate can be measured relatively easily. Counting the radial pulse at<br />
the wrist manually or over the carotid artery at the neck is the simplest<br />
procedure. Heart rate may also be recorded electrocardiographically by<br />
electrodes on the chest and the use of a portable tape recorder or other<br />
recording device or by telemetry.<br />
lt is important to note that the heart rate is influenced both by an<br />
increased metabolic rate and increased heat load. A method for separating<br />
metabolic and heat load heart rate has been suggested by Vogt [8].<br />
Skin temperature<br />
Skin temperature may be measured by temperature sensors taped to the<br />
skin and electronically recorded. As the skin temperature distribution in<br />
hot environments normally is very uniform, four measuring points should<br />
be sufficient to estimate the mean skin temperature (Oiesen, [9], Ramanathan,<br />
[1 0)).<br />
Deep body temperature<br />
Deep body temperature is in laboratory studies normally measured by a<br />
rectal temperature probe or by an esophageal probe. These methods<br />
8
are, however, not very feasible to use In the field. Also the measurement<br />
of ear- (tympanic) and armpit temperature may be difficult to perform.<br />
The most widely used method, which Is found acceptable by most<br />
industrial workers is the measurement of oral temperature.<br />
Precautions such as temperature probe under tongue for five minutes,<br />
breathing through the nose, no drinking or eating prior to measurement<br />
are necessary to get a representative measurement. The deep body<br />
temperature may then be estimated from the oral temperature by adding<br />
0,4°C to it.<br />
Sweating and dehydration<br />
Sweating and dehydration can be measured by monitoring the body<br />
weight loss and making corrections for fluid intake and output.<br />
Heat disorders<br />
Heat disorders may be due to heat stroke, heat collapse, heat exhaustion<br />
(dehydration, salt depletion), heat cramps and diseases of sweat<br />
glands.<br />
Heat stroke<br />
Heat stroke may occur when the thermoregulatory system cannot cope<br />
with the heat stress level and the deep body temperature rises continually,<br />
brain function Is impaired and the mechanisms for dissipation of heat<br />
may not function. Symptoms are collapse, convulsions, delirium hallucinations<br />
and coma which sometimes occur without previous warning.<br />
External signs of heat stroke are hot, flushed and dry skin. Core<br />
temperature rises to or above 40,5°C. When the persons suffer convulsions<br />
or coma, core temperature is usually between 42°C and 45°C.<br />
Heat stroke is very often fatal and in cases of survival there Is frequently<br />
damage to the brain, kidney or other organs.<br />
Heat collapse<br />
Heat collapse results from excessive strain on the circulatory system.<br />
The symptoms are dizziness, pallor, sweaty skin and headache. The<br />
increased blood flow at the skin level and working muscles in hot<br />
environments may lead to some degree of oxygen deficiency. This will<br />
especially influence the brain and heart. Dehydration will Increase the<br />
risk for a heat collapse. Deep body temperature is usually normal.<br />
Heat exhaustion from dehydration<br />
Heat exhaustion from dehydration will occur if the water lost by sweating<br />
is not replaced through the Intake of liquids, the water content of the<br />
9
ody will decrease. Usually workers engaged In hot jobs drink less<br />
during the workday and go home somewhat dehydrated. However, they<br />
usually replace their fluid deficit during the rest of the day, so that next<br />
morning they return to work with a restored fluid content in their bodies.<br />
If the dehydration does not exceed 1,5% of their total body weight during<br />
the day, this drinking pattern is harmless. A fluid loss in excess of 1,5%<br />
of the body weight will result in decrease of heat tolerance as exhibited<br />
in higher heart rates and body temperatures. Unfortunately, man does<br />
not have the ability to recognize a slight dehydration in his body nor can<br />
he notice the loss of fitness. Particularly in dry climates, as for instance,<br />
in the desert, where the sweat is Immediately evaporated from the skin,<br />
man may not even be aware of the fact that he is sweating heavily.<br />
Under these conditions, dehydration may reach a level where not only<br />
physical fitness and heat tolerance are decreased but mental capacity as<br />
well, causing misjudgement of dangers, erroneous decisions, loss of skill<br />
and Increased reaction time. In such a state worker may be prone to<br />
accidents and may be more susceptible to some lntoxications.<br />
Heat exhaustion due to salt depletion<br />
Heat exhaustion due to salt depletion occurs if salt intake is inadequate<br />
to replace losses of sodium chloride caused by sweating. lt Is mostly<br />
seen In lnacclimatized men who drink a lot of water without giving<br />
thoughts to salt replacement.<br />
Heat cramps<br />
Heat cramps are sharp pains in muscles in which there has been a great<br />
physical activity. Heat cramp occurs in unaccllmatized workers who are<br />
sweating heavily and are at the same time drinking large amounts of<br />
unsalted water.<br />
Dehydration, heat cramps and salt depletion may be prevented by<br />
drinking water and other fluids regularly during work. Thurst is, however,<br />
not a good Indicator of the amount of fluid which is necessary. Normally<br />
a person must drink much more to avoid dehydration. Additional salt<br />
intake Is normally not necessary since the dally salt intake through food<br />
will In most cases exceed the salt loss by sweating-.<br />
Diseases of the sweat glands<br />
Diseases of the sweat glands may occur after prolonged exposure<br />
(months) to heat In an environment, where sweat cannot evaporate freely<br />
(humid environment). Sweat glands over certain areas of the skin may<br />
stop producing sweat. This will decrease sweating and the person will<br />
then become less tolerant to heat. This is often connected with a skin<br />
rash called prickly heat.<br />
10
lt is very important to be aware of the great individual differences in the<br />
tolerance to heat. Also factors such as age, sex, ethnic characteristics,<br />
body build, nutrition, general health conditions, habits like smoking and<br />
alcohol, acclimatization etc. are significant for man's response to heat.<br />
Heat stress indices<br />
The most efficient and accurate method of evaluating whether an environment<br />
is too hot and risky Is to take direct measurements of internal<br />
body temperature, pulse rate and possibly sweat rate of the exposed<br />
Individuals and compare these with the recommended guidelines In<br />
Table 1. This is of course very difficult and in most cases is not<br />
acceptable to those involved. Consequently, there has long been an<br />
interest in determining a combination of the environmental parameters<br />
(air temperature, mean radiant temperature, air velocity, humidity), activity<br />
level and clothing level, which can express the level of heat stress,<br />
I.e. be related to the physiological reactions of the human body.<br />
Not-acclimatized<br />
Acclimatized<br />
Warning Danger Warning Danger<br />
Maximum Resting W/rrf 100 150 200 300<br />
Sweat- (g/h) (260) (390) (520) (780)<br />
rate SWmax<br />
Arbejde Wlrrf 200 250 300 400<br />
(g/h) (520) (650) (780) (1040)<br />
Skin<br />
humidity<br />
Wmax 0,85 1,00<br />
Dehy- Dmax Whlrrf 1000 1250 1500 2000<br />
dration (g) (2600) (3250) (3900) (5200)<br />
Heat<br />
Storage<br />
Omax Whlrrt 50 60 50 60<br />
Cor respondlng<br />
t.t,., oc 0,8 1 0,8 1<br />
change of<br />
Rectal- iltsk oc 2,4 3 2,4 3<br />
and Skin<br />
temperatu<br />
re<br />
Estimation of s;-veat In g/h or g are based on a mean person with 1.8 m2 surface area<br />
Table 1. Recommended physiological/imitations<br />
T00752GBO<br />
11
Between 30 and 40 different suggestions for a heat stress Index exist in<br />
the literature. Every scientist, who has studied these problems, has more<br />
or less established his or her own heat stress index.<br />
The aim of a heat stress Index Is to combine the environmental variables<br />
into a single value, which quantitatively describes the stress that a<br />
thermal environment places on an individual. Stress is something which<br />
when applied to a system produces a strain. The simple mechanical<br />
analogy Is the strain in a spring produced by a force (stress).<br />
Comfort Indices aim to predict either thermal sensation or subjective<br />
discomfort. However, in hot environments where there Is danger of heat<br />
disorder, sensation is an Inadequate guide to physiological strain and it<br />
is necessary to employ an index which has been developed specifically<br />
for the task.<br />
The most elementary requirement of an index Is that different environmental<br />
conditions that produce the same strain in a person, should all<br />
have the same value of a heat stress index. For instance, two environments<br />
A and B, one with a high air temperature and low humidity, and<br />
the other having a low air temperature and high humidity, which both<br />
produce the same strain In a person, should have the same value of a<br />
heat stress index.<br />
Heat stress indices can be divided Into either analytical or empirical heat<br />
stress Indices.<br />
Analytical heat stress Index<br />
An analytical heat stress Index Is normally based on analysis of the<br />
human heat balance and heat exchange with the environment. This kind<br />
of Index always Includes the four environmental factors and normally<br />
also activity and clothing levels.<br />
Empirical heat stress Index<br />
An empirical heat stress Index Is normally based on a correlation<br />
between two or more of the thermal parameters and a human response.<br />
This relation Is estimated from tests with human beings.<br />
While an analytical Index may be used generally, an empirical Index Is<br />
often limited to those environments on which it has been based. Through<br />
experience and further research an empirical index may be shown to be<br />
valid for a broader range of environments. The most common and widely<br />
accepted heat stress Indices are described below.<br />
12
Empirical heat stress indices<br />
The "Effective Temperature" Index (ET)<br />
The Effective Temperature Index was developed between 1923 and 1925<br />
at the research laboratory of the American Society of Heating and Air<br />
Conditioning Engineers, by Houghten, Yaglou and Miller [11]. This Index<br />
takes account of air temperature, humidity and air velocity.<br />
The criterion for determining the effects of these parameters was the<br />
instantaneous thermal sensation experienced by the subjects upon entering<br />
a given environment. The unit, or basis, of the ET -index is the<br />
temperature of saturated "still" air with an average velocity of 0,12 m/s.<br />
Any combination of air temperature, humidity and air velocity having a<br />
given value of ET is supposed to produce the same thermal sensation;<br />
this is equal to that experienced in saturated still air at the same<br />
temperature as the value of the Index.<br />
in the experiments from which this index was developed, subjects<br />
walked to and fro between two rooms with different combinations of the<br />
environmental parameters mentioned. The conditions in one room were<br />
adjusted so that the subjects felt the same thermal sensation when<br />
passing from one room to the other.<br />
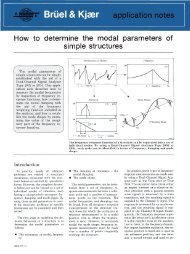
The Effective Temperature index Is in the form of two nomoQrams from<br />
which its value can be determined for any combination of dry and wet<br />
bulb temperatures and air velocity (Fig.2 and Fig.3). One nomogram is<br />
for semi-nude men and one for people clad in lightweight clothing.<br />
Corrected Effective Temperature (CET)<br />
Because the. ET-index does not consider thermal radiation effects, a<br />
correction has been suggested when radiant heat contributes to the heat<br />
load. The temperature as measured by a black globe thermometer is<br />
then used to calculate CET, using the ET charts, instead of the dry bulb<br />
temperature (Fig.2).<br />
Predicted Four Hours Sweat Rate (P4SR)<br />
The P4SR index was developed during World War 11 at the Royal Naval<br />
Research Establishment in England by McArdle and colleagues [12]. The<br />
P4SR is a heat stress index based on the concept that the sweat rate is<br />
an adequate index of the heat stress. Its value is nominally the amount of<br />
sweat secreted by fit, acclimatized young men exposed to the environment<br />
for four hours. The stress of the environment is therefore measured<br />
by the strain it produces. This is reasonable provided that the behaviour<br />
of the stressed system is reproducible. This was ensured in the original<br />
13
......<br />
Fig. 2. The "basic" Effective Temperature scale, i.e., for men stripped<br />
waist. This scale Is also used for Corrected Effective Temperature<br />
Index<br />
14
60<br />
55<br />
50<br />
45<br />
E<br />
e<br />
.a<br />
; E<br />
Q.<br />
E<br />
!l<br />
.c 1ii "<br />
:;<br />
.c<br />
~<br />
E<br />
~<br />
"0 30 !l<br />
.c<br />
0<br />
:;<br />
.c<br />
e<br />
;<br />
Q.<br />
E<br />
!l<br />
1l<br />
0<br />
c;<br />
e<br />
l;<br />
3:<br />
0<br />
i<br />
~ 0,1<br />
Fig. 3. The "normar Effective Temperature scale, appropriate for light<br />
clothing. This scale Is also used for Corrected Effective Temperature<br />
Index. To use the nomogram, draw a line connecting the dryand<br />
wet-bulb temperatures. The GET Is given by the Intersection<br />
of the line and the appropriate GET line<br />
15
experiments by working with a group of acclimatized subjects. lt cannot,<br />
therefore, be assumed that the P4SR will accurately predict the sweat<br />
rate of an individual, or of another population. The value of the P4SR Is<br />
therefore best regarded as an Index number, rather than an actual<br />
amount of sweat.<br />
6 5,0<br />
~4,0<br />
! 3,0<br />
8.<br />
E :2.0<br />
s<br />
.c 1,0<br />
~<br />
i .o,o 50 100 150 :200<br />
~ kcal/m'h<br />
100 t50 :200<br />
~ W/m 2<br />
Metabolic rate<br />
Air velocity (m/a)<br />
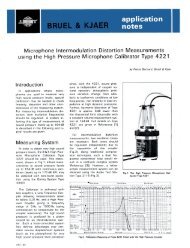
Fig. 4. Nomogram for calculating P4SR. The method of use is explained<br />
In the text<br />
16
The index combines the effects of air temperature, mean radiant temperature,<br />
air speed and humidity, together with metabolic rate and clothing<br />
Insulation. The index Is empirical and has no analytical formulation. lt<br />
may be found for a given set of conditions using the nomogram in Flg.4.<br />
Several steps are required to find the P4SR.<br />
1. If tg * ta, Increase the wet-bulb temperature by 0,4 ( tg - t 8 ) °C.<br />
where, tg = globe temperature t 8 = air temperature.<br />
2. If the metabolic rate M exceeds 63W/m 2 (sedentary activity), Increase<br />
the wet-bulb temperature by the amount indicated In the Inset<br />
chart (Fig.4).<br />
3. If the men are clothed, Increase the wet-bulb temperature by<br />
1,41c/o( °C).<br />
These modifications are additive.<br />
Now draw a line joining the globe temperature and the modified wet-bulb<br />
temperature, using the wet-bulb scale appropriate for the air speed.<br />
Read off the Basle Four-Hour Sweat Rate (B4SR) on the scale appropriate<br />
to the air speed.<br />
The P4SR is then found from the B4SR, by adding an amount dependent<br />
on activity and clothing.<br />
P4SR = B4SR + 0,37 lclo + (0,012 + 0,001 lclo) (M- 63)<br />
Wet Globe Temperature (WGT)<br />
Only one temperature Is required to determine wet globe temperature<br />
[Botsford, 13]. A thermometer Is placed In the centre of a hollow 2 1 /2-ln<br />
diameter black globe covered with a damp black cloth. When placed In a<br />
hot environment, equilibrium Is reached between evaporatlve cooling<br />
and convective and radiative heating. The equilibrium temperature obtained<br />
after approximately 10 to 15 minutes is called the Wet Globe<br />
Temperature (WGT). This is probably the simplest Index to determine. A<br />
version of this device (Botsford's ball) which contains a self-feeding<br />
water reservoir Is shown In Flg.5.<br />
The Wet Bulb Globe Temperature Index (WBGT)<br />
The index was originally established In the 1950's to provide the Navy<br />
with a method for judging the severity of the thermal environment and<br />
17
Water<br />
fill~<br />
hole<br />
Cloth<br />
hanging<br />
loop<br />
Alumlnum<br />
tube<br />
Plastic<br />
tube<br />
Tapered<br />
plug<br />
Copper<br />
globe<br />
Thermometer<br />
well<br />
Cloth<br />
covering<br />
Fig. 5. Sectional sketch showing construction of a Wet Globe Thermometer<br />
(not to scale)<br />
......<br />
the risk of heat casualties when performing exercise and training [Yaglou<br />
& Minard, 20].<br />
18
The transducers which are discussed in the next section were selected<br />
because they responded to the same environmental factors as a human<br />
being. From the research performed, the combination of parameters that<br />
was best related to the human response was found to be:<br />
WBGT = 0,7 · tnw + 0,3 · tg<br />
(units in oc or °F)<br />
where,<br />
and<br />
tnw= natural wet bulb temperature<br />
tg = globe temperature.<br />
However, it was found that in direct sunlight, the black globe overestimated<br />
the influence of the radiation. A third transducer, for measuring air<br />
temperature {t 8 ) was therefore introduced. In this case the measured<br />
values are combined in the following manner:<br />
WBGT = 0,7 tnw + 0,2 tg + 0,1 t 8<br />
This equation is very similar to the first equation with the exception that<br />
the influence of the globe temperature on the index is reduced.<br />
When the WBGT-index has been measured, the value can be compared<br />
with recommended limit values, which can be seen in Table 4 (from ISO<br />
7243). As seen in the table these limits are dependent on the activity<br />
level and on the state of acclimatization. A list of the different activity<br />
levels and examples of the type of activity are shown in Table 5. The<br />
WBGT-index and its use will be described in greater detail in the<br />
following chapter of this article.<br />
Analytical heat stress indices<br />
The Heat Stress Index (HSI)<br />
The Heat Stress Index (HSI) was developed at the University of Pittsburgh<br />
by Belding and Hatch in 1955 (14]. lt is based on a model of heat<br />
exchange which assumes a constant skin temperature of 35°C. Within<br />
the evaporative heat regulation zone it is assumed that the required rate<br />
of sweating Ereq is equal to the metabolic heat production (M) less the<br />
heat loss by radiation (R) and convection (C).<br />
E,eq<br />
=M-R-C<br />
No distinction is made between metabolic heat production and the<br />
energy required to perform work, and respiratory heat loss is ignored.<br />
The maximum evaporative loss which can occur is denoted by Emax· The<br />
heat stress index is defined as the ratio:<br />
19
HSI = (E, 6 q1Emax) x 100<br />
An upper limit of 390W/m 2 is assigned to Emsx; this corresponds to a<br />
sweat rate of 1 litre/h for a typical man. This was taken to be the<br />
maximum sweat rate that can be maintained over a period of 8 hours.<br />
The calculation procedures are shown in Table 2.<br />
A HSI of 100 represents the upper limit of the prescriptive zone, i.e. the<br />
zone where the body is in thermal equilibrium. If Ereq > Emax the body<br />
cannot maintain equilibrium and body temperature begins to rise. Many<br />
industrial working situations come into this category. Although work may<br />
be carried out for a limited period in such an environment, prolonged<br />
work is not possible. Exposure must be terminated before the heat<br />
accumulated in the body causes the deep body temperature to rise to a<br />
dangerous level. Belding and Hatch took 1 ,8°C as the maximum permissible<br />
rise in body temperature, corresponding to an additional heat<br />
storage in an average man of 264 kJ. lt is then possible to calculate the<br />
allowable exposure time (AET) from the formula in Table 2.<br />
The interpretation of HSI is shown in Table 3, which is an abbreviated<br />
version of the table given by Belding and Hatch [14].<br />
The HSI is an index which can easily be expressed in terms of the<br />
environmental variables. This has the considerable advantage that the<br />
effect of changing any of the variables can easily be estimated.<br />
Clothed<br />
Unclothed<br />
Radiation loss R (Wim 2 ) 4,4 (35 - t,) 7,3 (35 - t,)<br />
Convection<br />
loss<br />
Max.evaporatlve<br />
loss<br />
Required<br />
sweat loss<br />
Heat stress<br />
Index<br />
Allowable<br />
exposure time<br />
C(W/m 2 ) 4,6 vo.s (35- t.) 7,6 vo.s(35- t.)<br />
EmaA Wlm 2 ) 7v 0 • 6 (56-p 8 ) 11,7 vo.s(56-p.)<br />
Ereq( Wlm 2 )<br />
(upper limit of 390 W I m 2<br />
E,eq =M-R-C<br />
HSI HSI = Ereq I Emax x 100<br />
AET(mln)<br />
ET= 2440 I ( Ereq- Emax)<br />
Table 2. Equations for estimating the Heat Stress Index (HSI) and the<br />
Allowable Exposure Time (AET)<br />
20
HSI<br />
-20 Mild cold strain<br />
0 No thermal strain<br />
10-30<br />
40-60<br />
EHect of eight-hour exposure<br />
Mild to moderate heat strain. Little effect on physical work,<br />
but possible decrement on skilled work<br />
Severe heat strain, Involving threat to health unless physlcarry<br />
fit. Acclmatlsatlon required<br />
Very severe heat strain. Personnel should be selected by<br />
70-90 medical examination. Ensure adequate water and salt Intake<br />
100 Maximum strain tolerated by fit acclimatised young men<br />
Over<br />
100<br />
Exposure time limited by rise In deep body temperature<br />
Table 3. Interpretation of Heat Stress Index<br />
10DUIOIJO<br />
The Index of Thermal Stress (ITS)<br />
The Index of thermal stress (ITS) was Introduced by Glvonlln 1963 [15]. it<br />
combines some of the advantages of the P4SR and of the HSI. The<br />
derivation of ITS owes Its form to that of the HSI, but as with the P4SR<br />
the measure of strain used Is the sweat rate. The result Is that the ITS<br />
has an analytical form, which can be evaluated on a calculator and<br />
manipulated to demonstrate the effect of changing the environmental<br />
variables. The use of sweat rate as the measure of environmental stress<br />
is more fundamental than the wettedness ratio (i.e. E,eq1Emax) used by the<br />
HSI.<br />
The derivation starts with the basic heat loss equation:<br />
El'fKI = H- ( C + R) - Rs<br />
where the usual notation Is used and Rs Is the solar load. The metabolic<br />
free heat production H Is used to give greater accuracy when external<br />
work Is performed. In the prescriptive zone, where the body Is In thermal<br />
equilibrium, actual sweat rate Sw, measured In equivalent Wl m 2 , Is In<br />
general greater than El'fKI. This Is because both the secretion and the<br />
evaporation of sweat occur unevenly over the body. So some parts of<br />
the body become completely wet and lose sweat by dripping, before the<br />
rest of the body Is completely wet. The efficiency of sweating Is expressed<br />
quantitatively using the term by 77 se, and therefore the actual sweat<br />
rate Is given by the equation:<br />
21
The efficiency of sweating 77 se depends on E,eq I Emax, where Emax depends<br />
on the air velocity and the water vapour pressure In the ambient<br />
air. Substituting the basic heat loss equation for E,eq gives the formula<br />
for ITS (units In glhr), which Is a prediction of the sweating rate.<br />
ITS = { H- ( R + C) - R 8 ) I (0,37 77 se)<br />
The factor 0,37 converts the sweat rate from Wlm 2 Into glhr for an<br />
average man.<br />
This formula Is relatively straightforward to compute, particularly on a<br />
programmable calculator. The detailed formulae for estimating the dry<br />
heat loss (R+ C, radiation + convection), effect of sunshine (R 8 ), maximum<br />
evaporation (Emax) and efficiency of sweating (77 se) are not· included.<br />
But by knowing the air temperature, mean radiant temperature, air<br />
velocity, water vapour pressure (humidity), activity level and clothing the<br />
ITS - Index may be calculated.<br />
New Effective Temperature (ET*)<br />
This index should not be confused with the empirical Indices ET or CET<br />
described earlier. The new Effective Temperature is an analytical temperature<br />
index based on the heat balance equation for a human being<br />
(Gagge et al. [16]).<br />
The ET* Index combines the Influence of activity, clothing, air temperature,<br />
mean radiant temperature, air velocity and humidity. For an actual<br />
environment, the ET* may be calculated knowing the above 6 factors.<br />
The thermal stress of ET* In the actual situation Is then the same as the<br />
thermal stress on a sedentary person, dressed in 0,6 clo, and exposed to<br />
50% relative humidity and an equivalent temperature equal to ET*.<br />
This index is rather difficult to describe without writing a whole paper. At<br />
this stage it is enough to know that it is based on the heat balance<br />
equations and it includes all 6 factors.<br />
Required Sweat Rate Index (SR)<br />
The Required Sweat rate Is an analytical index, which now Is being<br />
proposed by ISO as a Draft Standard ISOIDIS 7933. This Index should be<br />
a supplement to the more simple WSGT-index, when a more detailed<br />
analysis is needed. This method Is In principle very similar to the method<br />
used in the ITS-index. Based on the heat balance equation for the human<br />
body the required sweating for thermal equilibrium Is estimated.<br />
22
First the necessary equation (Ereq) is estimated from:<br />
Ereq =M- W-C-R<br />
This can be calculated by knowing the metabolic rate (M, W), thermal<br />
Insulation of the clothing (lc 1 ), air temperature (t 8 ), air velocity (v 8 ) and<br />
mean radiant temperature (f,). Then the heat loss by radiation (R) and<br />
convection (C) may be calculated.<br />
The maximum evaporation (Emax), which can be absorbed by the environment,<br />
is estimated by the equation:<br />
where<br />
Psk.s<br />
Pa<br />
= saturated water vapour pressure at the skin (- 5,9 k Pa)<br />
= water vapour pressure in the environment (k Pa)<br />
R 9 = water vapour resistance of the clothing (m2 k Pa I W)<br />
Based on the required evaporation (Ereq) and the maximum evaporation<br />
(Emax) it is then possible to estimate the following factors:<br />
Required skin wettednes<br />
Required sweat rate<br />
Sweating efficiency<br />
Wreq = Ereql r<br />
SW, 9 q = Ereql r<br />
r = 1 -0,5. e-6,6(1-wreq)<br />
Dependent on the physiological limitations to factors such as sweat<br />
rate, total sweat loss, heat storage and skin wettedness, which are<br />
listed in Table 1, it is possible to evaluate if continuous work is<br />
acceptable. If not there are procedures for calculating the accepted<br />
working time.<br />
As for other analytical Indices it is necessary to know the activity level,<br />
clothing (thermal insulation, water vapour resistance) and the four<br />
environmental parameters (air temperature, mean radiant temperature,<br />
air velocity, humidity). This method is described by Vogt et. al [17, 18].<br />
23
WBGT -Heat stress index<br />
The International Standard ISO 7243, which was published in 1982, is<br />
based on using the WBGT-index for evaluation of hot working<br />
environments.<br />
This is the first time that an agreed International Standard on heat<br />
stress is accepted. Before publication of the ISO standard, this index<br />
had already been used In several countries and in many different<br />
workplaces. lt has been especially widely used in the USA and TLV's<br />
(Threshold Limit Values) have been established by ACGIH (American<br />
Conference of Government and Industrial Hygienists), (19]. In many<br />
other countries the WBGT-index has also been recommended by the<br />
local Occupational Safety and Health Associations. The Index was<br />
originally established to provide the Navy with a method for judging the<br />
severity of the thermal environment and the risks for heat casualties,<br />
when performing exercise and training. The transducers which are<br />
discussed in the next section were selected because they responded to<br />
the same environmental factors as a human being (air temperature,<br />
mean radiant temperature, air velocity, humidity). The combination that<br />
was best related to the human response was found to be:<br />
WBGT = 0,7 tnw + 0,3 tg<br />
where<br />
tnw = natural wet bulb temperature (°C, °F)<br />
tg = standard globe temperature (°C, °F)<br />
In direct sunlight, it was found that the black globe overestimated the<br />
Influence of the radiation and therefore a third transducer for measuring<br />
air temperature, ta was Introduced. In this case the measured values<br />
should be combined in the following way:<br />
WBGT= 0,7tnw+ 0,2tg+ 0,1 Ita<br />
where<br />
ta = air temperature (°C, °F)<br />
The background for using the WBGT-index has been well described in<br />
literature, since the Index was introduced in the 1950's (21, 22, 23, 24].<br />
This Index is therefore well known to those dealing with hot<br />
environments.<br />
When the WBGT-index has been measured, the value can be compared<br />
with the recommended limit values, which can be seen In Table 4 (from<br />
ISO 7243). As seen in the table these limits are dependent on the activity<br />
24
llelabolic<br />
llelabolic rete, 11<br />
Total<br />
11e1erence ••lue of W80T<br />
rete cleu Related to a unit (for a meen skin Person acclimatized Person not acclimatized<br />
skin surface area surface area of to heat to heat<br />
W/m 2 1,8 m')<br />
w ·c ·c<br />
D<br />
(resting)<br />
M< 65 M< 117 33 32<br />
1 65
Metabolic rate range, M<br />
Value to be used<br />
Class related to for a mean for calculation of Examples<br />
a unit skin skin surface mean metabolic<br />
surface area area of 1 ,8 m' rate<br />
W/m 2 w W/m 2 w<br />
0<br />
Resting<br />
M
Fig. 6. WBGT Transducers<br />
temperature of this sensor, the natural wet bulb temperature (tnwJ, is<br />
most of the time lower than the air temperature. Because the measured<br />
natural wet bulb temperature will be influenced by the size and construction<br />
of the sensor the requirements have been described in detail in ISO<br />
7243 as follows:<br />
a) Shape of the sensitive part of the sensor: cylindrical<br />
b) External diameter of the sensitive part of the sensor: 6 ± 1 mm<br />
c) Length of the sensor: 30 ± 5 mm<br />
d) Measuring range: 5 to 40°C<br />
e) Accuracy of measurement: ± 0,5°C<br />
f) The whole sensitive part of the sensor shall be covered with a white<br />
wick of a highly water-absorbant material (for example cotton).<br />
g) The support of the sensor should have a diameter equal to 6 mm<br />
and 20 mm of it should be covered by the wick to reduce conduction<br />
from the support to the sensor<br />
h) The wick should be woven in the shape of a sleeve and should be<br />
fitted over the sensor precisely. Too tight or too loose a grip is<br />
detrimental to the accuracy of measurement. The wick should be<br />
kept clean.<br />
j) The lower part of the wick should be immersed in a reservoir of<br />
distilled water. The free length of the wick in the air should be 20 to<br />
30mm<br />
k) The reservoir should be designed in such a way that the temperature<br />
of the water inside cannot rise as a result of radiation from the<br />
atmosphere.<br />
27
Important Note: lt is important to remember that it is the natural wet<br />
bulb temperature and NOT the psychrometric wet bulb temperature<br />
which is used.<br />
Psychrometric wet bulb temperature is also measured with a temperature<br />
sensor covered by a wet wick; but the sensor is exposed to a forced<br />
air velocity (> 2 m/s) and preferably also shielded from any environmental<br />
thermal radiation. Thus, the psychrometric wet bulb temperature will<br />
always be lower than the natural wet bulb. temperature.<br />
The psychrometric wet bulb temperature is influenced by the humidity<br />
and air temperature of an environment. lt is often used, together with air<br />
temperature, to measure relative humidity or water vapour pressure. On<br />
the other hand, natural wet bulb temperature is influenced by air temperature,<br />
air velocity, radiant temperature and humidity of the environment.<br />
Especially at low air velocities and high radiant levels there is a significant<br />
difference between the two values.<br />
The difference between the natural wet bulb temperature and the psychrometric<br />
wet bulb temperature is influenced by the radiant temperature,<br />
air temperature, air velocity and humidity - series of curves giving<br />
these relations are shown in Fig. 7 for one air temperature level. The<br />
curves are based on equation from Malchaire [25]. A connection from<br />
psychrometric wet bulb to natural wet bulb can then only be performed<br />
when air temperature, globe temperature and air velocity are also<br />
known.<br />
Globe Temperature<br />
A globe thermometer is used to account for the heat exchange due to<br />
radiation. The standard globe is a radiantly black, hollow 0,15 m (6 inches)<br />
diameter sphere normally made of copper. The globe temperature<br />
(t 9<br />
) is the temperature at the centre of the sphere, which is equal to the<br />
mean surface temperature of the sphere. Globe temperature is influenced<br />
by air temperature, radiant temperature and air velocity.<br />
The specifications for the globe-sensor are in ISO 7243 as follows:<br />
28<br />
a) Diameter: 150 mm.<br />
b) Mean emission coefficient: 0,95 (matt black globe).<br />
c) Thickness: as thin as possible.<br />
d) Measuring range: 20 to 120°C.<br />
e) Accuracy of measurement<br />
- range 20 to 50°C: ± 0,5°C;<br />
- range 50 to 120°C: ± 1°C.
12<br />
•c<br />
11<br />
10<br />
t. = 20•c<br />
1,. = 5•c, RH = 0%<br />
1,. = 15°C, RH = 60%<br />
9<br />
8<br />
7<br />
J<br />
J<br />
6<br />
5<br />
4<br />
3<br />
2<br />
5 10<br />
15<br />
20 25 30 ·c<br />
'•- t.<br />
850688<br />
Fig. 7. Diagram to estimate the difference between natural wet bulb<br />
temperature, tnw and psychrometric wet bulb temperature, tw- The<br />
difference depends on air temperature, t 8 , air velocity, v 8 , temperature<br />
radiation, tg and humidity level<br />
29
•c<br />
v, = 2,0 m/s<br />
8<br />
Actual globe diameter = 0,05 m<br />
Air temperature (t,) = 20• C<br />
7<br />
iii 6<br />
u "<br />
.!!.<br />
.J" 5<br />
E"<br />
.. 4<br />
-g<br />
..<br />
!<br />
.J" 3<br />
2<br />
20 30<br />
t• (standard)-t,<br />
40<br />
Fig. 8. The difference between the globe temperature measured using a<br />
0,15m (standard) and a 0,05m diameter globe. The difference<br />
depends on air velocity and the difference between the globe (tg)<br />
and air temperatures (ts)<br />
Because of the rather slow response time of a standard globe<br />
(10-30mins.) it may be an advantage to use a smaller globe. This<br />
means, however, that the influence of the thermal radiation will be less.<br />
Fig.8 shows the difference between the standard globe temperature<br />
(diameter= 0,15cm) and the globe temperature measured by a smaller<br />
globe (diameter = 0,05 cm) dependent on air temperature, globe temperature<br />
and air velocity. Especially at high air velocities and big differences<br />
between air- and globe temperature (high radiant load) these<br />
differences become very significant. When using a smaller globe it is<br />
then necessary to correct the measured value before estimating the<br />
WBGT-index. There exist formulae for these corrections; but the corrections<br />
can only be made when air temperature and air velocity are known.<br />
30
lt is also questionable what advantages can be achieved by using a<br />
smaller globe with a shorter response time. First of all the measuring<br />
time must be based on 1 hour mean values and the response time of the<br />
deep body temperature is not so fast.<br />
Air Temperature<br />
Because the globe overestimates the influence of direct sunshine, due to<br />
the high absorption compared to the human skin and clothing, it was<br />
decided to introduce the air temperature. Therefore when measuring in<br />
direct sunshine the air temperature should be measured by a radiantly<br />
shielded sensor. The measuring range for the air temperature is 10 to<br />
60°C and the accuracy ± 1 °C.<br />
Measuring positions<br />
The WBGT-index should always be measured at the work place, i.e. the<br />
transducers should substitute the person or be placed at a position<br />
where the heat exposure is assumed to be the same. The measurements<br />
should then be performed in the abdomen level (0,6 m for seated, 1,1 m<br />
for standing persons). If the exposure varies significantly it should be<br />
measured at three levels: feet, abdomen and head. This corresponds to<br />
0,1; 0,6 and 1,1 m above floor level for seated and 0,1 ; 1,1 and 1, 7 m for<br />
standing persons. The WBGT-index is then based on the mean value<br />
according to:<br />
WBGT = WBGThead + 2 · WBGTabd9men + WBGTreet<br />
4<br />
The measurement at abdomen level has then a higher weighting factor<br />
than head and feet.<br />
lt is very important that the transducers are positioned in such a way<br />
that they are not screened from the radiation, which will influence the<br />
work place.<br />
Time weighted average<br />
During a working day both the thermal environment and also the place of<br />
work for a person may change. The WBGT-index should then be based<br />
on a time weighted average with a 1 hour time basis:<br />
31
where<br />
WBGT = t1 · WBGT1 + t2 · WBGT2 + ..... tn · WBGTn<br />
t1 + t2 + ...... + tn<br />
WBGTn = WBGT determined for situation n<br />
tn = time spent at situation n<br />
~tn = 1 hour<br />
When determing the corresponding exposure limit according to Table 4<br />
it is also necessary to estimate a time weighted average for the activity<br />
level.<br />
This method of applying time weighted average values may also be<br />
used, when planning a work-rest schedule. An example Is shown In Flg.9.<br />
The curves show the relation between the time weighted average metabolic<br />
rate and the acceptable exposure limit for acclimatized person<br />
exposed to air movement which can be sensed (Table 4). lt Is here<br />
assumed that the person is resting at the same workplace, l.e.that the<br />
WBGT-index is the same when working and when resting. The curves<br />
can be estimated from Table 4 and the use of time weighted average of<br />
the metabolic rate.<br />
When the person is resting In an environment with another WBGT-value<br />
this has to be taken into account as shown in the following example:<br />
Example:<br />
A person acclimatized to heat works according to the following<br />
schedule:<br />
Time<br />
20mln.<br />
20min.<br />
20min.<br />
Metabolic rate<br />
230 Wlrrt<br />
165 Wlrrf<br />
65 Wlrrf<br />
WBGT<br />
32
~r-----r-----,------r--<br />
p<br />
~<br />
Cl)<br />
3:<br />
30 25% work - 75% resting<br />
50"/o work - 50"/o resting<br />
75% work - 25% resting<br />
25<br />
Continuous work<br />
~~----L-----~-----L--<br />
100 200 300 W/m2<br />
100 200 300 400 500 600 w<br />
Metebollc rate<br />
amer<br />
Fig. 9. Curves showing reference values of WBGT established for various<br />
work/rest cycles. The curves plotted assume that the WBGT value<br />
at the resting place Is equal to the WGBT value at the workplace<br />
(time base equal to 1 h; sensible air movement; person aclimatized<br />
to heat). These curves may facilitate the reorganisation of the<br />
work by changing the work/rest cycles. After ISO 7243 Annex. B.<br />
The time weighted average of the metabolic rate is then:<br />
230X20 + 165 X 20 + 65 X 20 -2<br />
M =<br />
= 153 Wlnr<br />
20+20+20<br />
This corresponds to class 2 in Table 5 and the acceptable exposure limit<br />
is then 28°C. This is exactly the same as the WBGT measured at the<br />
work place.<br />
Now if instead the person is resting (65 Wlm2) in another environment<br />
with WBGT = 20°C the WBGT-index for this person will be<br />
20x 28°C + 20 x 28°C + 20 x20°C<br />
WBGT =<br />
= 25,3°C<br />
20x20x20<br />
33
This is lower than the limit 28°C. At this WBGT value (25,3°C) a time<br />
weighted average metabolic rate equal to class 3 can be accepted.<br />
The selection of place and time for the measurement of the environmental<br />
conditions is very important. The worst situation from the point of<br />
view of heat stress must be evaluated. If the process changes, it must be<br />
studied carefully so as to determine the worst conditions. if the process<br />
is constant, the hottest part of the day must be evaluated. This often<br />
coincides when the outdoor temperature and/or sunload is the highest.<br />
The evaluation of the worst conditions should be made, as mentioned<br />
before, on the basis of a 1 hour mean value for the WBGT-Index.<br />
The best solution is often to measure a whole working period/day (i.e.<br />
4-8 hours) and then afterwards study the changes by estimating mean-,<br />
maximum- and minimum values, and maximum 1 hour mean value for<br />
the WBGT-index. Flg.10 shows a 4-hour measurement of the WBGTindex<br />
with indication of the above mentioned statistical values. These<br />
values are all determined automatically by using the new 1219 WBGT<br />
Heat Stress Monitor from BrOel & Kj~:er. The instrument also displays at<br />
what time the 1-hour period with the highest heat stress started. This<br />
feature facilitates the measurement significantly.<br />
Conclusion<br />
There is no heat stress index developed to date, which provides the true<br />
answer to the evaluation of heat stress in all situations. When all factors<br />
which Influence man's response to heat are considered, there will always<br />
be a certain degree of inaccuracy when predicting Individual situations.<br />
Besides being used for predicting man's response to hot environments a<br />
heat stress index may also be used for comparisons between situations;<br />
WBGT-Index<br />
Maximum 1 hr mean value<br />
Fluctuating<br />
Instantaneous<br />
value<br />
2 3 4<br />
Start time of max. 1 hour<br />
mean value of WBGT.<br />
Time<br />
(hours)<br />
Fig. 10. 4-hour measurement of the WBGT-index showing maximumminimum-<br />
mean- and the 1 hour maximum mean value<br />
34
as for instance before and after implementation of a new process or<br />
devices which should reduce the level of heat stress.<br />
Even if the WBGT-index may have its limitations, it is an Index which has<br />
been widely used and considerable experience has been gained. As a<br />
screening index it is very useful. Whenever dealing with a hot workplace<br />
it is recommended that the workplace should always be mapped using<br />
the WBGT-index. Only at places where the index values are above or<br />
close to the recommended limit values it may then be necessary with a<br />
more detailed analysis. This could then be made by using the Required<br />
Sweat Rate index.<br />
Whenever a threshold or limit value has been set it should be used<br />
carefully and with common sense. Exceeding a limit value does not<br />
necessarily indicate catastrophe or that all work should be stopped. lt<br />
just implies that it is necessary to take some precautions when continuing<br />
the work. Often it will just be a matter of changing the work-rest<br />
schedules or to plan the work so that the work with the highest activities<br />
is not performed at the time of the day when the heat stress is highest.<br />
With the international standardization and better measuring instrumentation<br />
a more uniform evaluation of hot workplaces should be hopefully<br />
possible in the future.<br />
References<br />
[ 1] WHO<br />
[ 2] LEITHEAD, C. S. &<br />
LINO, A. R.<br />
[ 3] KERSLAKE, D.<br />
[ 4] HARDY, J. D. (Ed.)<br />
[ 5]1SO 7243<br />
[ 6] ASTRAND, P. 0. & RO<br />
DAHL, K.<br />
"Health Factors Involved in Working Under<br />
Conditions of Heat Stress", WHO<br />
Technical Report Series No. 412, 1969<br />
"Heat Stress and Heat Disorders, Cassell,<br />
London 1964<br />
"The Stress of Hot Environment, University<br />
Press, Cambridge 1972<br />
"Temperature: Its Measurement and<br />
Control in Science and Industry, Reinhold,<br />
3<br />
"Hot environments-Estimation of the<br />
heat stress on a working man, based on<br />
the WBGT -index (wet bulb globe temperature),<br />
International Standard Organisation,<br />
Geneva 1982<br />
"Textbook of Work Physiology, New<br />
York, McGraw-Hill, 1977<br />
35
[ 7) ISO/DIS 7933<br />
[ 8) VOGT, J. J., MEYER<br />
SCHWARTZ, M. TH,<br />
METZ, B & FOEHR, R<br />
[ 9) OLESEN, B.W.<br />
[10) RAMANATHAN, N.L.<br />
[11] HOUGHTEN, F.C. & YAG<br />
LOU, C.P.<br />
[12] McARDEL, B,<br />
DUNHAM, W,<br />
HOLLING, H.E.,<br />
LADELL, W.S.S.,<br />
SCOTT, J.W.,<br />
THOMSON, M.L. & WEIN<br />
ER,J.S.<br />
[13] BOTSFORD, J.H.<br />
[14] BELDING, H.S. &<br />
HATCH, T.F.<br />
[15) GIVONI, B<br />
[16] GAGGE, A.P.,<br />
STOLWIJK, J.A.J. & NI<br />
SHI, Y<br />
[17) VOGT, S.S., CANDAS, V.,<br />
LIBERT, S.P. &<br />
DAULL, F.<br />
[18) VOGT, S.S., CANDAS, V.<br />
& LIBERT, S.P.<br />
36<br />
"Hot environments - Analytical determination<br />
of thermal stress", International<br />
Standard Organisation, Geneva 1985 (in·<br />
press)<br />
"A Methodology for lndirec~ Estimation<br />
of Intermittent Muscular Work and Environmental<br />
Heat Loads, Ergonomics,<br />
Vol.16, No.1, pp.45-60, 1973<br />
"How many sites are necessary to estimate<br />
a mean skin temperature?" in<br />
"Thermal Physiologi" edited by J.R.S.<br />
Hales, Raven Press, New York, 1984<br />
"J.Appi.Physiology", Vol, 19, p.531-533,<br />
1964<br />
"Determining lines of equal comfort",<br />
ASHVE Trans, Vol.29, p. 163, 1923<br />
"The prediction of the physiological effect<br />
of warm and hot environments",<br />
Med. Res. Council R.N.P. Vol.47, p. 391,<br />
H.S. 194/1947<br />
"A wet globe thermometer for environmental<br />
heat measurement", Jnl. Amer.<br />
Industrial Hygiene, Vol.32, pp.1-10, 1971<br />
"Index for evaluating heat stress in terms<br />
of resulting physiological strain, Heating,<br />
Piping, Air.Cond.", Vol.27, p. 129, 1955<br />
"Man, climate and architecture", 2nd.<br />
edition Applied Science, London<br />
"An effective temperature scale based<br />
on a simple model of human physiological<br />
regulatory response", ASHRAE<br />
Trans., Vol.77(1), pp.247-262, 1971<br />
"Required sweat rate as an index of thermal<br />
strain in industry". In Bioengineering,<br />
Thermal Physiology and Comfort (Ed. by<br />
K. Cena and S.A. Clark) Amsterdam Elsevier,<br />
1981<br />
"Graphical determination of heat b<br />
tolerance limits", Ergonomics, Vol.25,<br />
No.4, 1982
[19] A.C.G.I.H.<br />
[20) YAGLOU, C.P. & MIN<br />
ARD, D.<br />
[21] MINARD, D<br />
[22] MINARD, D. &<br />
BRICH, R.L.O.<br />
[23] MINARD, D.,<br />
BELDING, H.S., & KING<br />
STON. J.R.<br />
[24] DUKES-DOBOS, HENS<br />
CHEL, A.<br />
[25] MALCHAIRE, J.B.<br />
[26] HEY, E.N.<br />
[27] ISO 7726<br />
"TLV's Threshold Limit Values for Chemical<br />
Substances and Physical Agents in<br />
the Workroom Environment", American<br />
Conference of Governmental Industrial<br />
Hygienists, 1976<br />
"Control of Heat Casulatles of Military<br />
Training Centres", Arch. lndust. Health,<br />
16, 302, 1957<br />
"Prevention of Heat Casualties In Marine<br />
Corps Recruits with Comparative Incidence<br />
Rates and Climatic Heat Stresses<br />
In other training categories", Research<br />
Report No.4, Naval Medical Research Institute,<br />
Bethesda, Maryland, 1961<br />
"Heat Casualties In the- Navy and Marine<br />
Corps, 1964, with Appendices on the<br />
Field Use of the Wet Bulb - Globe Temperature<br />
Index", 1959-1962, Research<br />
Report No.7, Naval Medical Research Institute,<br />
Bethesda, Maryland<br />
"Prevention of Heat Casualties",<br />
J.A.M.A. 165, 1813, 1967<br />
"Development of Permissible Heat Exposure<br />
Limits for Occupational Work",<br />
ASHRAE Journal, 15, 57, 1973<br />
"Evaluation of natural wet bulb and wet<br />
globe thermometers", Ann. occup. Hygiene,<br />
Vol.19, Pergamon Press, 1976<br />
"Small globe thermometers", S. Scientitic<br />
Instruments, Series 2, Vol.1, 1968<br />
"Thermal environments-Instruments and<br />
methods for measuring physical characteristics",<br />
International Standard Organisation,<br />
Geneva 1985, (In press)<br />
37
A NEW THERMAL ANEMOMETER PROBE<br />
FOR INDOOR AIR VELOCITY MEASUREMENTS<br />
by<br />
Finn Johannessen, M.Sc.<br />
ABSTRACT<br />
In this article a new hot film anemometer probe for Indoor climate Investigations<br />
Is described. Due to Its Innovative design principles, this probe is ideally suited<br />
for measuring low air velocities In indoor spaces. A discussion of all the physical<br />
parameters Influencing the measuring accuracy Is given, and in addition new<br />
equipment for testing low velocity anemometers Is described.<br />
SOMMAIAE<br />
Cet article decrlt une nouvelle sonde anemometrique a film chaud pour les etudes<br />
d'amblances thermlques lnterieures. Grace a sa conception enth~rement nouvelle,<br />
cett.e sonde convient parfaitement aux mesures des falbles vitesses d'ecoulement<br />
d'air dans les espaces interieurs. Tous les parametres physiques influencant la<br />
precision de la mesure y sont discutes et on y trouve egalement la description<br />
des tests d'anemometres pour falbles vitesses d'alr.<br />
ZUSAMMENFASSUNG<br />
Dleser Artlkel stellt elne neue Helfi-FIIm-Anemometer-Sonde vor. Mlt lhr soli das<br />
Raumkllma beurtellt werden. Durch fortschrittllche Konstruktlon eignet sich dlese<br />
Sonde Ideal zur Messung nledrlger Luftgeschwlndlgkeiten In Raumen. Alle physlkallschen<br />
Parameter, die die Meflgenauigkeit beeinflussen, werden diskutiert.<br />
DarOberhlnaus werden neue Gerate zur PrOfung von Anemometern fOr niedrige<br />
Luftgeschwlndlgkeiten vorgestellt.<br />
1. Introduction<br />
The Bruel & Kjasr Indoor Climate Analyzer Type 1213 is a microprocessor<br />
based measuring instrument dedicated to the measurement of all the<br />
physical parameters necessary to make a thorough evaluation of the<br />
thermal environments for people in indoor spaces.<br />
Complaints against the indoor climate very often concern draught.<br />
Therefore, an evaluation of the Indoor climate should always include<br />
measurement and analysis of air velocity in order to find the underlying<br />
causes of the problems.<br />
38
An article describing the influence of air velocity and other relevant<br />
parameters on thermal comfort, and how to measure them, appeared In<br />
an earlier issue of Technical Review ( 8 Local Thermal Discomfortu B & K<br />
Technical Review, No.1 - 1985). The present article will discuss the<br />
construction and performance of the new 8 & K Air Velocity Transducer<br />
Type MM 0038, which is one of the five transducers used in connection<br />
with the Indoor Climate Analyzer.<br />
With Its untraditional design, combining convenience in use with high<br />
accuracy, this transducer may well set a new trend in transducer<br />
technology.<br />
Requirements for the Transducer<br />
For measuring Indoor air velocities In a range which has influence on<br />
thermal comfort, the transducer had to meet the following requirements:<br />
1) lt should be sensitive enough to detect the lowest air velocities that<br />
can be perceived by human beings.<br />
2) lt should have fast response, as fluctuating air velocities reduce<br />
comfort.<br />
3) lt should be omnidirectional, i.e. have the same sensitivity for air<br />
flow from all directions, since the direction of the Indoor air velocity<br />
is In most cases unknown and variable.<br />
4) Finally, it should be sufficiently sturdy so that it can be moved<br />
around from place to place several times a day, without any risk of<br />
being damaged.<br />
Choice of Measuring Principle<br />
A number of different physical principles can be utilized for measuring<br />
air velocity. However, the requirement for omnidlrectionality combined<br />
with high sensitivity at low velocities indicated the thermal anemometer<br />
to be the best solution. With this type of anemometer the air velocity is<br />
determined as a function of the forced convective heat loss from a small<br />
heated body. By proper choice of geometrical shape, material and<br />
heating rate it is possible to construct a probe which meets all the above<br />
requirements.<br />
Description of the B & K Air Velocity Transducer Type MM 0038<br />
A long series of experiments at the BrOel & Kjaer development department<br />
has resulted in a hot film anemometer probe of an entirely revolutionary<br />
design. Some of the design criteria will be discussed later In this<br />
article.<br />
39
Solid sphere<br />
\ Plastic foam<br />
ellipsoids with<br />
nickel resistors<br />
~1-<br />
Steel tube<br />
f· shaft<br />
containing<br />
measuring<br />
bridge<br />
Fig. 1. The B & K Air Velocity Transducer Type MM 0038<br />
As shown In Flg.1 the probe consists of two wlrewound nickel resistance<br />
thermometers wound on ellipsoidal cores made of a highly thermal<br />
Insulating foam material, ground to shape and supported by a thin<br />
stainless steel tube.<br />
The upper ellipsoid carries three coils of electrically heated nickel wire;<br />
the lower has one unheated coil acting as an air temperature reference.<br />
The coils are wound In a single layer without any space between the<br />
wlndlngs, and they are finally protected by a thin layer of white epoxy<br />
enamel. Thin copper leads passing through the supporting tube connect<br />
the two sensors to a measuring bridge on a printed circuit board In the<br />
shaft.<br />
The resistance and temperature coefficient of the nickel wire are extremely<br />
stable and well defined, making lt possible to produce fully Interchangeable<br />
transducers.<br />
40
MM0038, I 1213<br />
I<br />
I<br />
I<br />
I<br />
Bridge Voltage<br />
Unheated<br />
I I<br />
sensor I I Oscillator<br />
I<br />
.__<br />
120Hz<br />
Bridge<br />
2% duty cycle<br />
Error<br />
I I<br />
Voltage I I<br />
~<br />
Heating Voltage<br />
Fig. 2. Simplified diagram of the transducer circuit<br />
Flg.2 shows a diagram of the measuring bridge, which, together with a<br />
servo system In the Indoor Climate Analyzer, controls the heating rate In<br />
such a way that a constant temperature difference Is maintained between<br />
the two ellipsoidal sensors. Two Important advantages are gained<br />
from controlling the sensor temperature In this manner: Variations In air<br />
temperature will cancel out and the transducer's response to a sudden<br />
change In air velocity Is much faster than the thermal resonse of the<br />
sensors.<br />
To avoid an excessive temperature Increase In the lower sensor and to<br />
obtain the greatest accuracy In determining the actual deviation from<br />
correct temperature difference, the servo system Is operated In pulse<br />
mode. The error voltage across the bridge Is measured In short pulses,<br />
during which the heating voltage Is switched off. Subsequently, the<br />
measured error voltage Is amplified, stored In a sample-and-hold circuit<br />
and then passed to a small switch-mode power supply, which controls<br />
the heating voltage.<br />
In view of the battery power supply the whole circuit Is designed for<br />
minimum power consumption.<br />
As a special feature, only the central zone of the heated sensor Is<br />
incorporated In the measuring bridge. This gives a considerably shorter<br />
response time, due to the more uniform temperature distribution on this<br />
part of the heated surface.<br />
41
Cable resistance compensation is provided, which means that an extension<br />
cable can be used without sacrificing accuracy.<br />
The air velocity Is determined as a function of the voltage over the<br />
central zone of the heated sensor. The signal is conditioned in an<br />
analogue circuit and then passed to an AID converter for further digital<br />
signal processing.<br />
This results In seven different outputs on the Indoor Climate Analyzer:<br />
On the digital display either the air velocity or its standard deviation can<br />
be obtained. Both are displayed as an exponentlally damped signal with<br />
a 6 seconds time constant and at the same time as a linear average for<br />
the last 3 minutes. Maximum displayed value is 1 ,00 m/s but peaks in<br />
velocity up to 1 ,50 m/s are accepted for both the damped and the<br />
averaged outputs.<br />
The two damped signals, air velocity and its standard deviation, are also<br />
available as llnearized analogue voltages on the rear panel along with<br />
the Instantaneous air velocity, which normally fluctuates too fast to be<br />
read from a digital display. The latter is updated 20 times per second.<br />
Air velocity data for certain preselected measuring periods, along with<br />
data from the other four transducers, may be stored In the memory of<br />
the 1213 for later read out on an X-Y recorder or on the display.<br />
The different air velocity signals are calculated by the microprocessor in<br />
the following way: The Instantaneous air velocity Is sampled with a<br />
sampling Interval of 0,4 s. The exponentially damped signal and its<br />
standard deviation are then determined using the recursion formulae:<br />
Vn = Vn-1 +<br />
V 8 (n)- V n-1<br />
16<br />
< V>ssec = Vn<br />
O'ssec<br />
Where: v 5 (n) = sample no. n of the instantaneous air velocity<br />
< v> =damped or mean air velocity<br />
u = standard deviation<br />
42
The 3 minutes mean and its standard deviation are calculated every 10 s<br />
by storing the last 450 samples of the Instantaneous air velocity and then<br />
applying the formulae:<br />
1<br />
V= 450<br />
450<br />
I:<br />
n=1<br />
450<br />
I:<br />
n = 1<br />
v~(n)<br />
< v>amln =V<br />
Fig. 3. The Wind Wheel<br />
suitable slot. If the disturbance caused by the probe and the slot is<br />
sufficiently small, the air velocity around the probe will be equal to the<br />
velocity of the container at the same distance from the rotational axis.<br />
The Wind Wheel is actually constructed as shown in Fig.3. The rotating<br />
container is disc-shaped with a diameter of 1, 7 m and a thickness of<br />
0,4 m. In one side there is a slot closed with two brush panels. The probe<br />
under test is placed in a hinged holder fitted with a "plough" to open the<br />
brushes.<br />
The wheel is kept in constant rotational motion by a servo motor, and<br />
the resulting rotational speed, i.e. the air velocity can be monitored using<br />
the output from an angle encoder on the wheel axle. The wheel can<br />
produce air speeds from 0 to 10 m/s. The upper limit is set for safety<br />
reasons.<br />
In order to ensure correct performance, any inside air flow relative to the<br />
walls of the wheel caused by the inserted probe must be negligible with_in<br />
44
less than one revolution. This is provided by vanes of damping material<br />
(metal nets) mounted inside the wheel perpendicular to the direction of<br />
movement. Each vane is provided with a cut-out to allow the probe to<br />
pass at a safe distance.<br />
A specially designed ultra low velocity hot wire anemometer, developed<br />
to test the efficiency of the damping material, is mounted inside the<br />
wheel and rotates with it. This fast response anemometer has an excess<br />
temperature on the "hot" wire as low as 3°C, which makes it possible to<br />
detect air velocities lower than 1 cm/s. Even with this high sensitivity it is<br />
impossible to detect any movement relative to the wheel of the air<br />
impinging on the transducer under test, indicating that the wheel<br />
functions properly.<br />
A patent is pending for the Wind Wheel.<br />
The performance of the MM 0038 Air Velocity Transducer<br />
The Wind Wheel is an invaluable tool, not only for calibration purposes,<br />
but also for investigating the overall performance of the MM 0038. The<br />
results of these investigations are discussed in the following section.<br />
A number of possible sources of error inherent in thermal anemometers<br />
must be considered:<br />
lt is obvious that the output of the transducer is a function of the air<br />
velocity and the temperature difference between the air and heated<br />
surface. There are, however, a number of other factors involved, whose<br />
net effect in the ideal case should become negligible. In general, the heat<br />
transfer from the transducer will also depend on the following physical<br />
parameters:<br />
1. The angle of incidence of the flow on the probe<br />
2. The angle of the flow to the direction of gravity<br />
3. Radiatlve heat exchange with the surroundings<br />
4. Air temperature<br />
5. Air pressure<br />
6. Composition of the air<br />
45
Directional sensitivity<br />
There is more to constructing an omnidirectional thermal transducer<br />
than merely giving the heated surface a spherical shape. A spherical<br />
sensor needs some sort of rigid support, which unfortunately degrades<br />
the spherical symmetry. Initially the MM 0038 was designed as a cylindrical<br />
probe, resulting in an unacceptable directional sensitivity. The shape<br />
and Length of the heated surfaces were then gradually changed until an<br />
optimum was reached. Unfortunately the present theoretical basis of the<br />
heat transfer mechanisms involved does not allow calculation of the<br />
optimal shape, so the optimization process had to be performed solely<br />
by experiment.<br />
A special problem to be overcome is caused by the interaction of the<br />
two sensors. When the air strikes the probe head on, warm air from the<br />
upper sensor will cause a small temperature increase in the lower one,<br />
resulting in a significant Increase of the output signal.<br />
The probe Is fitted with a solid sphere, whose size and distance from the<br />
upper sensor are chosen to reduce the air velocity just enough to<br />
compensate for the rise in output voltage. This approach has the<br />
advantage, that the solid sphere produces a more rugged probe tip than<br />
the foam ellipsoid.<br />
The resulting directional sensitivity can be derived from Fig.4, which, for<br />
a number of air velocities, shows the unlinearlzed output from the<br />
MM 0038 as a function of the angle between flow and probe axis. Tha<br />
measurement was made In the Wind Wheel in a horizontal flow. The<br />
transducer was rotated slowly, at a constant angular velocity around a<br />
horizontal axis perpendicular to the transducer axis. This continuous<br />
measurement reveals details of the directional sensitivity, which would<br />
not have appeared in a point-by-point plot. The curves show that the<br />
optimization of the geometrical sensor parameters has resulted in a<br />
remarkably constant sensitivity, except for minor deviations In some<br />
directions.<br />
Although the shaft has a streamlined shape, its "shelter effect" causes<br />
an unavoidable drop In sensitivity for fJ = 180° for all velocities.<br />
Other deviations occur at higher velocities; especially conspicuous Is a<br />
narrow peak, which is obs·erved for a direction almost transverse to the<br />
probe axis. This peak and other fine structure details of the sensitivity<br />
curves are highly reproducible for different transducers. Its exact nature<br />
Is unknown, but it Is probably caused by a shift in the flow pattern<br />
46
Volt<br />
Transducer output voltage<br />
150 cm/s<br />
100<br />
80<br />
20<br />
+---~--r---~--r-~r-~~--r---r---+---r---~--+-~8<br />
0 15 30 45 60 75 90 105 120 135 150 165 180" Yaw 'angle<br />
Head on Transverse From rear /J504S2<br />
Fig. 4. Directional sensitivity. Rotation about an axis perpendicular to the<br />
probe's axis<br />
around the ellipsoids. Due to the very narrow solid angle In which this<br />
phenomenon occurs, it can only be observed in a completely turbulencefree<br />
air flow, and will therefore not reduce accuracy of indoor air velocity<br />
measurements. lt must, however, be emphasized, that the transducer<br />
should not be tested or recallbrated in an air flow in this particular<br />
direction.<br />
Calibration during manufacture Is performed In the Wind Wheel by<br />
making a fine adjustment of the sensor temperature difference. The<br />
velocity is 0,40 m/s, which is in the mid range of the specified velocity<br />
range and the yaw angle is 75°, which Is on a flat part of the sensitivity<br />
curve.<br />
Fig.4 also gives an idea of the nonllnearlty of the calibration curve. The<br />
calibration curve stored In a PROM In the 1213 was determined as an<br />
average for a large number of transducers. The variations in calibration<br />
47
curve for different transducers are, however, extremely small within the<br />
specified velocity range.<br />
The rotational symmetry of the transducer is perfect: there is no measurable<br />
change in transducer response when it is rotated about the probe<br />
axis in a steady air flow. ·<br />
Influence of Gravity<br />
At very low air velocities the heated ellipsoid will create a slow upward<br />
air flow. This natural convection will disturb the flow to be measured and<br />
will depend on the angle between the two flows. How this phenomenon<br />
affects accuracy can be seen from the results of a worst case measurement<br />
shown in Fig.5. The displayed air velocity for vertical flow is<br />
compared with the correct values for horizontal flow. The yaw angle is<br />
75° In all cases.<br />
Flow direction<br />
Displayed value, cm/s<br />
Horizontal 5 7 10 20 40 80<br />
Upwards 7 9 11 20 40 80<br />
Downwards 0 3 8 19 40 80<br />
Fig. 5. Transducer response for vertical air flow<br />
T00719GBO<br />
A lower probe temperature will reduce the deviations caused by natural<br />
convection, but it will increase the demands on the electronic circuit and<br />
on the long term stability of the probe resistors. A probe temperature<br />
difference of 13°C was chosen as a compromise between these contradictory<br />
demands.<br />
Influence of Thermal Radiation<br />
Due to the symmetrical construction of the MM 0038 it is intrinsically<br />
insensitive to thermal radiation: Since the two ellipsoids are identical,<br />
the radiation will induce the same temperature shift in each. There may,<br />
however, be small differences between the two ellipsoids, originating<br />
from the manufacturing process. These may cause some sensitivity to<br />
thermal radiation. By way of example, an infrared radiation field with a<br />
radiant temperature 10°C higher or lower than the air temperature will<br />
cause a deviation in displayed air velocity of less than 0,01 m/s. In<br />
practice this error is negligible.<br />
The white reflecting colour of the probe makes it insensitive to radiation<br />
in the visible and near-infrared region.<br />
48
Influence of Air Temperature<br />
At first sight it may seem difficult to make a thermal anemometer probe<br />
insensitive to ambient air temperature : The resistance of the nickel<br />
resistor over which the output voltage is measured is highly temperature<br />
dependent and so are the characteristics of the air, which govern heat<br />
transfer: thermal conductivity, specific heat capacity and viscosity. Also<br />
the radiative heat loss, which is a significant part of the total heat<br />
transfer, varies rapidly according to the Stefan-Boltzmann law. However,<br />
the transducer response can be made independent of the ambient<br />
temperature if the sensor temperature difference is not constant, but has<br />
a small decrease with Increasing air temperature. This decrease is<br />
controlled by a fixed resistor inserted in series with the unheated sensor.<br />
The value of this resistor is determined by experiment, and is selected to<br />
give the transducers the same response at 10°C and 35°C. The specified<br />
accuracy applies to the range 5°C- 40°C. Outside this range a rapidly<br />
decreasing accuracy must be expected, due to the nonlinearity of heat<br />
transfer.<br />
Fig. 6. An experiment with the Wind Wheel In a vacuum chamber tor<br />
measuring the air pressure correction<br />
49
Influence of Air Pressure<br />
The heat transfer from the probe will also depend on the air density and<br />
consequently on barometric pressure. The daily variations in barometric<br />
pressure at sea level are of no Importance, but if, for Instance, the<br />
instrument is used on locations in the mountains or in aircraft a significant<br />
drop in air pressure should probably be taken into account.<br />
The effect on the MM 0038 of varying air pressure has been measured<br />
using the Wind Wheel. The Danish lowland doesn't offer many opportunities<br />
to test the effect of changing altitudes on measurements, so an<br />
experiment was performed in a large vacuum chamber, shown In Fig.6.<br />
The results of this experiment are listed in a correction table (Fig.7),<br />
which shows that at altitudes higher than approx. 1 000 m above sea level<br />
6v [cm/s]<br />
36 ft/mln<br />
Correction to be added to the displayed air velocity<br />
34<br />
32<br />
Height and<br />
air pressure<br />
60<br />
30<br />
28<br />
26<br />
50<br />
24<br />
22<br />
40<br />
20<br />
18<br />
18<br />
30<br />
14<br />
eo 100 120 140 160 180<br />
0<br />
0 10 20 30 40 50 60 70 80 90<br />
200 rt/mln<br />
100 cm/s<br />
851U51<br />
Fig. 7. Air pressure correction for the Air Velocity Transducer Type<br />
MM0038<br />
50
corrections must be applied to the measured value in order to obtain<br />
true values for the air velocity.<br />
However, the displayed air velocity is actually a measure of the cooling<br />
effect of the draught. If the purpose of the measurement is to determine<br />
this, the displayed value should not be corrected, even at high altitudes.<br />
Influence of Humidity<br />
lt is reasonable to assume that the (physical) characteristics of atmospheric<br />
air depend on its composition. The only c~nstituent of atmospheric<br />
air, whose amount can vary significantly is water vapour. The change<br />
in output from the MM 0038 was measured as a function of a change in<br />
water vapour pressure. At an air velocity of 1 m/s it was found that there<br />
will be a decrease of 1 cm/s for an increase in water vapour pressure of<br />
1 kPa. This change of response is of no practical importance. However,<br />
to obtain the highest possible accuracy, humidity and pressure corrections<br />
are made when the transducers are calibrated, so they will measure<br />
correctly at a water vapour pressure of 1 ,2 kPa and an air pressure of<br />
1013mb. At 20°C this water vapour pressure is the equivalent of a<br />
relative humidity of 50%.<br />
The Step Response of the MM 0038<br />
The ability of the MM 0038 to detect rapid variations in air velocity has<br />
been determined by measuring how the transducer responds to a sudden<br />
change in air velocity. The experiment was performed with the transducer<br />
traversing inside a closed box with still air, driven by a servo motor.<br />
As an example, Flg.8 shows the output from the Indoor Climate Analyzer<br />
during a sudden acceleration of the transducer from 8cm/s to 42cm/s. lt<br />
can be seen that the time to reach 90% of the step change is approximately<br />
0,2s.<br />
The step response time is actually somewhat shorter, due to the finite<br />
acceleration in this experiment. The stepwise change in output voltage is<br />
caused by the digitizing of the signal, and the noise is caused by small<br />
fluctuations in transducer velocity.<br />
When a step change in air velocity is measured, all hot film probes tend<br />
to reach the final output voltage very slowly. This phenomenon Is caused<br />
by temperature changes in the substrata. In the MM 0038 this is minimized<br />
by using a substrata with a very low thermal conductivity and heat<br />
capacity.<br />
51
Velocity<br />
v [cm/s]<br />
50<br />
40<br />
30<br />
I<br />
10<br />
0<br />
0<br />
Time<br />
2 3 sec.<br />
..,..,<br />
Fig. B. A step response curve for the MM 0038<br />
Handling of the Velocity Probe<br />
Due to Its special design, the MM 0038 is far more resistant to mechanical<br />
hazards than current thermal anemometers. lt should nevertheless be<br />
handled as a precision Instrument. This means in practice, that it may be<br />
damaged if it Is accidentally dropped on the floor or If the ellipsoids are<br />
struck by sharp objects.<br />
Concluding remarks on Accuracy<br />
The Investigations of error sources described above show that the main<br />
contribution to the measuring error of the MM 0038 is caused by the<br />
directional sensitivity and to some extent by the natural convection. All<br />
other sources of error are of minor Importance. A better accuracy than<br />
specified can be obtained If the direction of the air flow can be determined,<br />
e.g. by observing smoke. However, In practice this Is not very<br />
useful: One reason Is, that the direction of the air velocity generally<br />
varies appreciably during the time needed to obtain an accurate evaluation<br />
of the air velocity. The other reason is, that the specified accuracy.<br />
Is quite sufficient for indoor climate investigations.<br />
52
(Continued from cover page 2)<br />
PREVIOUSLY ISSUED NUMBERS OF<br />
BR0EL & KJ-'ER TECHNICAL REVIEW<br />
4-1978 Reverberation Process at Low Frequencies.<br />
3-1978 The Enigma of Sound Power Measurements at Low Frequencies.<br />
2-1978 The Application of the Narrow Band Spectrum Analyzer Type<br />
2031 to the Analysis of Transient and Cyclic Phenomena.<br />
Measurement of Effective Bandwidth of Filters.<br />
1-1978 Digital Filters and FFT Technique in Real-time Analysis.<br />
4-1977 General Accuracy of Sound Level Meter Measurements.<br />
Low Impedance Microphone Calibrator and its Advantages.<br />
3-1977 Condenser Microphones used as Sound Sources.<br />
2-1977 Automated Measurements of Reverberation Time using the Digital<br />
Frequency Analyzer Type 2131.<br />
Measurement of Elastic Modulus and Loss Factor of PVC at High<br />
Frequencies.<br />
1-1977 Digital Filters in Acoustic Analysis Systems.<br />
An Objective Comparison of Analog and Digital Methods of Real<br />
Time Frequency Analysis.<br />
4-1976 An Easy and Accurate Method of Sound Power Measurements.<br />
Measurement of Sound Absorption of rooms using a Reference<br />
Sound Source.<br />
SPECIAL TECHNICAL LITERATURE<br />
As shown on the back cover page, Bri.iel & Kjoor publish a variety of<br />
technical literature which can be obtained · from your local B & K<br />
representative.<br />
The following literature is presently available:<br />
Mechanical Vibration and Shock Measurements<br />
(English), 2nd edition<br />
Acoustic Noise Measurements (English), 3rd edition<br />
Architectural Acoustics (English)<br />
Strain Measurements (English, German)<br />
Frequency Analysis (English)<br />
Electroacoustic Measurements (English, German, French, Spanish)<br />
Catalogs (several languages)<br />
Product Data Sheets (English, German, French, Russian)<br />
Furthermore, back copies of the Technical Review can be supplied as<br />
shown in the list above. Older issues may be obtained provided they are<br />
still in stock.<br />
Printed in Denmark by NEerum Offset
Bruel & Kjcer<br />
DK-2850 NJERUM. DENMARK· Telephone: + 45 2 80 05 00 ·Telex; 37316 bruka dk