Microsoft Word - Teil_1.doc - Helmholtz-Zentrum Geesthacht
Microsoft Word - Teil_1.doc - Helmholtz-Zentrum Geesthacht
Microsoft Word - Teil_1.doc - Helmholtz-Zentrum Geesthacht

You also want an ePaper? Increase the reach of your titles
YUMPU automatically turns print PDFs into web optimized ePapers that Google loves.
GeNF – Experimental Report 2008<br />
<strong>Geesthacht</strong> Neutron Facility<br />
Editors:<br />
P. K. Pranzas<br />
M. Müller<br />
R. Willumeit<br />
A. Schreyer<br />
ISSN 0344-9629<br />
GKSS 2009/2
GKSS 2009/2<br />
GeNF – Experimental Report 2008<br />
Editors:<br />
P. K. Pranzas<br />
M. Müller<br />
R. Willumeit<br />
A. Schreyer<br />
(Institute of Materials Research)<br />
GKSS-Forschungszentrum <strong>Geesthacht</strong> GmbH • <strong>Geesthacht</strong> • 2009
Die Berichte der GKSS werden kostenlos abgegeben.<br />
The delivery of the GKSS reports is free of charge.<br />
Anforderungen/Requests:<br />
GKSS-Forschungszentrum <strong>Geesthacht</strong> GmbH<br />
Bibliothek/Library<br />
Postfach 11 60<br />
21494 <strong>Geesthacht</strong><br />
Germany<br />
Fax.: +49 4152 87-1717<br />
Als Manuskript vervielfältigt.<br />
Für diesen Bericht behalten wir uns alle Rechte vor.<br />
ISSN 0344-9629<br />
GKSS-Forschungszentrum <strong>Geesthacht</strong> GmbH · Telefon (04152) 87-0<br />
Max-Planck-Straße 1 · 21502 <strong>Geesthacht</strong> / Postfach 11 60 · 21494 <strong>Geesthacht</strong>
GKSS 2009/2<br />
GeNF – Experimental Report 2008<br />
Philipp Klaus Pranzas, Martin Müller, Regine Willumeit, Andreas Schreyer (Editors)<br />
338 pages<br />
Abstract<br />
At the <strong>Geesthacht</strong> Neutron Facility GeNF about 182 experiments were performed in 2008 by<br />
GKSS and by or for external users, partners or contractors. In most cases the measurements<br />
were performed and analysed in cooperation by the guests, by GKSS staff or by the permanent<br />
external user group staff. The activities, which are based on a proposal procedure and on the<br />
in house R&D program, are reported in 76 contributions in the present annual experimental<br />
report for the year 2008. The contributions may contain several combined experiments.<br />
During 2008 the GKSS research reactor FRG-1 achieved an operation time of 175 days at<br />
the full 5 MW reactor power providing a neutron flux of ca. 1.4 ·10 14 thermal neutrons/cm 2 s.<br />
The focus of the in house R&D work at GeNF instruments in 2008 was the characterisation<br />
of nanostructures in engineering materials, the analysis of stresses and textures in welds<br />
and technical structures at SANS-2, DCD, ARES-2 and TEX-2, the structural investigation of<br />
hydrogen containing substances such as polymers, colloids and biological macromolecules<br />
at SANS-1 as well as the characterisation of magnetic thin films at NeRo, PNR, POLDI and<br />
RÖDI. The modern experiment control hardware (e.g. sample environments, like magnets,<br />
cryostats or furnaces) and software based on LabView was continuously improved on all<br />
instruments.<br />
In the appendices I and II the experimental reports of the GKSS outstation at the FRM II are<br />
attached as well as of the GKSS outstation at DESY. The massive activity at the FRM II outstation<br />
is documented by the increasing number of REFSANS reports, accumulated to nine.<br />
Three reports show the activities of GKSS in the field of texture measurement at the instrument<br />
STRESS-SPEC. The instrument HARWI II at the synchrotron storage ring DORIS III at DESY<br />
is accepted very well by the community and is heavily overbooked in all fields (tomography,<br />
diffraction, etc.). After an 8-month shutdown period for an upgrade in the frame of the<br />
PETRA III project, user operation at DORIS III was resumed on 22 nd of September 2008.<br />
The engagement of GKSS at the new PETRA III storage ring at DESY is demonstrated in<br />
the reports about the High Energy Materials Science (HEMS) beamline and the Imaging<br />
beamline at Petra III.<br />
Jahresbericht 2008 über die Experimente an GeNF<br />
Zusammenfassung<br />
An der <strong>Geesthacht</strong>er Neutronenforschungseinrichtung GeNF wurden von GKSS und von oder<br />
für externe Nutzer, Partner oder Auftraggeber etwa 182 Experimente in 2008 durchgeführt. In<br />
den meisten Fällen wurden die Messungen gemeinschaftlich von den Gastwissenschaftlern
und GKSS-Personal vorgenommen und ausgewertet. Die Experimente, die in der Regel<br />
über das Antragsverfahren und über das GKSS-eigene F&E-Programm abgewickelt wurden,<br />
werden in diesem Jahresbericht in Form von 76 Experimentierberichten dargestellt. Dabei<br />
können die Berichte einzelne Experimente oder auch mehrere zusammengefasst beschreiben.<br />
Während 2008 erreichte der Forschungsreaktor FRG-1 175 Volllasttage bei 5 MW und bei<br />
einem Fluss von 1,4 ·10 14 thermischen Neutronen je cm 2 und s.<br />
Der Schwerpunkt der GKSS-eigenen Forschungsarbeiten lag in 2008 im Bereich der Charakterisierung<br />
von Nanostrukturen in Werkstoffen, der Analyse von Eigenspannungen und<br />
Texturen in Schweißverbindungen und technischen Strukturen an SANS-2, DCD, ARES-2 und<br />
TEX-2, im Bereich der Strukturanalyse von wasserstoffhaltigen Substanzen wie Polymere,<br />
Kolloide und Biomolekülen an SANS-1 sowie im Bereich der Charakterisierung magnetischer<br />
Schichtstrukturen an NeRo, PNR, POLDI und RÖDI. An den Instrumenten werden ständig<br />
neue Probenumgebungen (Magnete, Kryostate, Öfen, usw.) entwickelt und eingesetzt sowie<br />
die auf Labview basierende moderne und nutzerfreundliche Steuersoftware angepasst und<br />
verbessert.<br />
In den Anhängen I und II werden die Experimentberichte der GKSS-Außenstelle am FRM II<br />
sowie der GKSS-Außenstelle bei DESY aufgelistet. Die massive Aktivität an der FRM II-<br />
Außenstelle wird durch die steigende Anzahl an REFSANS-Reports dokumentiert, die sich nun<br />
auf neun beläuft. Drei Berichte zeigen die Aktivitäten von GKSS im Bereich der Texturmessung<br />
am Instrument STRESS-SPEC. Das Instrument HARWI II am Synchrotronspeicherring<br />
DORIS III bei DESY ist bei der Nutzergemeinde sehr begehrt und ist in allen Bereichen (Tomographie,<br />
Diffraktion, etc.) stark überbucht. Nach einem 8-monatigen Shutdown für ein Upgrade<br />
im Rahmen des PETRA III Projekts wurde der Nutzerservice an DORIS III am 22. September<br />
2008 wieder aufgenommen. Das Engagement von GKSS am neuen PETRA III Speicherring<br />
am DESY ist in den Berichten über die High Energy Materials Science (HEMS) Beamline und<br />
die Imaging beamline an Petra III dargestellt.
CONTENTS<br />
Preface<br />
− GeNF Operation<br />
− Operation of FRG-1<br />
− GeNF Instruments (overview)<br />
SANS-1 19<br />
S. Kichanov, D. Kozlenko, A. Ivan’kov, A. Belushkin<br />
The studies of nanoparticles in the GeO 2 -Ag and GeO 2 -Eu 2 O 3 -Ag xerogels 21<br />
C. Hoffmann, A. Blume<br />
Small-angle neutron scattering of membrane solubilisation by polysorbates 23<br />
M. Knaapila, A. Monkman<br />
SANS studies of polyfluorenes and ladder polymers in solution 25<br />
V.M. Nadutov, S.G. Kosintsev<br />
Small-angle polarized neutron scattering in anti-Invar Fe-Ni-C alloy under magnetic field 27<br />
S. Rangelov, S. Halacheva<br />
Self-Assembly of Polyglycidol-Based Analogues to Pluronics at Low Temperatures 29<br />
A. Meister, S. Drescher, A. Blume<br />
Small-Angle Neutron Scattering of Bolaform Hydrogelators (III) 33<br />
A. Angelova, R. Mutafchieva, G. Le Bas, V. Iordanova<br />
Intermediates during the Phase Transition from a Lipid Cubic Phase to Sponge and<br />
Lamellar Mesophases 37<br />
C. Garvey<br />
Polymer morphology and the effects of annealing on polyhydroxy butyrate/ethyl cellulose<br />
blends 39<br />
M.V. Avdeev, L.Vékás, A.V. Feoktystov<br />
SANS contrast variation on water-based magnetic fluids stabilized by different<br />
monocarboxylic acids 43<br />
L. Vekas, A. Han, I. Morjan, M.V. Avdeev, A.V. Feoktystov<br />
SANS study of ferrofluids with iron/iron oxide nanoparticles obtained by laser pyrolysis 45<br />
M. Annaka, T. Matsuda, R. Motono<br />
Salt Effect of Complex Formation of Polyelectrolyte and Oppositely Charged Surfactant 47<br />
P. Kopcansky, M.V. Avdeev, M. Koneracka, A.V. Feoktystov<br />
Contrast variation in small-angle neutron scattering by water-based ferrofluid with<br />
surfactant/polymer stabilization 49
J. Preu, T. Gutberlet, T. Heimburg<br />
The influence of angiotensin II on structural changes in lipid dispersions 51<br />
A. Zou<br />
The Study of Interaction between Surfactin and Hemoglobin by SANS 53<br />
D. Lin, V. Abetz, A. Boschetti<br />
A SANS investigation of Polycarbonate/Poly(styrene-co-acrylonitrile) blends 55<br />
SANS-2<br />
57<br />
C.M. Papadakis, A. Kulkarni, J. Adelsberger<br />
Micellar solutions from thermo-responsive triblock copolymers studied using SANS 59<br />
P. Albers, M. Hagemann, C. Schulze Isfort<br />
In Vitro-Studies of Nanoparticle Dispersions 61<br />
T. Cosgrove, B. Foster, M. Sharp, B. Cheesman, V. Gibson<br />
Study of novel graft copolymer systems and their solubilisation behaviour 63<br />
T. Cosgrove, H. Musa, B. Cheesman<br />
Synthesis and characterisation of linear and six-arm star poly (styrene-sulfonate) (PSSNa) 67<br />
M. Kumpugdee Vollrath, P. Sriamornsak, K. Burapapadh<br />
Structure of itraconazole nanoparticles as a delivery system 69<br />
M. Sharp, A. Schreyer<br />
Investigation of swollen Pluronic micelles 73<br />
M. Sharp, A. Schreyer<br />
A study of the phase behaviour of reverse Pluronics 75<br />
F. Fally, M. Bichler, Irena Drevenšek-Olenik, A. Zeilinger<br />
Neutron diffraction from gratings in holographic polymer dispersed liquid crystals 79<br />
V.K. Ivanov, G.P. Kopitsa, A.E. Barantchikov<br />
Anomalous changes of metal hydroxides fractal properties at the point of zero charge 83<br />
A.E. Barantchikov, G.P. Kopitsa, V.K. Ivanov<br />
Influence of ultrasonication on nanoscale heterogeneous systems of metal hydroxides 87<br />
H. Schmidt, W. Gruber<br />
Domain Growth and precipitation in amorphous Si-C-N 93<br />
A. Michels, M. Elmas, F. Döbrich, J. Kohlbrecher, R. Birringer<br />
Dipole-field-induced spin disorder in nanoporous inert-gas condensed iron 97<br />
F. Döbrich, A. Michels, H. Eckerlebe, A. Ferdinand, J. Kohlbrecher, R. Birringer<br />
Magnetic microstructure of nanocrystalline gadolinium 99
A. Ulbricht, C. Heintze, F. Bergner<br />
SANS investigation of irradiation-induced phase separation in binary Fe-Cr-alloys 101<br />
N. van Dijk, S. He<br />
In-situ SANS measurements during self healing in deformed Fe-Cu alloys 103<br />
P. Staron, E. Eidenberger, M. Schober, A. Schreyer<br />
Test of a new fast furnace for use in a 2 T electromagnet up to 1000 °C 105<br />
E. Eidenberger, M. Schober, E.Stergar, P. Staron, H. Clemens<br />
SANS and 3DAP as methods to study precipitates in a Fe-Co-Mo alloy 107<br />
M. Schober, E. Eidenberger, C. Lerchbacher, P. Staron, H. Clemens<br />
In-situ SANS characterisation of the precipitation behaviour of Fe-Cu and Fe-Ni-Al 109<br />
R. Gilles, D. Mukherji<br />
In situ investigation on the evolution of nano-sized precipitates in a tungsten rich Ni-alloy 111<br />
S. Xu, M. Sharp, P. Staron<br />
Small-angle scattering from a creep tested Mg alloy 113<br />
W.V. Vaidya, H. Eckerlebe, P. Staron, N. Huber<br />
In-situ study of the formation of nano-precipitates in AA6xxx alloys 115<br />
S. Grigoriev, V. Dyadkin, Y. Chetverikov, D. Lamago, D. Menzel<br />
Spin chirality of the helix in Mn 1-y Fe y Si 117<br />
S.V. Grigoriev, N. Grigoryeva, K. Napolskii, A.V. Syromyatnikov, A. Chumakov<br />
Thickness and wavelength dependence of the SANS intensity from highly-ordered<br />
Al 2 O 3 matrix 121<br />
S. Grigoriev, V. Dyadkin, R. Sadykov<br />
Mn 0.95 Fe 0.05 Si in high pressure cell 125<br />
S. Grigoriev, V. Dyadkin, D. Menzel<br />
K-flop transition in Fe 0.65 Co 0.35 Si 127<br />
S.V. Grigoriev, V.V. Piyadov<br />
The study of the three-spin correlations in the single crystal Ni by small angle scattering<br />
of polarized neutrons 131<br />
S.V. Grigoriev, N. Grigoryeva, K. Napolskii, A. Chumakov<br />
Polarized SANS study of highly-ordered massives of the magnetic Ni nanowires<br />
embedded into Al 2 O 3 matrix 135<br />
S.V. Grigoriev, N. Grigoryeva, K. Napolskii, A. Chumakov<br />
Polarized SANS study of massives of the Ni nanowires in Al 2 O 3 matrix in the field<br />
parallel to long wire axis 139
G.P. Gordeev, V.N. Zabenkin, S.V. Grigoriev, L.A. Axelrod, I.M. Lazebnik,<br />
V.A. Dyadkin, V.V. Piyadov<br />
Static properties of the spin-glass like system ( Pd 0.984 Fe 0.016 ) 0.95 Mn 0.05 from small<br />
angle scattering of polarized neutrons 143<br />
DCD 147<br />
P. Staron, W. Knabl, M. Sharp, A. Schreyer<br />
Characterization of particle-strengthened Molybdenum alloys 149<br />
M. Sharp, A. Schreyer<br />
Investigation of swollen Pluronic micelles at ultra-small angles 151<br />
PNR 153<br />
N.A. Grigoryeva, E.A. Dyadkina, L.V. Lutsev, D. Lott, A.A.Vorobiev, S.V. Grigoriev<br />
Polarized neutron reflectometry on the interface of the heterostructure SiO 2 (Co)/Si 155<br />
H. Schmidt, E. Hüger, S. Chakravarty, U. Tietze, D. Lott<br />
Self-diffusion in Single Crystalline Germanium 159<br />
H. Schmidt, S. Chakravarty, E. Hüger, U. Tietze, D. Lott<br />
Self-Diffusion in Nano-crystalline Fe 163<br />
H. Schmidt, E. Hüger, U. Tietze, D. Lott<br />
Neutron Reflectometry on Si x C y N z isotope multilayers 167<br />
NeRo 169<br />
F. Klose, N. Loh, A. Stampfl, R. Stamps, T. Saerbeck, R. Robinson, D. Lott<br />
Influence of Spin-Glass ordering on the Giant Magneto-Resistance<br />
in Co/CuMn Multilayers 171<br />
D. Lott, G.J. Mankey, F. Klose, U. Tietze, A. Schreyer<br />
Polarized Neutron Reflectivity Studies on a FM/AF FePt 3 multilayer grown on Al 2 O 3 175<br />
D. Lott, U. Tietze, A. Schreyer<br />
Coupling of the Fe and Cr layers in Fe/Cr multilayer examined by polarized neutron<br />
reflectivity studies 179<br />
Y. Chetverikov, S. Grigoriev, D. Lott<br />
Magnetic field – Temperature phase diagram of the Dy/Y multilayer system 183<br />
Y. Chetverikov, S. Grigoriev, D. Lott<br />
Field-induced chirality of the spiral spin structure in the [Dy (3nm) /Y (1.5nm) ] 150 multilayer system 187<br />
R. Willumeit, V. Haramus, F. Feyerabend, A. Schuster, S. Linser, A. Schreyer, D. Lott<br />
Variation of lipid layer thickness and adhesion of protein depending of time of exposition<br />
in water and growth medium 191
W. Kreuzpaitner, D. Lott, A. Schreyer,<br />
Variation of lipid layer thickness and adhesion of protein depending of time of exposition<br />
in water and growth medium 193<br />
ARES-2 195<br />
J.F. dos Santos, P. Staron, N. Huber<br />
Residual stresses in a friction stir welded dissimilar Fe/Al butt joint 197<br />
W.V. Vaidya, P. Staron, N. Huber<br />
Residual stresses in CT samples with a laser beam weld 199<br />
S. Daneshpour, M. Koçac, P. Staron, N. Huber<br />
Residual stress in laser spot welded overlap joints of steel sheets 201<br />
Su Xu, P. Staron<br />
Residual stresses in a Mg alloy produced by high pressure die casting 203<br />
J.F. dos Santos, T. Fischer, Y.E. Ma, P.E. Irving, P. Staron, N. Huber<br />
Residual stresses in friction stir welded ESET fatigue test specimens 205<br />
J.F. dos Santos, T. Fischer, Y.E. Ma, P.E. Irving, P. Staron, N. Huber<br />
Residual stresses in friction stir welded CT fatigue test specimens 207<br />
D. Schnubel, M. Koçac, P. Staron, N. Huber<br />
Residual stress control in laser welded Al T-joints by mechanical tensioning 209<br />
TEX-2 211<br />
T. Lychagina, D. Nikolayev, H.-G. Brokmeier<br />
Texture investigation of magnesium alloy MA2-1 after ECAP 213<br />
M.Y. Zheng, H. Chang, W.M. Gan, H.-G. Brokmeier<br />
Texture in the accumulative roll bonding (ARB) processed pure Mg 217<br />
M.Y. Zheng, J.L. Wang, H.-G. Brokmeier, B. Schwebke, W.M. Gan<br />
Texture evolution in SiCp/AZ91 composite processed by ECAP 223<br />
H.-G. Brokmeier, M.Y. Zheng, W.M. Gan, E. Maawad<br />
Correlation of texture and damping properties in bar extruded Mg-AZ80 225<br />
M.Y. Zheng, H. Chang, W.M. Gan, H.-G. Brokmeier<br />
Evolution of texture in Mg/Al multilayed composite sheet processed by accumulative<br />
roll bonding 227<br />
G. Fan, M.Y. Zheng, K. Wu, W.M. Gan, H.-G. Brokmeier<br />
Effect of texture on the microplasticity of the ECAPed pure Mg 231
E. Maawad, L. Wagner, H.-G. Brokmeier, W.M. Gan, B. Schwebke<br />
Measurement of Textures in Ti-Alloys 235<br />
W. Strotzki, R. Chulist, W.M. Gan, B. Schwebke, H.-G. Brokmeier<br />
Cast and rolling textures of NiMnGa alloys 239<br />
R.E. Bolmaro, H.-G. Brokmeier, B. Schwebke, W.M. Gan<br />
Texture Characterization of CO 3 Ca Biological Samples 243<br />
R.E. Bolmaro, H.-G. Brokmeier, B. Schwebke, W.M. Gan<br />
Texture Characterization of Pure Sn Deformed by ECAE 245<br />
POLDI 247<br />
G. Mankey, D. Lott, J. Fenske, A. Schreyer<br />
Investigation of temperature behaviour of the magnetic phase transition<br />
in Fe 50 Pt 50-x Rh x thin film 249<br />
GENRA-3 253<br />
P.K. Pranzas, O. Metz, M. Dornheim, H.-W. Schmitz, R. Bormann, A. Schreyer<br />
Neutron Radiography Characterization of Hydride Tanks 255<br />
Note: EU Support 257<br />
APPENDIX I 259<br />
Reports of experiments carried out at the instruments REFSANS and<br />
SRESS-SPEC at the GKSS outstation at the Forschungsneutronenquelle<br />
Heinz Maier-Leibnitz (FRM II) in Garching in support of internal and external users.<br />
APPENDIX II 293<br />
Reports of experiments carried out at the GKSS outstation at DESY in Hamburg<br />
in support of internal and external users.
PREFACE<br />
GeNF Operation<br />
The <strong>Geesthacht</strong> Neutron Facility (GeNF) is operated as an open facility for external users for<br />
about 2/3 of the available beam time and it is used for GKSS in house research within its<br />
materials science programme for the remaining 1/3. The external users come either from<br />
national and international scientific research institutions, universities and industry, or they<br />
own and operate experiments at GeNF as permanent external partners.<br />
The beam time allocations for GeNF instruments are established on the basis of a continuous<br />
proposal procedure which can react in a flexible and fast way on new proposals. Proposals<br />
can be submitted at any time. In 2008 182 experiments were performed at GeNF by or for<br />
external users, partners or contractors as well as for the in house research programmes.<br />
A part of these activities – mainly the part of external use based on proposals – is reported in<br />
the present annual experimental report for the year 2008. In many cases several experiments<br />
are concentrated in one experimental report.<br />
Operation of FRG-1<br />
In 2008 the total FRG operation time was 181 days providing neutrons, of these it ran for<br />
175 days at its full power of 5 MW providing a neutron flux of ca. 1.4 · 10 14 thermal<br />
neutrons/cm 2 s.<br />
GeNF Instruments<br />
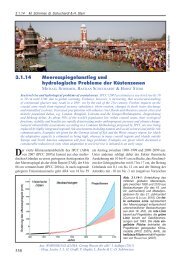
The current set of instruments at GeNF is shown in figure A and listed in table A. The available<br />
sample environment equipment is listed in table B.<br />
In 2008 the modern experiment control hardware and software based on LabView was continuously<br />
improved on all instruments. The focus of the GKSS in-house research at GeNF is<br />
the characterisation of nanostructures, textures and residual stresses in materials at the<br />
instruments SANS-2, DCD, ARES-2 and TEX-2, the structural investigation of hydrogen<br />
containing substances such as polymers, colloids and biological macromolecules at SANS-1<br />
as well as the characterisation of magnetic and polymer thin films at PNR, NeRo, POLDI and<br />
RÖDI.<br />
At the GKSS outstation at the Heinz Maier-Leibnitz (FRM II) reactor the neutron reflectometry<br />
and small-angle scattering and instrument REFSANS opens new and unique possibilities for<br />
research into the molecular architecture and function of complex boundary layers and surfaces<br />
of materials which are of increasing significance in technology and biotechnology.<br />
GKSS also contributes to the construction of the new SANS-1 instrument at FRM II together<br />
with the Technical University of Munich (TUM). Furthermore, GKSS, HMI and TUM operate<br />
the residual stress and texture instrument STRESS-SPEC together at the FRM II. More<br />
details can be found in the reports in appendix I.<br />
The outstation of GKSS at DESY in Hamburg provides instrumentation for investigating engineering<br />
materials and biomaterials with imaging and diffraction techniques. At the HARWI II<br />
beamline at the synchrotron storage ring DORIS III 38 experiments in the fields tomography,<br />
residual stress and texture research were performed. HARWI II is accepted very well by the<br />
community and is heavily overbooked in all fields (tomography, diffraction, etc.). Due to an<br />
8-month shutdown period to upgrade the DESY pre-accelerator chain in the frame of the<br />
PETRA III project, user operation at DORIS III was resumed on 22 nd of September 2008. The<br />
two new beamlines at the new third generation synchrotron source PETRA III at DESY, the<br />
High Energy Materials Science (HEMS) beamline and the Imaging beamline, are currently<br />
under construction. For details see the reports in appendix II.
Figure A: Arrangement of the Instruments at GeNF.
Table A: List of GeNF Instruments.<br />
Instrument Short Instrument Description /Main Tasks Characteristic Data Operator / Local Contact<br />
SANS-1 Small Angle Neutron Scattering using cold<br />
non-polarised/polarised neutrons primarily to investigate<br />
molecular biology, colloids and polymers<br />
SANS-2 Small Angle Neutron Scattering using cold nonpolarised/polarised<br />
neutrons to characterise precipitates,<br />
clusters, interfaces, grain sizes, magnetic structures etc. in<br />
materials (metals, polymers, colloids a.o.)<br />
DCD Double Crystal Diffractometer for ultra small angle neutron<br />
scattering (USANS) using non-polarised cold neutrons to<br />
characterise large creep pores, fatigue and sintering<br />
cavities, precipitates, voids, bubbles, etc. in materials<br />
ARES-2 Diffractometer for the Analysis of REsidual Stresses in<br />
specimens with technical sizes (up to 200 kg) using thermal<br />
non-polarised neutrons<br />
NeRo Neutron Reflectometer to study magnetic and other<br />
surfaces, layers, thin films and membranes using cold<br />
non-polarised/polarised neutrons with high resolution<br />
max= 1·10 6 cm -2 s -1 (coll.2 m,<br />
=0.82 nm)<br />
/ = 0.1 ( = 0.82 nm)<br />
Particle sizes: 2–80 nm<br />
2-D position-sens. 3 He-detector<br />
max = 2·10 7 cm -2 s -1 (coll.1 m,=0.5nm)<br />
/ = 0.1<br />
Particle sizes: 1–100 nm<br />
2-D position-sens. 3 He-detector<br />
550 cm -2 s -1<br />
/ = 1·10 -5 ( = 0.443 nm)<br />
Particle sizes: 30 nm–24 m<br />
3 x 3 He- detectors<br />
Φ 3·10 5 cm -2 s -1 (perfect Si-monochr.)<br />
d/d 4·10 -3<br />
take-off angle: 57°–120°<br />
2-D position-sens. 3 He-detector<br />
GKSS/<br />
Regine Willumeit<br />
Vasyl Haramus<br />
GKSS/<br />
Melissa Sharp<br />
Helmut Eckerlebe<br />
GKSS/<br />
Melissa Sharp<br />
GKSS/<br />
Peter Staron<br />
= 5·10 4 cm -2 s -1 (standard collimation) GKSS/<br />
/ = 0.02 ( = 0.433 nm)<br />
Dieter Lott<br />
2-D position-sens. 3 He-detector,<br />
3 He- pencil counter<br />
PNR Polarised Neutron Reflectometer for the study of magnetic<br />
and non-magnetic surfaces, layers, thin films and<br />
membranes using cold non-polarised or polarised neutrons<br />
with high flux<br />
nonpol = 1·10 5 cm -2 s -1<br />
nonpol / pol = 3 / 1<br />
/ = 0.05 ( 0.635 nm)<br />
2-D position-sens. 3 He-detector<br />
GKSS/<br />
Dieter Lott<br />
Ursula Tietze
Table A: List of GeNF Instruments (continued).<br />
Instrument Short Instrument Description /Main Tasks Characteristic Data Operator / Local Contact<br />
RÖDI X-ray (RÖntgen) DIffractometer to investigate residual<br />
stresses, textures and thin films<br />
Seifert XRD 3003 PTS<br />
Heavy load goniometer<br />
GKSS/<br />
Peter Staron<br />
TEX-2 Four circle neutron TEXture diffractometer to characterise<br />
textures in metallic, ceramic and geologic materials using<br />
thermal non-polarised neutrons<br />
Φ = 0.3–2·10 6 cm -2 s -1<br />
TEXMAT – Technische<br />
take-off angle: 17°–57° (in 10°-steps) Universität Clausthal/<br />
-range: 0.08–0.27 nm<br />
3 Heinz-Günter Brokmeier<br />
He-single detector, 2-D position-sens.<br />
3 He- detector 300 x 300 mm<br />
POLDI POLarised DIffractometer; 3-D depolarisation analysis is<br />
used to investigate magnetic properties and correlations in<br />
magnetic materials; additional time of flight option in nonpolarised<br />
mode<br />
Φmax = 0.8·10 5 cm -2 s -1 (polarized) GKSS/<br />
take-off angle: 10° < 2 M < 65°<br />
Jochen Fenske<br />
-range: 0.1 nm - 0.36 nm<br />
3 He-single detector Dieter Lott<br />
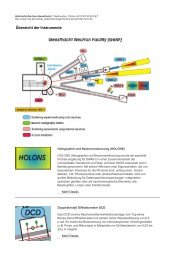
HOLONS HOLOgraphy and Neutron Scattering to investigate the properties<br />
in functional materials of photonics (e.g. photopolymers<br />
and photorefractive crystals) and to study light-induced<br />
changes simultaneously by light and neutron diffraction<br />
GENRA-3 GEesthacht Neutron RAdiography facility for non-destructive<br />
analysis of materials by static and dynamic imaging<br />
holographic setup in SANS-2: angular<br />
resol. 0.01°; angul.setting acc =<br />
0.001° lasers (excitation & diffract.):<br />
Ar + -laser (single&multi line mode: 25<br />
W /visible, 5.5 W / UV), HeNe-lasers<br />
(green, red)<br />
Φtherm / Φepi = 1.4·10 6 / 8·10 3 cm -2 s -1 <br />
image: 15 x 15 to 45 x 45 cm 2<br />
Universities of Vienna and<br />
Osnabrüc/<br />
Romano Rupp<br />
GKSS/<br />
max. size of specimen: 100 x 200 cm 2 P. Klaus Pranzas<br />
Heinz-Werner Schmitz<br />
GBET <strong>Geesthacht</strong>er Boron- capture (Einfang) Therapy originally<br />
designed to study cell cultures in tumours with enriched boron;<br />
now available as a cold neutron irradiation facility<br />
Φ = 1.6·10 8 cm -2 s -1 (m= 0.6 nm)<br />
irrad. area : 30 x 40 mm 2<br />
Em = 2.3 meV<br />
GKSS/<br />
Hans-Ulrich Ruhnau<br />
ICI In Core Irradiation – service for industry and others,<br />
different core positions, pneumatic dispatch system available<br />
Φtherm = 2 to 8·10 13 cm -2 s -1<br />
Φfast = 0.02 to 0.06 Φtherm<br />
max. sample size: 40 mm x 100 mm<br />
GKSS/<br />
Wolfgang Knop
Table B: GeNF Sample Environment.<br />
Instrument<br />
Cryostat Magnets Temp. Conditioning Other Devices<br />
SANS-1<br />
3 He /<br />
4 He – Cryostat: horizontal dilutionrefrigerator<br />
with NMR sample coil and<br />
microwave source: T-range: 120 mK - RT;<br />
NMR: 106 and 16 MHz;<br />
Microwave: tunable: 68 to 74 GHz<br />
sample dimension: 2,8 x 17 x 19 mm 3<br />
(optimum design for NMR coil),<br />
NMR is made for 1 H and 2 H resonance in<br />
2.5 Tesla continuous wave mode;<br />
• electro magnet: 2.5 T heater from 5 to 80 °C<br />
heater from 80 to 200 °C<br />
SANS-2 • several refrigerator cryostats,<br />
temp.-range: 4– 475 K<br />
flexible operation in various instruments<br />
• B-E 25: up to 2 Tesla with closed<br />
cycle refrigerator (T: 8–300 K)<br />
• B-E 15: up to 1.5 Tesla with<br />
closed cycle refrigerator<br />
(T: 4– 475 K)<br />
• B-E 10: up to 1 Tesla with closed<br />
cycle refrigerator (T: 4– 475 K),<br />
alternative furnace (T: 300–900 K)<br />
• superconducting magnets:<br />
up to 5 Tesla with longitudinal<br />
(T: 8–300 K) or<br />
vertical field (T: 4–280 K)<br />
heater (electric) / cooler<br />
(thermostat liquid<br />
circuit):<br />
T-range: -30– 400 °C<br />
vacuum or inert gas<br />
atmosphere<br />
several furnaces<br />
fast oven (temperatures<br />
up to 1000 °C)<br />
– side detector for<br />
measurements at large<br />
angles<br />
– sample container for big<br />
samples<br />
– lasers<br />
– rotating rack<br />
DCD • electro magnet: > 0.9 Tesla heater up to 80 °C – Sample changer with up<br />
to 6 positions<br />
– rotating rack<br />
ARES-2 furnace (up to 700 °C) – Eulerian cradle (with x,<br />
y, z tables), load frame
Table B: GeNF Sample Environment (continued).<br />
Instrument Cryostat Magnets Temp. Conditioning Other Devices<br />
PNR<br />
• refrigerator cryostat Model<br />
Leybold RGD 210, temp.-range: 12–475 K<br />
• refrigerator cryostat Model ARS DE 210<br />
SE, temp.-range: 4–300 K<br />
flexible operation in various instruments<br />
• electro magnet: up to 0.9 Tesla • heater / cooler (thermostat<br />
liquid circuit):<br />
T-range: -30–250 °C<br />
NeRo<br />
TEX-2<br />
POLDI<br />
• refrigerator cryostat Model<br />
Leybold RGD 210, temp.-range: 12–475 K<br />
• refrigerator cryostat Model ARS DE 210<br />
SE, temp.-range: 4–300 K<br />
flexible operation in various instruments<br />
– refrigerator cryostat T > 10 K<br />
– refrigerator cryostat Model Leybold RGD<br />
210, temp.-range: 12–475 K<br />
• electro magnet: up to 0.9 Tesla<br />
• superconducting magnet:<br />
up to 5 Tesla with closed cycle refrigerator<br />
(T: 8–300 K) suitable for<br />
polarised neutrons<br />
DC magnetic field < 160 A/cm<br />
pulsed field < 6.5 kA/cm<br />
• superconducting magnet:<br />
up to 5 Tesla (T: 8–300 K)<br />
• 2 x vacuum furnaces:<br />
T-range: RT – 200 °C<br />
– one especially. for<br />
annealing purposes<br />
under PC control<br />
• heater/cooler (thermostat<br />
liquid circuit):<br />
T-range: -30–250 °C<br />
– 2D-analyser for<br />
measurements of<br />
magnetic diffuse<br />
reflectivity<br />
– loading device:<br />
range of cycling<br />
load:<br />
tension up to 1.5 t,<br />
compression up to<br />
2.0 t,<br />
– sophisticated set<br />
of sample holders
EXPERIMENTAL REPORT<br />
GeNF<br />
SANS-1<br />
Small-angle scattering instrument SANS-1<br />
Short Instrument Description:<br />
The small angle neutron scattering instrument SANS-1 using cold non-polarised/polarised<br />
neutrons serves primarily to investigate molecular biology, colloids and polymers.<br />
Local Contact:<br />
Dr. Regine Willumeit<br />
Phone/Fax : +49 4152 87-1291 / +49 4152 87-1356<br />
e-mail: regine.willumeit@gkss.de<br />
Dr. Vasyl Haramus<br />
Phone/Fax : +49 4152 87-1290 / +49 4152 87-1356<br />
e-mail: vasyl.haramus@gkss.de<br />
Schematic view of SANS-1:<br />
Instrument Details:<br />
Beamline: Beamline 8 – NG-1, radius of curvature R = 1040 m,<br />
cross section 3 x 4 cm 2 , cold neutrons<br />
Monochromator<br />
helical slot selector<br />
Wavelength range behind<br />
0.45 nm;<br />
polariser and selector:<br />
Wavelength resolution<br />
/ = 0.1 (= 0.82 nm)<br />
Length L of collimation:<br />
2 m, 4 m, 6 m, 8 m, 10 m<br />
Flux at specimen: = 0.05–1·10 6 cm -2 s -1<br />
see table<br />
19
Instrument Details (continued):<br />
Range of momentum transfer: 0.05 Q 3 nm -1<br />
Distance sample to detector: 0.7 m d 9.7 m<br />
Detector:<br />
2-dim position-sensitive 3 He-counter<br />
active area:<br />
50 x 50 cm 2<br />
effective pixel size:<br />
0.2 x 0.3 cm 2<br />
background:<br />
1 cps<br />
Polarized target station:<br />
dilution refrigerator (120 mK)<br />
2.5 T C-shaped electro-magnet<br />
microwave emitter (68–74 GHz)<br />
NMR circuit for protons and deuterons<br />
selective nuclear spin depolarisation<br />
Other sample environment thermostat (5 °C to +80 °C and 80 °C to 200 °C)<br />
automatic sample change 10 positions<br />
Flux of non-polarized cold neutrons at the sample position:<br />
length of collimator [m] 2 4 6 8 10<br />
[10 3 n cm -2 s -1 ] (= 0.82 nm) 1000 600 200 120 65<br />
20
EXPERIMENTAL REPORT<br />
GeNF<br />
SANS-1<br />
The studies of nanoparticles in the GeO 2 -Ag and GeO 2 -Eu 2 O 3 -Ag xerogels<br />
Proposer:<br />
Co-Proposer(s):<br />
Experimental Team:<br />
Head of Institute:<br />
Instrument Responsible:<br />
Date(s) of Experiment: 09 th – 14 th September 2008<br />
Sergey Kichanov 1 , 1 FLNP, Joint Institute for Nuclear Research,<br />
Dubna, Russia<br />
Denis Kozlenko 1<br />
Aleksander Ivan’kov 1<br />
Aleksander Belushkin 1<br />
Vasyl Haramus 2 , 2 GKSS Research Centre <strong>Geesthacht</strong>, Germany<br />
Objectives<br />
The considerable attention is directed to the investigation of nanocomposites comprising<br />
particle of noble and rare-earth metals because of the unique optical, photophysical and<br />
catalytic properties of such particles incorporated into a composite matrix was found [1]. The<br />
GeO 2 films comprising Eu 3+ and Ag + ions the colossal (>1000 times) increasing of luminescence<br />
intensity were shown. It’s assumed [2], what silver nanoparticles change the coordination<br />
structure around Eu ions and it affect to luminescence properties this compound.<br />
The proposed project was directed on studies of nanoparticles Eu 2 O 3 , silver and mixed<br />
Eu 2 O 3 -Ag, which forms at annealing in initial xerogels. In particular we aimed at determining<br />
the size distribution of title particles and obtaining some information about its forms at different<br />
annealing temperatures.<br />
Experiment<br />
Four sample-to-detector distances (from 0.7 to 9.7 m) were employed to cover the range of<br />
scattering vectors q from 0.005 to 0.25 Å -1 . The neutron wavelength was 8.1 Å with a wavelength<br />
resolution of 10 % (full-width-at-full-maximum). The samples were kept in quartz cells<br />
(Hellma) with a path length of 1 mm.<br />
Four xerogels were selected for the study. There is pure GeO 2 matrix and matrix with particles<br />
of Eu 2 O 3 , Ag and mixed composition Eu 2 O 3 -Ag. The ratio of volume of particle to volume of<br />
matrix was 5 % and 2 % for Eu 2 O 3 and Ag, respectively. The annealing of samples has been<br />
performed at air. The annealing time was 1 h for each sample.<br />
Achievements and Main Results<br />
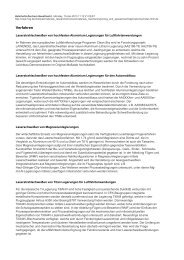
The scattering profiles for all investigated xerogels indicates scattering from large objects<br />
(strong scattering at lowest q, the slope is close 3. There are no significant changes in scattering<br />
curves of pure GeO 2 matrix and matrix with particles of silver at different annealing<br />
temperature. The some changes in scattering curves was observed in xerogels with particles<br />
of Eu 2 O 3 (figure 1) and Eu 2 O 3 -Ag.<br />
The scattering data may analyzed by assumption of two kind of objects: large objects, where<br />
only scattering from interface is observed and intermediate aggregates, where scattering is<br />
described by Indirect Fourier Transformation approach [3]. So, we have obtained some information<br />
about size distribution and the radius of gyration R g of intermediate aggregates.<br />
21
The calculated parameters of intermediate aggregates for xerogels with Eu 2 O 3 and<br />
Eu 2 O 3 +Ag were listed in Table 1.<br />
d(q)/d, arb. units<br />
10 3<br />
10 1<br />
The annealing temperature: 25 o C<br />
360 o C<br />
560 o C<br />
855 o C<br />
10 -1<br />
P(r), arb. units<br />
0.0015<br />
0.0010<br />
0.0005<br />
Eu 2<br />
O 3<br />
Eu 2<br />
O 3<br />
+Ag<br />
0.01 0.1<br />
q, A -1<br />
0.0000<br />
0 50 100 150 200<br />
r, A<br />
Figure 1: SANS profiles from xerogel<br />
GeO 2 with Eu 2 O 3 particles obtained at different<br />
annealing temperature. The solid<br />
line is calculated profile.<br />
Figure 2: The pair distance distribution function<br />
for intermediate aggregates calculated for xerogels<br />
GeO 2 +Eu 2 O 3 and GeO 2 +Eu 2 O 3 +Ag. The<br />
annealing temperature is 350 0 C.<br />
Table 1. The calculated parameters of intermediate aggregates for xerogels GeO 2 +Eu 2 O 3 and<br />
GeO 2 +Eu 2 O 3 +Ag. The annealing temperature, maximal size, scattering at “zero angle” and radius of<br />
gyration are listed.<br />
GeO 2 :Eu 2 O 3<br />
GeO 2 :Eu 2 O 3 +Ag<br />
T, 0 C D max , Å I(0) R g , Å<br />
360 190 1.72±0.07 59.3±1.1<br />
563.5 200 2.33±0.12 62.1±1.5<br />
360 90 0.55±0.03 31.1±0.7<br />
563.5 100 0.68±0.05 36.1±0.7<br />
The size of intermediate aggregates for sample GeO 2 -Eu 2 O 3 -Ag is smaller when GeO 2 -<br />
Eu 2 O 3 . Also, the shape of intermediate aggregates of GeO 2 -Eu 2 O 3 is slightly anisotropic and<br />
GeO 2 -Eu 2 O 3 -Ag shape is almost spherical.<br />
References<br />
[1] B. Long, Z. Lide, W. Xiaoping, Solid State Commun. 1997, 104 (9), 553.<br />
[2] H. Nabika, S.Deki, Eur. Phys. J. D. 2003, 24, 363.<br />
[3] O. Glatter, J. Appl. Cryst. 1977, 10, 415.<br />
22
EXPERIMENTAL REPORT<br />
GeNF<br />
SANS-1<br />
Small-angle neutron scattering of membrane solubilisation by polysorbates<br />
Proposer:<br />
Claudia Hoffmann 1 , 1 Institut für Physikalische Chemie,<br />
1 Martin-Luther-Universität Halle-Wittenberg, Halle, Germany<br />
Co-Proposer(s):<br />
Experimental Team:<br />
User Group Leader:<br />
Instrument Responsible:<br />
Date(s) of Experiment: 09 th – 13 th June 2008<br />
Alfred Blume 1<br />
Vasyl Haramus 2 , 2 GKSS Research Centre <strong>Geesthacht</strong>, Germany<br />
Objectives<br />
We have studied so-called vesicle-micelle transition of mixed systems of phospholipids with<br />
detergents by the means of isothermal titration calorimetry (ITC) and dynamic light scattering<br />
(DLS). We used as detergents polyoxyethylenated sorbitan monolaurate and monooleate<br />
(Tween20 and Tween80), respectively. The shape of the formed aggregates by addition of<br />
Tween20 and Tween80 to DPPC and DPPG vesicles, respectively, could not be obtained<br />
from DLS.<br />
In the present experiments the aim was to investigate the shape and size of the aggregates<br />
in all possible states of the structural transition.<br />
Experiment<br />
Small angle neutron scattering was used to study the shape and size of aggregates, depending<br />
on detergent/phospholipid ratio (R = 0.03 ... 10), type of head group of phospholipid<br />
(DPPC and DPPG) and type of detergent (Tween20 and Tween80). According to the observed<br />
phase transition boundaries from ITC and DLS, selected ratios of detergent and<br />
phospholipid were used at 45 °C in aqueous solution.<br />
Indirect Fourier Transformation (IFT) was used to obtain pair-distribution function of the particle.<br />
The fit-curves were calculated based on the obtained pair distance distribution function p(R)<br />
and the estimated particle shape. Figure 1 and Figure 2 show the scattering curves for DPPC<br />
and various Tween20/DPPC and Tween80/DPPC ratios, respectively, at 45 °C.<br />
Figure 1:<br />
Scattering intensities as a function of<br />
the scattering vector for pure DPPC and<br />
Tween20, as well as for various<br />
Tween20/DPPC ratios at 45 °C in aqueous<br />
solution. The dashed red lines represent<br />
the fit-curves.<br />
intensity / cm -1<br />
1000<br />
100<br />
10<br />
1<br />
0.1<br />
0.01<br />
1E-3<br />
1E-4<br />
1E-5<br />
1E-6<br />
DPPC<br />
Tween20/DPPC (R=0.06)<br />
Tween20/DPPC (R=0.33)<br />
Tween20/DPPC (R=1)<br />
Tween20/DPPC (R=3.33)<br />
Tween20 (10 mM)<br />
1E-3 0.01 0.1<br />
23
intensity / cm -1<br />
1000<br />
100<br />
10<br />
1<br />
0.1<br />
0.01<br />
1E-3<br />
1E-4<br />
1E-5<br />
1E-6<br />
DPPC<br />
Tween80/DPPC (R=0.33)<br />
Tween80/DPPC (R=3.33)<br />
Tween80/DPPC (R=10)<br />
Tween80 (10 mM)<br />
1E-3 0.01 0.1<br />
q, A -1<br />
Figure 2:<br />
Scattering intensities as a function<br />
of the scattering vector for pure<br />
DPPC and Tween80, as well as<br />
for various Tween80/DPPC ratios<br />
at 45 °C in aqueous solution. The<br />
dashed red lines represent the fitcurves.<br />
Main Results<br />
SANS data analysis allowed us to determine the size of the formed detergent/phospholipid<br />
aggregates (radius, diameter of cylindrical cross section, bilayer thickness, aggregation<br />
number) and also the shape, which is not accessible by DLS.<br />
Table 1: Selected SANS-results of measurements performed with various Tween/DPPC ratios.<br />
detergent detergent/DPPC ratio radius / nm<br />
shape<br />
R<br />
Tween20 0.06 4.4<br />
rod-like particles<br />
(diameter)<br />
Tween20 0.33 4.7 spherical particles<br />
Tween20 1 3.4 spherical particles<br />
Tween20 3.33 3.2 spherical particles<br />
Tween20<br />
without DPPC<br />
Tween20 (10 mM)<br />
3.2 spherical particles<br />
Tween80 0.33 5.9<br />
rod-like particles<br />
(diameter)<br />
Tween80 3.33 5.7 spherical particles<br />
Tween80 10 4.2 spherical particles<br />
Tween80<br />
without DPPC<br />
Tween80 (10 mM)<br />
4.6 spherical particles<br />
The size of the pure Tween micelles determined by SANS and DLS show very good agreement.<br />
24
EXPERIMENTAL REPORT<br />
GeNF<br />
SANS-1<br />
SANS studies of polyfluorenes and ladder polymers in solution<br />
Proposer:<br />
Matti Knaapila 1, 2 , 1 MAX-lab, Lund University, Sweden,<br />
2 Institut for Energy Technology, Norway<br />
Co-Proposer(s):<br />
Experimental Team:<br />
Head of Institute:<br />
Instrument Responsible:<br />
Andy Monkman 3 , 3 University of Durham, UK<br />
Date(s) of Experiment: 26 th June – 1 st July 2008<br />
Matti Knaapila 1<br />
Vasyl Haramus 4 , 4 GKSS Research Centre <strong>Geesthacht</strong>, Germany<br />
Objectives<br />
Polyfluorenes are a specific class of electroluminescent polymers. Structurally, they are so<br />
called hairy rods consisting of a rodlike backbone with flexible side chains. We have recently<br />
clarified how the phase behaviour of polyfluorene solutions depend on the solvent quality,<br />
side chain quality, side chain branching and side chain length as a function of temperature<br />
[1–4]. For instance, we have found that the shorter side chain polyfluorenes form large (10–<br />
100 nm) sheet-like assemblies (thickness of 2–3 nm). The larger length scale structures of<br />
these sheets show an odd-even dependence on the side chain length – the sheets of<br />
poly(9,9-hexylfluorene) and poly(9,9-octylfluorene) are broader and thinner, whereas<br />
poly(9,9-heptylfluorene) and poly(9,9-nonylfluorene) sheets are thicker with a putative double<br />
layer structure. Poly(9,9-dodecylfluorene) does not follow this sequence and only part of the<br />
polymer is assembled into a sheet-like structure, the rest remaining dissolved at the molecular<br />
level. As a natural continuation, the ideas of present work were to clarify how this picture<br />
changes when another level of hierarchy is added by means of block copolymers and when<br />
the rotation of main chain is restricted by means of ladder polymer.<br />
Experiment<br />
A symmetrical A-B-A 9,9-dialkylfluorene/2-alkylaniline triblock copolymer (or PF/PANI11112-<br />
b-PANI11) – consisting of 2-dodecylanilines as A blocks and 9,9-di(3,7,11-threemethyldodecyl)fluorene)s<br />
as B blocks – was mixed with deuterated toluene, methylcyclohexane,<br />
and chloroform and studied using SANS at <strong>Geesthacht</strong> (SANS-1). Moreover, a MeLPPP ladder<br />
polymer was studied in a similar manner. Q-range of about 0.003–0.3 Å -1 was used. Experiments<br />
followed the standard procedures of SANS.<br />
Achievements and Main Results<br />
The experiment was very successful and the beamline performance was excellent (see examples<br />
of the data in Fig. 1). According to preliminary interpretation, SANS indicates that<br />
PF/PANI11112-b-PANI11 adopts locally (q < 0.01 Å -1 ) a rigid conformation with a diameter of<br />
20 Å. Beyond this length scale, the polymer manifests surface fractal structure with the fractal<br />
dimension of 2.2–2.8. The SANS data are being combined with SAXS and photoabsorption<br />
spectroscopy data but it is yet too early to make final conclusions. Photoluminescence data<br />
seem to indicate that most PF units are separated both from PANI units and each others and<br />
imply that the links within the aggregates are predominantly formed via PANI units [5].<br />
25
I/c (cm -1 mg -1 mL)<br />
10<br />
10<br />
10<br />
10<br />
1<br />
0<br />
-1<br />
-2<br />
~ q -1<br />
~ q -3<br />
~ q -4<br />
Figure 1:<br />
Typical SANS curves obtained<br />
during the last GKSS measurement.<br />
10<br />
-3<br />
PF/PANI11112-b-PANI11 - toluene-d 8<br />
0.01 0.1<br />
q (Å -1 )<br />
PF/PANI11112-b-PANI11 was mixed in toluene-d 8 . with concentrations 10 mg/mL (open circles)<br />
and 1 mg/mL (solid circles) Solid red lines show the fractal (q < 0.02 Å -1 ) and rigid rod<br />
(q > 0.02 Å -1 ) regimes of the data. Dashed lines show -1, -3, and -4 decays for comparison.<br />
References<br />
[1] M. Knaapila, V. M. Garamus et al. Macromolecules, 2006;39:6505.<br />
[2] M. Knaapila, F. B. Dias, V. M. Garamus et al. Macromolecules, 2007;40:9398.<br />
[3] M. Knaapila, L. Almásy, V. M. Garamus et al. Polymer 2008;49:2033<br />
[4] M. Knaapila, R. Stepanyan, M. Torkkeli, V. M. Garamus et al. Phys. Rev. E 2008;77:051803.<br />
[5] M. Knaapila, V. M. Garamus et al. Journal of Physical Chemistry B, 2008;112:16415.<br />
26
EXPERIMENTAL REPORT<br />
GeNF<br />
SANS-1<br />
Small-angle polarized neutron scattering in anti-Invar Fe-Ni-C alloy<br />
under magnetic field<br />
Proposer:<br />
Co-Proposer(s):<br />
Volodymyr M. Nadutov 1 ,<br />
1 G.V. Kurdyumov Institute for Metal Physics of the N.A.S. of Ukraine,<br />
Kyiv, Ukraine<br />
Experimental Team:<br />
Head of Institute:<br />
Instrument Responsible:<br />
Date(s) of Experiment: 24 th – 28 th November 2008<br />
Sergij G. Kosintsev 1<br />
Volodymyr M. Nadutov 1<br />
Vasyl Haramus 2 , 2 GKSS Research Centre <strong>Geesthacht</strong>, Germany<br />
Scientific objective<br />
Anti-Invar behavior is characterized by an enhanced thermal expansion coefficient and its<br />
relatively stable temperature dependence in a certain temperature range. This effect occurs<br />
in -Fe or in f.c.c. iron-rich alloys containing substitution and interstitial elements [1]. We assume<br />
it can be considered to be magnetic in origin although the effect is observed at temperatures<br />
higher the Curie point.<br />
In order to obtain data enable to show inhomogeneous magnetic order in the iron-riche alloys<br />
resulting from mixed exchange interspin interactions and their important role in anti-Invar<br />
behaviour the SANS experiment was carried out on austenitic Fe-Ni-C alloy using polarized<br />
neutron beam. In order to separate magnetic component from nuclear one SANS<br />
measurements were performed under the magnetic field.<br />
Experimental Technique<br />
The Fe–25.3 %Ni-0.73 %C (wt.%) alloy showing anti-Invar behaviour were melted in a<br />
vacuum induction furnace in protective argon atmosphere. The cast material was annealed<br />
at 1000 o C for 3 hrs. The C concentration was determined by chemical analysis and the Ni<br />
content was obtained by means of X–ray fluorescence analysis. The samples were 2.75 mm<br />
thick plates, which were solution treated at 1100 o C in vacuum and subsequently quenched<br />
in water. The X–ray analysis controlled the phase content of the alloys.<br />
SANS experiments were performed at room temperature at the SANS1 instrument at the<br />
FRG-1 research reactor of GKSS [2]. The neutron wavelength was 8.5 Å and the wavelength<br />
resolution was 10 %. The range of scattering vectors 0.005 < q < 0.25 Å -1 was obtained using<br />
four sample-to-detector distances, 0.7–9.7 m. The polarized neutron beam and applied magnetic<br />
field of 1.5 T at the samples perpendicular to the neutron beam were used. The initial<br />
polarization of the neutrons (parallel to direction of the magnetic field) was close to 1, while<br />
the efficiency of the spin flipper to realize the inverse polarization state was 0.9.<br />
Results<br />
The SANS intensity averaged by -angle and summarized by spin direction in the Fe–<br />
25.3 %Ni-0,73 %C alloy for H = 0 and under H = 2.5 T are presented in Fig. 1a. At q < 0,017<br />
the applied magnetic field did not change the intensity of scattering that points to nuclei scat-<br />
27
tering from large-scale inhomogeneities with no magnetic contribution. The dramatically decreasing<br />
SANS intensities at q > 0,017 under the field of 1.5 T by approximately 5 times is<br />
observed. It means that there are small scale magnetic inhomogeneities in the Fe–25.3 %Ni-<br />
0.73 %C alloy with an average linear size of 60 Å, which were partially destroyed under<br />
magnetic field. However, the magnetically disordered state was not removed at all since the<br />
anisotropy of 2D scattering pattern at large q was observed even at H = 1.5 T (Fig. 1a, insert).<br />
The effect of field on SANS but of larger magnitude and in whole interval of scattering<br />
vectors 0.005 < q < 0.25 Å -1 was observed on Invar Fe–30.5 %Ni-1.5 %C alloy [3]. Thus an<br />
existence of inhomogeneous magnetic order in the anti-Invar alloy, which was in paramagnetic<br />
state (T c = 201 K) was revealed.<br />
d(q)/d, arb.u.<br />
100<br />
10<br />
1<br />
0,1<br />
H = 1,5 T<br />
Fe-Ni-C<br />
H = 0<br />
d(q)/d, arb. u.<br />
100<br />
10<br />
1<br />
0,1<br />
Fe-Ni-C<br />
1 H = 1,5 T off<br />
2 H = 1,5 T on<br />
0,01<br />
0,01 0,1<br />
q, Å -1<br />
0,01<br />
0,01 0,1<br />
q, Å -1<br />
(a)<br />
(b)<br />
Figure 1: The -averaded and spin summarized SANS intensities in anti-Invar Fe–25.3 %Ni-0.73 %C<br />
(wt.%) alloy for H = 0 and H = 1.5 T (a). SANS in polarized beam (b). Insert is the 2D scattering pattern<br />
(in linear scale) obtained at 0.7 m SDD (large q) in case of polarized neutrons and H = 1.5 T.<br />
Since the negligible difference between curves which represent different spin direction I - (q, H)<br />
and I + (q, H) was observed (Fig. 1b) the mathematical formalism connected with the data<br />
treatment of SANS from magnetic materials including both the nuclear (F N (q)) and magnetic<br />
(F M (q)) contributions was applied [4]. The size of magnetic and chemical aggregates (for q > 0.05 Å -1 )<br />
was estimated using the IFT method.<br />
The effect of ageing of the anti-Invar alloy at 773 K on SANS was studied in order to modify<br />
short-range atomic and respectively magnetic order. The principle decreases of scattering<br />
intensity were not observed within all interval of q after the heating.<br />
References<br />
[1] M. Acet, T. Schneider, E.F. Wassermann, W. Pepperhoff. Antiinvar effect. J. Appl. Phys., 75(10)<br />
(1994) 7015.<br />
[2] H.B. Stuhrmann, N. Burkhardt, G. Dietrich, R. Jünemann, W. Meerwinck, M. Schmitt, J. Wadzack,<br />
R. Willumeit, J. Zhao, K.H. Nierhaus: Nucl. Instr. Meth., A356 (1995), 133.<br />
[3] V.M. Nadutov, V.M. Garamus, R. Willumeit, Ye.O. Svystunov: Metallofizika i noveishie tekhnologii,<br />
24(5), (2002) 717.<br />
[4] W. Wagner, A. Wiedenmann, W. Petry, A. Geibel, and H.Gleiter, J. Mater. Res. 6 (1991) 2305.;<br />
A. Wiedenmann, J. Met. Nanocryst. Mater. 2-6 (1999) 315.<br />
28
EXPERIMENTAL REPORT<br />
GeNF<br />
SANS-1<br />
Proposer:<br />
Co-Proposer(s):<br />
Self-Assembly of Polyglycidol-Based Analogues to Pluronics<br />
at Low Temperatures<br />
Experimental Team:<br />
Head of Institute:<br />
Instrument Responsible:<br />
Stanislav Rangelov 1 , 1 Institute of Polymers, Bulgarian Academy<br />
of Sciences, Sofia, Bulgaria<br />
Silvia Halacheva 1,2 , 2 Department of Chemistry, University of Bath,<br />
Bath, UK<br />
Stanislav Rangelov 1<br />
Vasyl Haramus 3 , 3 GKSS Research Centre <strong>Geesthacht</strong>, Germany<br />
Date(s) of Experiment: 19 th October 1 st – November 2008<br />
Objectives<br />
We continue the earlier studies [1–6] on the self-assembly of LGP, that is, linear polyglycidolpoly(propylene<br />
oxide)-polyglycidol triblock copolymers in aqueous solution. These copolymers<br />
are considered as analogues to the commercially available Pluronic, poly(ethylene oxide)-<br />
poly(propylene oxide)-poly(ethylene oxide) (PEO-PPO-PEO), block copolymers in which the<br />
flanking PEO blocks are substituted by the structurally similar linear polyglycidol. The structural<br />
formulae of the monomer units of PEO, PPO, and polyglycidol are presented in Figure 1.<br />
H<br />
H<br />
H<br />
H 2 C<br />
C<br />
H<br />
O<br />
H 2 C<br />
C O<br />
H 2 C C<br />
CH H 3 2 C<br />
O<br />
OH<br />
(a)<br />
(b)<br />
(c)<br />
Figure 1: Monomer units of (a) poly(ethylene oxide), (b) poly(propylene oxide), and (c) linear polyglycidol.<br />
Our previous results show that the LGP copolymers self-associate in water into nanosized<br />
structures above a certain critical concentration. Depending on the composition the copolymers<br />
form different self-assembled structures. In addition, the interactions of the PPO and<br />
polyglycidol blocks with water change with temperature in opposite manners: whereas the<br />
solubility of PPO increases as the temperature decreases due to lower critical solution temperature<br />
(LCST) properties, the mobility of the polyglycidol chains was found to decrease as<br />
a result of lowering of the solubility and/or strong hydrogen bonding [1–6]. To complement<br />
the above studies the present project aimed at performing SANS experiments with aqueous<br />
dispersion of the LGP copolymers with a special attention to the lower temperature range. In<br />
particular, we aimed to investigate the internal structure of the nanosized particles possibly<br />
formed in that temperature range and to parameterize the latter.<br />
Experiment<br />
Eight copolymers differing in composition were selected for the study. The composition, polyglycidol<br />
contents, and total molecular weight are presented in Table 1. The samples were<br />
run at 4 concentrations in the range from 2 to 33 wt.-% and at temperatures 10 and 15 o C.<br />
29
Four sample-to-detector distances (0.7, 1.8, 4.5, 9.7 m) were used, which, with a neutron<br />
wavelength of 8.1 Å give a q-range of approximately 0.005–0.25 Å.<br />
Table 1: Abbreviation, polyglycidol content, composition, and total copolymer molecular weight of the<br />
LGP copolymers used in this study.<br />
Abbreviation Composition PG content (wt.-%) Molecular weight<br />
LGP134 (G) 18 (PO) 68 (G) 18 40 6700<br />
LGP135 (G) 27 (PO) 68 (G) 27 50 8000<br />
LGP136 (G) 40 (PO) 68 (G) 40 60 9900<br />
LGP137 (G) 63 (PO) 68 (G) 63 70 13300<br />
LGP64 (G) 8 (PO) 34 (G) 8 40 3200<br />
LGP65 (G) 13 (PO) 34 (G) 13 50 3900<br />
LGP66 (G) 17 (PO) 34 (G) 17 60 4500<br />
LGP67 (G) 26 (PO) 34 (G) 26 70 5800<br />
Achievements and Main Results<br />
Examples of evolutions of scattering curves with temperature, concentration, and copolymer<br />
composition are shown on Figures 2–5. The experimental curves exhibit peaks, broad<br />
maxima or shoulders that can be attributed to interparticle interference. Larger structures are<br />
also present in the dispersions. The detailed analysis and interpretation of the data are in<br />
progress. The data are being analyzed firstly by slope determination and than on an absolute<br />
scale and fitted by means of a least-squares method using recently developed models [7,8].<br />
Preliminary results from the fitting procedures for the LGP130 copolymers and 15 o C gave<br />
aggregation numbers and core radii that are in accordance to our earlier results. Special attention<br />
will be paid to the results obtained at 10 o C at which formation of particles of ‘reverse’<br />
[9] structure may be anticipated.<br />
100<br />
1000<br />
d(q)/d/c, cm -1 wt.% -1<br />
100<br />
10<br />
1<br />
d(q)/d/c, cm -1 wt.% -1<br />
10<br />
1<br />
0,1<br />
0,01<br />
0,1<br />
0,01 0,1<br />
q (A -1 )<br />
0,01 0,1<br />
q (A -1 )<br />
Figure 2: SANS profiles obtained from<br />
32.5 wt.-% aqueous dispersions of LGP65 at<br />
15 (closed squares), 10 (open squares) o C and<br />
LGP135 at 10 (open circles) and 15 (closed<br />
circles) o C.<br />
Figure 3: SANS profiles obtained from 2 (closed<br />
squares), 10 (open squares), 20 (open circles)<br />
and 32.5 (closed circles) wt.-% aqueous dispersions<br />
of LGP65 at 15 o C.<br />
30
100<br />
1000<br />
d(q)/d/c, cm -1 wt.% -1<br />
100<br />
10<br />
1<br />
0,1<br />
d(q)/d/c, cm -1 wt.% -1<br />
10<br />
1<br />
0,1<br />
0,01<br />
0,01 0,1<br />
q (A -1 )<br />
1E-3<br />
0,01 0,1<br />
q (A -1 )<br />
Figure 4: SANS profiles obtained from aqueous<br />
dispersions of LGP134 (closed squares), LGP135<br />
(open squares), LGP136 (closed circles), and<br />
LGP137 (open circles) at 20 wt.-% and 15 o C.<br />
Figure 5: SANS profiles obtained from aqueous<br />
dispersions of LGP134 (open squares), LGP135<br />
(closed squares), LGP136 (closed circles), and<br />
LGP137 (open circles) at 2 -wt.% and 10 o C.<br />
References and Notes<br />
[1] Halacheva, S.; Rangelov, S.; Tsvetanov, Ch. Macromolecules 2006, 39, 6845-52.<br />
[2] Halacheva, S.; Rangelov, S.; Tsvetanov, Ch. Macromolecules 2008, 41, 7699-705.<br />
[3] Rangelov, S.; Almgren, M.; Halacheva, S.; Tsvetanov, Ch. J. Phys. Chem. C 2007, 111, 13185-91.<br />
[4] Halacheva, S.; Rangelov, S.; Garamus, V. M. Macromolecules 2007, 40, 8015-21.<br />
[5] Halacheva, S.; Rangelov, S.; Tsvetanov, Ch. J. Phys. Chem. B 2008, 112, 1899-905.<br />
[6] Rangelov, S.; Halacheva, S.; Garamus, V. M.; Almgren, M. Macromolecules, on line.<br />
[7] Sommer, C.; Pedersen, J. S.; Garamus, V. M. Langmuir 2005, 21, 2137.<br />
[8] Liu, Y. C.; Chen, S. H.; Huang, J. S. Macromolecules 1998, 31, 2236.<br />
[9] Here the term ‘reverse’ is used to distinguish structures whose interior is different from that of the<br />
‘normal’ structures observed at ambient and elevated temperatures.<br />
31
EXPERIMENTAL REPORT<br />
GeNF<br />
SANS-1<br />
Proposer:<br />
Co-Proposer(s):<br />
Small-Angle Neutron Scattering of Bolaform Hydrogelators (III)<br />
Experimental Team:<br />
Head of Institute:<br />
Instrument Responsible:<br />
Date(s) of Experiment: 14 th – 18 th May 2008<br />
Annette Meister 1 , 1 Institut für Chemie, Martin-Luther-Universität<br />
Halle-Wittenberg, Halle, Germany<br />
Simon Drescher 2 , 2 Institut für Pharmazie,<br />
Martin-Luther-Universität Halle-Wittenberg, Halle, Germany<br />
Alfred Blume 1<br />
Vasyl Haramus 3 , 3 GKSS Research Centre <strong>Geesthacht</strong>, Germany<br />
Objectives<br />
We have recently reported on the temperature dependent aggregation behaviour of a series<br />
of symmetric long-chain bolaamphiphiles: polymethylene-1,1’-diyl-bis[2-(trimethylammonio)-<br />
ethylphosphate] (PC-Cn-PC) and dotriacontane-1,32-diyl-bis[2-(dimethylammonio)ethylphosphate]<br />
(Me 2 PE-Cn-Me 2 PE) with alkyl chain lengths of 22 to 32 carbon atoms. [1–6] These bolalipids<br />
gel water very efficiently by forming a dense network of nanofibres. By increasing the<br />
temperature these nanofibres transform into small micelles and the gel character is lost. This<br />
gel-sol conversion temperature, which is also indicated by an endothermic transition in the<br />
thermograms, closely depends on the alkyl chain lengths. In the meantime, new symmetric<br />
bolaamphiphiles with longer hydrocarbon chain spacer (C34 and C36) as well as bolalipids<br />
with a partly deuterated chain segment of 12 CD 2 -groups within the hydrocarbon chain<br />
spacer were synthesized.<br />
In addition, we synthesized two bolaamphiphiles with sulphur atoms at certain positions in<br />
the alkyl chain. Since the self-assembly process into nanofibres is exclusively driven by hydrophobic<br />
interactions of the polymethylene units, the questions arose whether the substitution<br />
of CH 2 -groups by sulphur atoms would perturb this aggregations process.<br />
The objective of our SANS experiments was to investigate the temperature dependent aggregation<br />
behaviour of these novel compounds as well as the shape and size of the formed<br />
aggregates. Especially, the partly deuterated bolalipid should afford detailed information concerning<br />
the arrangement of the bola molecules within the fibres.<br />
Experiment<br />
We used small angle neutron scattering (SANS) to study the shape and size of bolaamphiphile<br />
aggregates at different temperatures. According to the observed transition temperatures<br />
from DSC-measurements, selected temperatures were studied in the range between 15 and<br />
70 °C. Data analysis by Indirect Fourier Transformation (IFT) was performed at q > 0.02 Å<br />
where the effects of intermicellar interactions are negligible. This yields the scattering at zero<br />
angle (d(0)/d) and the radius of gyration (R g ) without any presumptions regarding particle<br />
size and shape.<br />
Achievements and Main Results<br />
SANS data analysis enable us to follow even small changes in shape and size of bolaamphiphile<br />
aggregates (radii, cross section, aggregation number, mass) formed by a suspension<br />
(c = 1 mg·ml -1 ) of various bolaamphiphiles.<br />
33
Investigation of Long-Chain Bis(phosphocholines) PC-C34-PC and PC-C36-PC<br />
With increasing carbon chain length, the first transition (T 1 ) in the DSC split in two transitions:<br />
T 1 and T 1 ’ (see Figure 1A). In-between these two transition temperatures the nanofibres<br />
formed by PC-C36-PC still exist, indicating an additional fibre-fibre-transition at T 1 . For PC-<br />
C34-PC we did not find fibres between T 1 and T 1 ’, which might be due to the small distance<br />
between both transition temperatures. Above T 1 ’ we find spherical micelles in both cases.<br />
Figure 1B shows the scattering curves for both bolaamphiphiles at different temperatures.<br />
A<br />
10 -2 10 -1<br />
Cp [kJ mol -1 K -1 ]<br />
11<br />
10<br />
9<br />
8<br />
7<br />
6<br />
5<br />
4<br />
3<br />
2<br />
T 1<br />
T 1T1<br />
T 1<br />
'<br />
1<br />
0 10 30 40 50 60 70 80 90 100<br />
Temperature [°C]<br />
T 1<br />
'<br />
PC-C32-PC<br />
PC-C34-PC<br />
PC-C36-PC<br />
B<br />
(d(q) / d) / c [cm² g -1 ]<br />
10 3<br />
10 2 PC-C34-PC<br />
25 °C<br />
53 °C<br />
65 °C<br />
10 1<br />
PC-C36-PC<br />
25 °C<br />
58 °C<br />
10 0<br />
70 °C<br />
q [1/Å]<br />
Figure 1: (A) DSC curves of an aqueous suspension of 1 mg·ml -1 PC-Cn-PC (with n = 32, 34, 36).<br />
Arrows indicate temperatures of SANS measurements. (B) Scattering intensities as a function of the<br />
scattering vector for PC-C34-PC and PC-C36-PC (c = 1 mg·ml -1 ) at different temperatures.<br />
Detailed information about the aggregate structures formed by PC-C34-PC and PC-C36-PC<br />
is given in Table 1:<br />
Table 1: Selected SANS-results (c = 1 mg·ml -1 ).<br />
bolalipid T [°C] shape radius [Å]<br />
N agg or<br />
N agg /L[Å -<br />
1 ]<br />
M, M L<br />
[g], [g·cm -1 ]<br />
PC-C34-PC<br />
PC-C36-PC<br />
25 fibres with flexibility 27 1.02 1.43×10 -13<br />
53 34 65 9.06×10 -20<br />
spherical micelles with some fibres at low q<br />
65<br />
34 65 9.08×10 -20<br />
25 stiff fibres, no flexibility is observed 26 1.01 1.46×10 -13<br />
58 some weak melting of fibres Sample was not stable.<br />
70 small micelles, most probably oblate shape 35 68 9.87×10 -20<br />
In addition, the scattering data of PC-C34-PC at 25 °C were fitted with the model of infinitely<br />
long cylinders as well as the model of helical structure applying a pitch value of 8 nm. The<br />
data can be plausibly described by both models equally well. 7<br />
Investigation of Bis(phosphodimethylethanolamines) with and without Partly Deuterated<br />
Alkyl Chain Me 2 PE-C34-Me 2 PE and Me 2 PE-C34d24-Me 2 PE<br />
Furthermore we investigated the shape of aggregates formed by tetratriacontane-1,34-diylbis[2-(dimethylammonio)ethylphosphate]<br />
(Me 2 PE-C34-Me 2 PE, X = H) and its partly deuterated<br />
analogue (Me 2 PE-C34d24-Me 2 PE,<br />
X = D). Both bolalipids form sheetlike<br />
structures at temperatures below<br />
the first transition, which was ob-<br />
H<br />
H 3 C<br />
CH 3<br />
N<br />
34<br />
O<br />
P<br />
O O<br />
O<br />
5<br />
X<br />
X<br />
X<br />
X 6<br />
5<br />
O<br />
O<br />
O<br />
P<br />
O<br />
N CH 3<br />
CH 3<br />
H
served by transmission electron microscopy investigations. Figure 2 shows the scattering<br />
curves for both bolaamphiphiles.<br />
A<br />
B<br />
(d(q) / d) / c [cm² g -1 ]<br />
10 3<br />
10 2<br />
10 1<br />
10 4 Me 2<br />
PE-C34-Me 2<br />
PE<br />
25°C<br />
60°C<br />
(d(q) / d) / c [cm² g -1 ]<br />
10 3<br />
10 2<br />
10 1<br />
10 4 Me 2<br />
PE-C34d24-Me 2<br />
PE<br />
25°C<br />
55°C<br />
10 0<br />
10 -2 10 -1<br />
q [1/Å]<br />
Figure 2: Scattering intensities of (A) Me 2 PE-C34-Me 2 PE and (B) Me 2 PE-C34d24-Me 2 PE (c = 1 mg·ml -1 )<br />
at different temperatures.<br />
10 0<br />
10 -2 10 -1<br />
q [1/Å]<br />
At 25 °C we see disc-like aggregates (slope ~ 2) where the thickness of these aggregates is<br />
much smaller than the other two dimensions. Analysis has been performed by simple slope<br />
determination, GUINIER approach, and GLATTER approach, respectively (data are showing in<br />
Table 2).<br />
Table 2: Results of analysis for deuterated and non-deuterated Me 2 PE-C34-Me 2 PE (c = 1 mg·ml -1 ) at<br />
25 °C (below the first transition temperature).<br />
bolalipid<br />
Slope analysis GUINIER analysis GLATTER analysis<br />
T<br />
[°C] Slope Q [Å -1 ] R t [Å] D [Å] Q [Å -1 I (0) [cm -1<br />
] R t [Å] D [Å]<br />
Å -2 D max [Å] Q [Å -1 ]<br />
]<br />
Me 2 PE-<br />
C34-Me 2 PE 25 2.49 0.01<br />
Me 2 PE-C34<br />
d24-Me 2 PE<br />
25<br />
2.11<br />
2.68<br />
Table 3:<br />
Results of analysis for deuterated and<br />
non-deuterated Me 2 PE-C34-Me 2 PE<br />
(c = 1 mg·ml -1 ) at temperatures above<br />
the first transition.<br />
bolalipid<br />
Me 2 PE-C34-<br />
Me 2 PE<br />
T<br />
[°C]<br />
R g,CS<br />
[Å]<br />
GLATTER analysis<br />
I (0) [cm -1<br />
Å -2 ]<br />
D max [Å] Q [Å -1 ]<br />
60 24.7 5.8×10 -3 55 whole<br />
Me 2 PE-C34<br />
d24-Me 2 PE 55 29.0 4.3×10⁻³ 55 whole<br />
Investigation of Bolalipids with Sulphur-Modified Alkyl Chains: PC-C32SS-PC and<br />
Me 2 PE-C32SS-Me 2 PE<br />
In the last part we investigated the influence of integrated sulphur atoms within the alkyl chain:<br />
PC-C32SS-PC (R = CH 3 ) and Me 2 PE-C32SS-Me 2 PE (R = H). Figure 3 shows the scattering<br />
intensities for both bolalipids at low temperatures<br />
(below the first transition) and higher<br />
temperatures (above the first transition).<br />
CH 3<br />
R<br />
N<br />
H 3 C<br />
O<br />
P<br />
O<br />
O<br />
O<br />
S<br />
S<br />
5 4<br />
O<br />
O O<br />
P<br />
5<br />
O<br />
N CH 3<br />
CH 3<br />
R<br />
Figure 3:<br />
Scattering intensities of PC-C32SS-PC and<br />
Me 2 PE-C32SS-Me 2 PE (c = 1 mg·ml -1 ) at different<br />
temperatures.<br />
(d(q) / d) / c [cm² g -1 ]<br />
10 3<br />
10 2<br />
Me 2<br />
PE - 15°C<br />
10 1<br />
Me 2<br />
PE - 55°C<br />
PC - 10°C<br />
PC - 25°C<br />
10 0<br />
10 -2 10 -1<br />
q [1/Å]<br />
We find flexible fibres for both compounds at temperatures below the first transition with<br />
following dimensions:<br />
PC-C32SS: N agg = 1.12 Å -1 , R = 25.46 Å and M L = 1.59·10 -13 g·cm -1 ;<br />
Me 2 PE-C32SS: N agg = 1.35 Å -1 , R = 26.02 Å and M L = 1.84·10 -13 g·cm -1 .<br />
At higher temperatures (above the first transition) these fibres transform into micelles (for<br />
PC-C32SS with N agg = 42,79, R = 26.34 Å and M = 6.1·10 -20 g) and a multicomponent system<br />
of short fibres and micelles for Me 2 PE-32SS.<br />
References<br />
[1] Köhler, K. et al., Angew. Chem. Int. Ed. 43 (2004) 245-247.<br />
[2] Köhler, K. et al., J. Am. Chem. Soc. 126 (2004) 16804-16813.<br />
[3] Köhler, K. et al., Soft Matter 2 (2006) 77-86.<br />
[4] Drescher, S. et al., Chem. Eur. J. 13 (2007) 5300-5307.<br />
[5] Meister, A. et al., Langmuir 23 (2007) 7715-7723.<br />
[6] Meister, A. et al., Langmuir 24 (2008) 6238-6246.<br />
[7] Meister, A. et al., J. Phys. Chem. B 112 (2008) 4506-4511.<br />
36
EXPERIMENTAL REPORT<br />
GeNF<br />
SANS-1<br />
Intermediates during the Phase Transition from a Lipid Cubic Phase to<br />
Sponge and Lamellar Mesophases<br />
Proposer:<br />
Co-Proposer(s):<br />
Experimental Team:<br />
Head of Institute:<br />
Instrument Responsible:<br />
Angelina Angelova 1<br />
1 CNRS, Université de Paris 11, Châtenay-Malabry, France<br />
Rada Mutafchieva 2<br />
2 Bulgarian Academy of Sciences, Sofia, Bulgaria<br />
Geneviève Le Bas 1 , Vihra Iordanova 2<br />
Angelina Angelova 1<br />
Vasyl Haramus 3 , Borislav Angelov 3<br />
3 GKSS Research Centre <strong>Geesthacht</strong>, Germany<br />
Date(s) of Experiment: 23 rd – 30 th April 2008<br />
Objectives<br />
This project investigated intermediate structures that occur during the cubic to a bilayer<br />
sponge (L 3 ) phase transition of a lipid/water system. The compositional dependence of these<br />
intermediates in the monoolein (MO)/glycerol monooleate derivative (GO)/water system was<br />
monitored by means of small-angle neutron scattering (SANS).<br />
The samples for the investigation of the composition dependence of the melting of the cubic<br />
phase of MO by incorporating a certain amount of glycerol monooleate derivative (ultra pure<br />
NOFABLE GO-991, >99 % oleic acid purity) were prepared from a powder of 1-monooleoylrac-glycerol<br />
(purity 99 %, Sigma-Aldrich) hydrated and dispersed in excess aqueous buffer<br />
phase. The system contained various molar ratios between the lipid components hydrated in<br />
D 2 O (0.1 M NaCl, phosphate buffer (pH 7.0)). A wide range of lipid-to-lipid molar ratios were<br />
studied (MO/GO 90/10, 80/20, 70/30 mol/mol, etc). These molar ratios between MO and GO<br />
were chosen to be close to the critical value for the induction of a order-to-disorder phase<br />
transition in MO.<br />
Experiment<br />
The measurements were performed at the SANS1 beamline of the FRG-1 research reactor<br />
using the new 2D detector in the Q-range from 4 · 10 -3 –3 · 10 -1 A -1 . One setup was employed.<br />
The measurements were done in series of 4 or 5 samples during one week. The temperature<br />
for MO/GO samples was fixed at 25 o C.<br />
Achievements and Main Results<br />
The performed study is a continuation of our previous project where cubic phases with large<br />
and normal water channels were investigated by means of SANS [1,2] . The results obtained<br />
with the MO/OG system revealed an order-disorder transition of continuous 3D nanostructures<br />
formed by lipid bilayers. The results from our recent X-ray diffraction study have<br />
evidenced the existence of long living intermediates between cubic and lamellar phases<br />
induced by temperature stimuli, the structure of which has not been previously analyzed.<br />
37
Figure 1: SANS images obtained at room temperature from self-assembly dispersions of glycerol<br />
monooleate (pharmaceutical grade GO) with different amphiphilic additives (polyoxyethylene monooleate<br />
MO-Peg and monoolein MO).<br />
Figure 2: Sponge-like intermediate during the cubic-to-lamellar mesophase transition.<br />
The cubic and sponge phases have potential for drug delivery and other biomedical<br />
applications.<br />
References<br />
[1] Angelov, B.; Angelova, A.; Ollivon, M.; Bourgaux, C.; Campitelli, A. J. Am. Chem. Soc. 2003, 125,<br />
7188-7189<br />
[2] Angelov, B., Angelova, A., Garamus, V.M., Lebas, G., Lesieur, S., Ollivon, M., Funari, S.S.,<br />
Willumeit, R., Couvreur, M., J. Am. Chem. Soc., 2007, 129, 13474.<br />
38
EXPERIMENTAL REPORT<br />
GeNF<br />
SANS-1<br />
Polymer morphology and the effects of annealing on polyhydroxy<br />
butyrate/ethyl cellulose blends<br />
Proposer:<br />
Co-Proposer(s):<br />
Chris Garvey 1 , 1 ANSTO, PMB 1, MENAI NSW 2234, AUSTRALIA<br />
Experimental Team:<br />
Head of Institute:<br />
Instrument Responsible:<br />
Date(s) of Experiment: 8 th – 14 th April 2008<br />
Chris Garvey 1<br />
Vasyl Haramus 2 , 2 GKSS Research Centre <strong>Geesthacht</strong>, Germany<br />
Objectives<br />
This study aims to understand the interface between two blended polymers, a polyester produced<br />
by bacterial fermentation (polyhydroxybutyrate, PHB), and a commercial derivative of<br />
cellulose, (ethyl cellulose EC), and how the interaction between the two polymers affects the<br />
crystallisation of PHB. The former is expensive and prone to crystallisation and brittleness<br />
but has many favourable material properties, and latter is cheap biocompatible and has a<br />
potential as an additive.<br />
Experiment<br />
To improve the scattering contrast between the two polymer phases deuterated PHB was<br />
produced by the bacteria Cupriavidus necator fed on a deuterated acetate carbon source in a<br />
H 2 O growth media. GC-MS characterisation of the product indicated that the resulting polymer<br />
contained deuteration in 5 positions out of 6 on the monomer. Using the chemical formula,<br />
the density of the material and this value of deuteration a scattering length density<br />
(SLD 5D(PHB) = 5.61 x 10 -6 Å -2 ) was calculated. This enhances scattering contrast with the EC<br />
phase (SLD EC = 1.22 x 10 -6 Å -2 ; SLD 6H(PHB) = 1.38 x 10 -6 Å -2 ).<br />
Films of the polymer were cast from chloroform solutions of the desired EC/PHB ratio, the<br />
chloroform removed in a vacuum oven, and the samples were annealed for varying times at<br />
70 o C. SANS measurements were made on films in the unannealed state, and on films which<br />
had been annealed for 5 days. By correcting for sample thickness and subtracting the scattering<br />
due to the sample holder scattering curves were placed on an absolute intensity scale.<br />
The subtraction of an incoherent background, which should be dominated by the density of<br />
hydrogen and therefore the amount and density of EC in the sample, is an outstanding issue<br />
with the quantitative interpretation of the data.<br />
Achievements and Main Results<br />
Wide angle x-ray scattering measurements on the samples are typical of a semicrystalline<br />
polymer, superimposed upon a broad amorphous halo. A preliminary evaluation of the data<br />
from unannealed films (Figure 1 inset) indicated the relative contribution of the crystalline<br />
signal (sharp diffraction peaks) correlates well with the amount of PHB.<br />
39
intensity (cm -1 )<br />
1000<br />
100<br />
10<br />
intensity (a.u.)<br />
100<br />
10<br />
% EC<br />
0<br />
20<br />
40<br />
60<br />
80<br />
100<br />
% EC<br />
0<br />
20<br />
40<br />
60<br />
Figure 1:<br />
SANS curves from PHB/EC blends<br />
from cast samples. The inset shows<br />
WAXS data from the samples and<br />
the changes in the scattered intensity<br />
due to diffraction peaks of the crystalline<br />
PHB. Each WAXS curve is<br />
offset.<br />
1<br />
0.8 1.6 2.4<br />
q (Å -1 )<br />
0.01 0.1<br />
q(Å -1 )<br />
Some typical scattering curves are shown in Figure 1. It is interesting that a sample with lowest<br />
amount of chemical hetereogeneity, the pure (deuterated) PHB sample gives a high scattered<br />
intensity. We would assume that the heterogeneities in this sample are related to<br />
pores in the PHB film. Annealing of the pure PHB film decreased the scattered intensity and<br />
caused small specific changes in the scattering pattern (Figure 2). One could assume that<br />
these are the length scales associated with the pores. By contrast the pure EC film gave a<br />
low intensity uniform q-independent scattered intensity (not shown). This result may serve<br />
as a basis for calculating an incoherent background subtraction based on the density and<br />
chemical composition of the film.<br />
intensity (cm -1 )<br />
1000<br />
100<br />
10<br />
intensity (cm -1 )<br />
100<br />
10<br />
cast<br />
annealed<br />
cast<br />
cast then annealed 5 days<br />
-2.6<br />
Figure 2:<br />
Typical SANS curve from D-PHB/EC<br />
(60:40 %) blend from cast and cast<br />
and annealed sample. The inset<br />
shows the effects of annealing on a<br />
pure D-PHB sample.<br />
1<br />
0.1<br />
q (Å -1 )<br />
0.01 0.1<br />
q (Å -1 )<br />
Preliminary evaluation of the data has been made on the basis on a deviation from the Porod<br />
law. In this scheme a -4 slope of the log intensity versus log q plot is indicative of a smooth<br />
interface. None of the measurements on the blends show this behaviour over the q-range<br />
considered. Reasons for deviation from this behaviour could be:<br />
1. A diffuse interface with mixing between the two polymer phases.<br />
2. A fractal interface.<br />
In the case of the former it is possible quantify this interfacial overlap using the theory of<br />
Koberstein et al. [1] . A reductionist approach to the interaction between the two polymers is<br />
the slope of the linear region at low q. This has been plotted as a function of the composition<br />
40
(Figure 3 left), and compared with the fractional crystallinity determined by differential scanning<br />
calorimetry (Figure 3 right).<br />
slope<br />
-2.0<br />
-2.5<br />
cast<br />
annealled<br />
% PHB crystallinity<br />
70<br />
65<br />
60<br />
55<br />
50<br />
45<br />
40<br />
cast<br />
annealed<br />
-3.0<br />
20 40 60 80 100<br />
% PHB<br />
35<br />
0 20 40 60 80 100<br />
% EC<br />
Figure 3: Comparison of low-q slope of scattering curve (left) with fractional crystallinity of PHB phase<br />
(right) as a function of annealing and film composition.<br />
We draw the following conclusions:<br />
• Ability of EC to prevent/enhance PHB crystallisation during annealing is concentration<br />
dependent.<br />
• SANS can be used to investigate interfacial structure between two phases.<br />
► Deviation from Porod behaviour is interpreted in terms of a diffuse interface.<br />
Reference<br />
[1] Koberstein, J.T.; Morra, B.; Stein, R.S.; The determination of diffuse-boundary thicknesses of<br />
polymers by small-angle X-ray scattering, Journal of Applied Crystallography 13 (1980), 34–45.<br />
41
EXPERIMENTAL REPORT<br />
GeNF<br />
SANS-1<br />
SANS contrast variation on water-based magnetic fluids stabilized<br />
by different monocarboxylic acids<br />
Proposer:<br />
Co-Proposer(s):<br />
Experimental Team:<br />
Head of Institute:<br />
Instrument Responsible:<br />
M.V. Avdeev 1 , 1 FLNP, JINR, Dubna, Russia<br />
L. Vekas 2 , 2 CFATR, Timisoara, Romania<br />
Date(s) of Experiment: 5 th – 10 th December 2008<br />
A.V. Feoktystov 3 , 3 GKSS Research Centre <strong>Geesthacht</strong>, Germany<br />
M.V. Avdeev 1<br />
V. Haramus 3<br />
Objectives<br />
Magnetic fluids (colloidal dispersions of magnetic nanoparticles in liquids) with double stabilization<br />
in water have been studied by SANS. The contrast variation based on D 2 O/H 2 O substitution<br />
was applied for revealing inner structure of particles in the systems. The basic<br />
function approach for polydisperse and superparamagnetic systems [1] was used.<br />
Experiment<br />
The initial concentrated magnetic fluids were synthesized in the Laboratory of Magnetic Fluids<br />
at the Center of Fundamental and Advanced Technical Research of the Romanian Academy<br />
of Sciences (Timisoara, Romania) in accordance with procedure [2]. The samples were waterbased<br />
magnetic fluids with magnetite nanoparticles stabilized by myristic (MA) or lauric acids<br />
(LA). The volume fraction of dispersed magnetite, φ m , constituted 11 % in the LA sample and<br />
13 % in the MA sample.<br />
To perform contrast variation measurements samples were diluted ten times with different<br />
mixtures of light water (H 2 O) and heavy water (D 2 O) in a way that the D 2 O content in the final<br />
sample was varied from 0 % up to 90 %. As buffer solutions the corresponding mixtures of<br />
H 2 O/D 2 O with the same D 2 O content were used.<br />
Achievements and main results<br />
Scattering curves measured at various D 2 O content are presented in Fig. 1a (LA) and Fig. 1b<br />
(MA). We failed in fitting the experimental curves to the model of separate core-shell particles<br />
imitating spherical magnetite cores coated with surfactant shell. This indicates a significant<br />
aggregation effect on the scattering, which differs much the studied type of magnetic fluids<br />
from those based on non-polar carriers and stabilized by a single surfactant layer.<br />
The found shape basic functions are given in Fig. 2a. The Indirect Fourier Transform (IFT) [3]<br />
results in pare distance distribution (PDD) functions (Fig. 3b). One can see a significant difference<br />
in the organization of aggregates in the two fluids. If for the LA sample there is an<br />
observable difference in PDD functions from I c<br />
( q)<br />
and from the H 2 O curve, for the MA sample<br />
the PDD functions of the two kinds almost coincide. For the LA sample the difference in<br />
the maximal size of the two PDD functions, about 3.5 nm, can be related to the effective<br />
thickness of the surfactant layer around magnetite nanoparticles. As to the MA sample, we<br />
43
suppose that here one deals with the homogeneous agglomeration with quite small effective<br />
thickness of the surfactant around single magnetite nanoparticles. Estimates of the volume<br />
fraction of magnetite in these agglomerates (from SANS analysis) gives the value around 0.45.<br />
Intensity, cm -1<br />
100<br />
10<br />
1<br />
0.1<br />
1la ~ 0% D2O<br />
2la ~ 10% D2O<br />
3la ~ 20% D2O<br />
4la ~ 30% D2O<br />
5la ~ 40% D2O<br />
6la ~ 50% D2O<br />
7la ~ 60% D2O<br />
8la ~ 70% D2O<br />
9la ~ 80% D2O<br />
10la ~ 90% D2O<br />
Intensity, cm -1<br />
10<br />
1<br />
1ma - 0% D2O<br />
2ma - 10% D2O<br />
3ma - 20% D2O<br />
4ma - 30% D2O<br />
5ma - 40% D2O<br />
6ma - 50% D2O<br />
7ma - 60% D2O<br />
8ma - 70% D2O<br />
9ma - 80% D2O<br />
10ma - 90% D2O<br />
0.1<br />
0.01<br />
0.1 1<br />
0.1 1<br />
q, nm -1 q, nm -1<br />
(a)<br />
Figure1: SANS contrast variation on magnetic fluids with double-layer stabilization by lauric acid (LA)<br />
(a) and myristic acid (MA) (b). Percent volume fraction of D 2 O in the solvent is indicated. Volume fraction<br />
of dispersed magnetite in the samples, m , is ~1.1 % (LA) and ~1.3 % (MA).<br />
(b)<br />
10<br />
0.25<br />
1<br />
Ic LA<br />
Ic MA<br />
0.20<br />
TEM (MA)<br />
Intensity, x10 -20 cm 3<br />
0.1<br />
0.01<br />
p(r)<br />
0.15<br />
0.10<br />
0.05<br />
TEM (LA)<br />
MA<br />
LA<br />
1E-3<br />
0.00<br />
0 10 20 30 40 50<br />
0.1 1<br />
r, nm<br />
q, nm -1<br />
(a)<br />
Figure 2: Experimentally obtained shape scattering modified basic functions for each of magnetic<br />
fluids. The line shows fits of the curves according to obtained p(r) function (a); Pair distance distribution<br />
functions of particles found from shape scattering modified basic functions for both magnetic fluids<br />
(solid lines) compared with the pair distance distribution functions found from the curves with 0 % D 2 O<br />
content (dashed lines) and from the TEM measurements of the separated particles (doted lines) (b).<br />
(b)<br />
Acknowledgement<br />
The MF samples investigated were synthesized by Dr. Doina Bica † (1952–2008) in the<br />
framework of the research program of the Lab. Magnetic Fluids-CFATR.<br />
The work is done in the frame of the project RFBR-<strong>Helmholtz</strong> (HRJRG-016). The PNII research<br />
program of the Romanian Ministry of Education and Research, project NANOMAG-<br />
POLI nr.71-068 /2007 is also acknowledged.<br />
References<br />
[1] M.V. Avdeev, J. Appl. Cryst. 40 (2007) 56<br />
[2] D. Bica, L. Vekas, M.V. Avdeev, et al.,J. Mag. Mag. Mater. 311 (2007) 17<br />
[3] O. Glatter, J. Appl. Cryst. 10 (1977) 415<br />
44
EXPERIMENTAL REPORT<br />
GeNF<br />
SANS-1<br />
SANS study of ferrofluids with iron/iron oxide nanoparticles<br />
obtained by laser pyrolysis<br />
Proposer:<br />
L. Vekas 1 , 1 CFATR, Timisoara, Romania<br />
Co-Proposer(s):<br />
A. Han 2 , 2 Univ. Politehnica-NCESCF, Timisoara, Romania<br />
Experimental Team: I. Morjan 3 , 3 Nat. Inst. Phys.Lasers, Plasma & Radiation, Bucharest,<br />
Romania<br />
M.V. Avdeev 4 , 4 FLNP, JINR, Dubna, Russia<br />
A.V. Feoktystov 5 , 5 GKSS Research Centre <strong>Geesthacht</strong>, Germany<br />
Head of Institute: L.Vékás 1<br />
Instrument Responsible: V. Haramus 5<br />
Date(s) of Experiment: 1 st – 5 th December 2008<br />
Objectives<br />
Preparation of ferrofluids using magnetic nanoparticles synthesized by gas-phase laser pyrolysis<br />
procedure is a new and challenging method [1] to obtain ferrofluids for various biomedical<br />
and engineering applications [2]. The composition and size of magnetic nanoparticles are<br />
dependent on the synthesis parameters, the procedure conducting to iron oxide or iron-iron<br />
oxide core-shell type nanostructured particles with sizes varying from 3 to 20 nm. The nanopowder<br />
was stabilized and dispersed in organic and water carrier liquids, the efficiency of<br />
sterical stabilization method being one of the key problems of the whole ferrofluid preparation<br />
procedure. In the given experiments we investigated the structure parameters of the new<br />
type of ferrofluids based on different liquid carriers by means of the small-angle neutron scattering<br />
(SANS).<br />
Experiment<br />
Our previous SANS studies of this kind of ferrofluids prepared from SF (sample name) type<br />
iron oxide nanopowder [3] showed the existence of large fractal type particle agglomerates.<br />
The SF type iron oxide nanopowder had particles of very small "magnetic" sizes of 4–5 nm<br />
and relatively low saturation magnetization, 15–20 emu/g. By adequate choice of laser pyrolysis<br />
process parameters, iron core-iron oxide shell nanostructured ("FeO") particles were<br />
obtained in the size range of 8–20 nm and the resulting nanopowder having high specific<br />
magnetic moment, 70–80 emu/g. Structural characterization (TEM/HRTEM, XRD) evidenced<br />
the Fe core and the Fe2O3/Fe3O4 shell. Stabilization/dispersion of these core-shell type<br />
particles in organic carriers or water gave promising results. DLS investigations [4] show that<br />
the stabilization procedure applied to ferrofluid samples with good colloidal stability, having<br />
smaller sized agglomerates compared to the previous ferrofluid samples investigated [3], in<br />
spite of the high magnetic moment of iron-iron oxide nanoparticles. FeO powders were prepared<br />
at the National Institute of Lasers Physics, Plasma & Radiation (Bucharest, Romania),<br />
which were then dispersed and stabilized in different liquids (including transformer oil,<br />
petroleum, decahydronaphthalene, i-octane, water) in the Laboratory of Magnetic Fluids at<br />
the Center of Fundamental and Advanced Technical Research of the Romanian Academy of<br />
Sciences (Timisoara, Romania). The volume fraction of the magnetic material in the fluids<br />
was around 0.5 %<br />
45
Achievements and main results<br />
Examples of the obtained scattering curves are given in Fig. 1. The studied samples show<br />
tendency to formation of aggregates even in the absence of external magnetic field. This<br />
tendency is higher and aggregates are more stable with respect to water-based ferrofluids<br />
where various cluster types were also revealed [5, 6]. We suppose that this is a result of significantly<br />
stronger magnetic interaction between iron/iron oxide particles as compared to<br />
magnetite particles used previously. Nevertheless in some cases, like petroleum shown in<br />
Fig. 1 (sample LP7), the scattering curve repeats well the curves obtained for highly stable<br />
ferrofluids with magnetite dispersed in organic non-polar carriers. Estimated parameters of<br />
the log-normal particle size distribution R 0 = 3.7 nm, S = 0.35 are comparable with those for<br />
nanomagnetite. The characteristic particle size (including the mean size and polydispersity)<br />
constitutes about 15 nm. It differs much the current procedure of the sample preparation from<br />
the previous one, where the characteristic particle size in powders was found to be less,<br />
about 7 nm (it is reflected in Fig. 1 in the curve for previous SF35 sample). The reason for<br />
the found effect of the change in the preparation procedure is under discussion.<br />
The other interesting feature found is the appearance of the second characteristic size in the<br />
scattering curves. Example is given in Fig. 1 for the sample based on water (LP4). Again,<br />
one can see a difference compared to the previous SF35 sample. As a whole, the scattering<br />
repeats the previous intensity decrease with increasing q; still, an additional scattering break<br />
at q = 0.24 nm -1 can be seen. It can reflect the additional type of magnetic particles, which<br />
are larger than the basic iron/iron oxide particles, or some kind of short range ordering in the<br />
aggregates. The corresponding particle radius or the correlation length is about 26 nm.<br />
I(q), cm -1<br />
100<br />
10<br />
1<br />
0.1<br />
0.01<br />
1E-3<br />
1E-4<br />
LP4<br />
LP7<br />
SF35 in Tr30<br />
Fe 3<br />
O 4<br />
in Tr30<br />
0.1 1<br />
q, nm -1<br />
Figure 1:<br />
Comparison of the scattering from the new<br />
samples with the previous ones, including<br />
new sample iron/iron oxide stabilized with<br />
DBS in H 2 O (LP4); new sample iron/iron<br />
oxide stabilized with oleic acid in petroleum<br />
(LP7), line shows fit of the model “polydisperse<br />
spheres” with log-normal size<br />
distribution; previous sample iron/iron oxide<br />
stabilized with oleic acid in transformer oil<br />
(SF35 in Tr30); previous sample magnetite<br />
stabilized with oleic acid in transformer oil<br />
(Fe 3 O 4 in Tr30). For convenient view the<br />
curves are divided by factors of 2 (SF35 in<br />
Tr30), 10 (LP7) and 20 (Fe 3 O 4 in Tr30).<br />
Acknowledgement<br />
The PNII research program of the Romanian Ministry of Education and Research, project<br />
BIMAPAFLU nr.71-023/2007 is acknowledged.<br />
References<br />
[1] Popovici, E., F. Dumitrache, I. Morjan, et al., Appl. Surf. Sci. 254 (2007) 1048<br />
[2] L.Vékás, M.V. Avdeev, D. Bica, Magnetic Nanofluids: Synthesis and Structure, in: Nanoscience in<br />
Biomedicine (Ed. Donglu Shi) (Springer Verlag, 2009, to appear) pp. 645–704<br />
[3] L.Vékás, D. Bica. V. Haramus, M.V. Avdeev, SANS study of ferrofluids with iron oxide nanoparticles<br />
prepared by laser pyrolysis, Experimental report, GKSS (2007)<br />
[4] D. Bica, A. Han, M.V. Avdeev et al., Laser pyrolisis synthesized magnetic nanoparticles in hydrocarbon<br />
and water based suspensions, ERMR08, Dresden (August, 2008)<br />
[5] M.V. Avdeev, V.L. Aksenov, M. Balasoiu, V.M. Garamus, A. Schreyer, Gy. Török, L. Rosta, D. Bica,<br />
L. Vékás, J. Coll. Interface Sci. 295 (2006) 100<br />
[6] D. Bica, L.Vékás, M.V. Avdeev, O.Marinică, V.Socoliuc, M.Bălăsoiu, V.M. Garamus, J. Mag. Mag.<br />
Mater. 311 (2007) 17<br />
46
EXPERIMENTAL REPORT<br />
GeNF<br />
SANS-1<br />
Salt Effect of Complex Formation of Polyelectrolyte<br />
and Oppositely Charged Surfactant<br />
Proposer:<br />
Co-Proposer(s):<br />
Masahiko Annaka 1 , 1 Kyushu University, Fukuoka, Japan<br />
Experimental Team:<br />
Head of Institute:<br />
Instrument Responsible:<br />
Date(s) of Experiment: 20 th – 29 th September 2008<br />
Tsuyoshi Matsuda 1 , Ryuji Motono 1<br />
Masahiko Annaka 1<br />
Vasyl Haramus 2 , 2 GKSS Research Centre <strong>Geesthacht</strong>, Germany<br />
Objectives<br />
The mechanisms of self-assembly are playing a central role in the field of soft condensed<br />
matter. More recently, the controlled association of colloids and macromolecules that would<br />
not proceed through the hydrophobic effect has been recognized as a major challenge in the<br />
field of physical chemistry. Obviously, this type of approach would have a huge impact on<br />
applications in material science, nanotechnology and in biology. We have investigated extensively<br />
the complexation mechanism between neutral/polyelectrolyte diblock copolymers<br />
poly(acrylamide)-block-poly(acrylic acid) (PAM-b-PAA) and dodecyltrimethylammonium bromide<br />
(DTAB) (Fig. 1). From earlier works, it was suspected that these mixed colloids exhibit a<br />
core-shell structure. However, their inner structures have not been unveiled. Since the interaction<br />
between polyelectrolyte and oppositely charged surfactant is primarily electrostatic in<br />
nature, electrostatic factors, such as macromolecular charge densities and ionic strength, are<br />
the most important factors. In this study we focused on the salt effect on microscopic structure<br />
of the complex of PAM-b-PAA and DTAB under the presence of various amount of<br />
sodium bromide.<br />
Experiment<br />
Sample preparation: PAM was prepared by<br />
reversible addition-fragmentation chain transfer<br />
(RAFT) polymerization using 2-cyanopropyldithiobenzoate<br />
as a chain transfer agent (CTA).<br />
Chemical structure of PAM-b-PAA.<br />
Figure 1:<br />
RAFT polymerization of diblock copolymers,<br />
PAM-b-PAA, were performed with PAM as the macro-CTA (m : n = 122 : 58, Mw/Mn = 1.19).<br />
Preparation of PAM-b-PAA/DTAB Complexes: In this study, as standard condition, 0.25 g/L<br />
PAM-b-PAA in NaBr D 2 O solution were put into the cell, and equal volume of D 2 O solution of<br />
DTAB and a D 2 O solution of 0.50 g/L PAM-b-PAA containing same NaBr concentration were<br />
added up to the desired mixing ratio. The dosage was carried out continuously with a slow<br />
rate under gentle stirring at 25 °C. Solutions were made dustfree by filtration through a Millipore<br />
membrane (0.45 m pore size).<br />
Achievements and Main Results<br />
Fig. 2a shows the scattering intensity obtained from PAM-b-PAA/DTAB solutions in D 2 O at<br />
0.5 wt.% for different values of charge ratio Z, defined by the ratio of charges of DTAB to<br />
PAA unit (Z = [DTAB]/n[PAM-b-PAA], n: degree of polymerization of PAA unit, : degree of<br />
neutralization of PAA unit, In this study, n = 58, and = 0.8.). The pure polymers solution<br />
exhibits an overall weak scattering , as is expected from dilute polymer solution in good sol-<br />
47
vent. For the PAM-b-PAA/DTAB solutions, there exists a critical stoichiometric ratio (here<br />
Z C ~ 0.7) above which the scattering intensity is dominated by two noticeable features:<br />
strong forward scattering ( q 0) and the appearance of a structure peak at high wave vectors,<br />
located at q 0 ~ 0.16 Å -1 . For Z = 1 and Z = 2, the damped oscillation in the intensity<br />
decay around 0.05 Å -1 and 0.02 Å -1 , respectively.<br />
At low surfactant concentration (Z = 0.5 and 0.7), we analyze the SANS data by Guinier<br />
analysis over the q range between 0.07 Å -1 and 0.17 Å -1 . For Z = 0.5, we find a radius of gyration<br />
R G = 18 ± 0.1 Å, which corresponds to an actual micelle radius, R Mic of 23 Å via<br />
RMic 5 3R G<br />
assuming homogeneous particles. These results suggest that the particles<br />
detected by SANS are spherical micelles. For the PAM-b-PAA/DTAB mixed systems, most of<br />
Br - is replaced by polyacrylate. Therefore DTA+ micelles are considered to be decorated by<br />
one or several PAM-b-PAA as shown in Fig. 3a.<br />
The SANS intensity at intermediate and low q-region have been interpreted as arising from<br />
spherical and homogeneous particles. To determine the core size of the collidal complexes<br />
formed by the system at Z C < Z, the SANS curves are fitted assuming a Gaussian distribution<br />
of spherical and homogeneous micelles of average core radius R C and of standard deviation<br />
R . At sufficiently low concentration, the inter-micelle interactions are negligible; therefore the<br />
structure factor is 1. By using the form factor for homogeneous spheres, we obtain the values<br />
for R C at Z = 0.7, 1 and 2 are 145 ± 06 Å, 123 ± 0.4 Å and 111 ± 4.2 Å, respectively. At large<br />
q (0.1 Å -1 < q ), and at Z C < Z, the scattering is characterized by a structure peak located<br />
around q 0<br />
= 0.16 Å -1 . This peak corresponds to the characteristic distance 2/q 0 40 Å, and<br />
is independent of Z. Using the analogy with the homopolyelectrolyte/surfactant concentrated<br />
phases, the core is constituted of densely packed surfactant micelles (DTA + ), and PAA block<br />
chains bind to these micelles, displace their counteranions (Br - ) and bridge them together.<br />
The intermicellar distance of the DTA + micelles decorated by PAA block chains in the interior<br />
is ~ 40 Å. The outer part of the colloidal complex is corona chains made of thermosensitive<br />
PNIPAM chains (Fig. 3b).<br />
Fig. 2b shows the scattering intensityobtained from 0.5 wt.% PAM-b-PAA/DTAB solutions in<br />
D 2 O at Z = 1 for different NaBr concentration. Although the characteristic feature of the scattering<br />
profiles are the same as salt-free system, the damped oscillation in the intensity decay<br />
around 0.05 Å -1 disappear and the structure peak located at q 0 ~ 0.16 Å -1 shifts to lower q.<br />
These results suggest that electrostatic interaction between DTA + micelle and polyacrylate<br />
block become weaker with increasing salt concentration in the system.<br />
Figure 2: (a) SANS profiles for 0.5 wt.% aqueous solutions of<br />
PAM-b-PAA/DTAB with different charge ratio Z at 25 °C. (b)<br />
SANS profiles for 0.5 wt.% aqueous solution of PAN-b-<br />
PAA/DTAB with charge ratio Z = 1 at different NaBr concentration.<br />
Figure 3: Schematic representtion<br />
of (a) DTA + micelle decorated by<br />
PAM-b-PAA (Z < Z C ), and (b) a<br />
colloidal complex formed by the<br />
association of AM-b-PAA and<br />
DTAB (Z C < Z).<br />
48
EXPERIMENTAL REPORT<br />
GeNF<br />
SANS-1<br />
Contrast variation in small-angle neutron scattering by water-based ferrofluid<br />
with surfactant/polymer stabilization<br />
Proposer:<br />
Co-Proposer(s):<br />
Experimental Team:<br />
Head of Institute:<br />
Instrument Responsible:<br />
Date(s) of Experiment: 1 st – 10 th July 2008<br />
P. Kopcansky 1 , 1 IEP, Kosice, Slovak Republic<br />
M.V. Avdeev 2 , 2 FLNP, JINR, Dubna, Russia<br />
M. Koneracka 1<br />
A.V. Feoktystov 3 , 3 GKSS Research Centre <strong>Geesthacht</strong>, Germany<br />
P. Kopcansky 1<br />
V. Haramus 3<br />
Objectives<br />
The key parameters of the behaviour of magnetic particles in ferrofluids (fine liquid dispersions<br />
of magnetic materials stabilized usually with surfactants) are related to the nature of<br />
their surface. Magnetic fluids are very promising systems for medical applications. For biocompatible<br />
systems the chemical composition of the surface is especially important to avoid<br />
the action of the reticuloendothelial system (RES), which is a part of the immune system, in<br />
order to increase the half-life of magnetic fluid in the blood stream. Coating the magnetic<br />
particles with a neutral and hydrophilic compound – poly(ethylene glycol) (PEG), the circulatory<br />
half-life increases from minutes to hours or days [1]. The object of investigations in the<br />
present study was a water-based magnetic fluid (magnetite) where initial stabilizer sodium<br />
oleate (C 17 H 33 COONa) was substituted with PEG [2].<br />
Experiment<br />
The investigated magnetic fluids were synthesized at the Institute of Experimental Physics of<br />
the Slovak Academy of Sciences (Kosice, Slovak Republic). They were investigated by<br />
small-angle scattering of non-polarized neutrons (SANS) in the absence of external magnetic<br />
field. The contrast variation with H/D substitution was used. The initial sample (volume fraction<br />
of magnetite about 2 %) was dissolved with the ratio 1:4 by different mixtures of<br />
light/heavy water to achieve various D 2 O contents in the final fluid.<br />
Achievements and Main Results<br />
The studied ferrofluids show a complex multi-level and multicomponent structure. The experimental<br />
data were treated in terms of approach [3], which takes into account polydispersity<br />
and magnetic scattering. The experimental SANS curves at different D 2 O content in the<br />
carrier are presented in Fig.1. The change in the character of the curves repeats that seen in<br />
similar experiments [4] on a water-based ferrofluid with nanomagnetite sterically stabilized by<br />
a double layer of dodecylbenzenesulphonic acid (DBS). Because of the large size of the<br />
mentioned aggregates no specific Guinier regime can be resolved in the initial parts of the<br />
curves. In this case the effective match point of the system (effective content of D 2 O when<br />
the scattering is minimal) cannot be related to forward scattering intensity. Nevertheless, as it<br />
was noted [3] the choice of this parameter for polydisperse systems is entirely arbitrary.<br />
Here, we have built dependences of scattering intensities on D 2 O content in the solvent<br />
at different values of q and found out their minima (i.e. effective match points). The full<br />
49
q-dependence of the effective match point is shown in Fig. 2. Two regions where it does not<br />
change much can be seen. They can be related to match points of about 45 and 5 % corresponding<br />
to two kinds of particles in the fluid, aggregates containing magnetite particles and<br />
micelles of free surfactant in the solution. From the first match point we estimated the volume<br />
fraction of magnetite in the aggregates as 37 %.<br />
The found modified shape basic function [3] is plotted in Fig. 3. It points out also two levels of<br />
aggregation: large (size more than 120 nm) fractal clusters with mass fractal dimension of<br />
2.5 and spherical micelles of free sodium oleate with radius of about 2.1 nm. The corresponding<br />
IFT fit gives parameters R g = 1.59 0.05 nm, I(0) = (0.021 0.001) × 10 −20 cm 3 . It is important<br />
that the aggregates show stability with respect to temperature increase up to 80 o C.<br />
Intensity, cm -1<br />
10<br />
1<br />
0.1<br />
0.01<br />
0% D2O<br />
10% D2O<br />
20% D2O<br />
30% D2O<br />
40% D2O<br />
50% D2O<br />
60% D2O<br />
70% D2O<br />
Match Point, D 2<br />
O vol. %<br />
50<br />
40<br />
30<br />
20<br />
10<br />
match point<br />
of aggregates<br />
match point<br />
of micelles<br />
1E-3<br />
0.1 1<br />
q, nm -1<br />
Figure 1: Changes in the SANS curves with<br />
the contrast variation on the studied ferrofluid.<br />
Percent volume fraction of D 2 O in the solvent is<br />
indicated. Volume fraction of dispersed magnetite<br />
in the samples, m , is less than 0.5 %.<br />
0<br />
0.0 0.2 0.4 0.6 0.8 1.0<br />
q, nm -1<br />
Figure 2: Dependence of the effective match<br />
point on q-value for the studied magnetic<br />
fluid. Two specific regions are distinguished.<br />
Intensity, x10 -20 cm 3<br />
1<br />
0.1<br />
0.01<br />
1E-3<br />
1E-4<br />
1E-5<br />
p(r)<br />
0.04<br />
0.03<br />
aggregates<br />
~q -2.5 Ic<br />
micelles<br />
0.02<br />
0.01<br />
0.00<br />
0 1 2 3 4 5<br />
r, nm<br />
Figure 3:<br />
Experimentally obtained shape scattering<br />
basic function. Different scattering levels corresponding<br />
to two different kinds of particles<br />
are indicated. The line shows fit of the curve,<br />
which takes into account the power-law type<br />
scattering from aggregates (low q-values)<br />
and scattering from micelles (large q-values).<br />
Inset shows PDD for the “micelle part” of the<br />
scattering curve.<br />
0.1 1<br />
q, nm -1<br />
Acknowledgement<br />
Projects VEGA 0077, APVV -0509-07, APVV-99-02605, as well as project RFBR-<strong>Helmholtz</strong><br />
(HRJRG-016) are acknowledged.<br />
References and Notes<br />
[1] N. Tomašovičová, M. Koneracká, P. Kopčanský, M. Timko, V. Závišová, Meas. Sci. Rev. 6 (2006) 32<br />
[2] M. Timko, M. Koneracka, P. Kopcansky, et al., Indian J. Eng. Mater. Sci. 11 (2004) 276<br />
[3] M.V. Avdeev, J. Appl. Cryst. 40 (2007) 56<br />
[4] M. Balasoiu, M.V. Avdeev, V.L. Aksenov, D. Hasegan, V.M. Garamus, A. Schreyer, D. Bica, L. Vékás,<br />
J. Mag. Mag. Mater. 300 (2006) e225<br />
50
EXPERIMENTAL REPORT<br />
GeNF<br />
SANS-1<br />
The influence of angiotensin II on structural changes in lipid dispersions<br />
Proposer:<br />
Co-Proposer(s):<br />
Experimental Team:<br />
Head of Institute:<br />
Instrument Responsible:<br />
Julia Preu 1 , 1 Membrane Biophysics Group, Niels Bohr Institute,<br />
Blegdamsvej 17, 2100 København Ø, Denmark<br />
Thomas Gutberlet 2 , 2 Jülich Center for Neutron Science, c/o TU<br />
Munich, Lichtenbergstr. 1, 85747 Garching, Germany<br />
Thomas Heimburg 1<br />
Vasyl Haramus 3 , 3 GKSS Research Centre <strong>Geesthacht</strong>, Germany<br />
Date(s) of Experiment: 31 st October – 4 th November 2008<br />
Objectives<br />
The renin-angiotensin system plays a critical role in circulatory homeostasis. Part of this system<br />
is the peptide hormone Angiotensin II (Ang II), a potent vasoconstrictor that aids in the<br />
blood pressure regulation, as well as in body fluid balance maintenance. Ang II derives from<br />
the precursor angiotensinogen, through enzymatic reaction catalyzed by renin and the angiotensin<br />
converting enzyme (ACE). On the heart, acting in both endocrine and paracrine fashions<br />
Ang II regulates contractility, remodelling, growth, apoptosis, and reduces cell coupling<br />
and conduction velocity in cardiac muscles. Ang II has two major receptor subtypes, the Ang<br />
II type 1 receptor (AT 1 receptor) and the Ang II type 2 receptor (AT 2 receptor). From a pathophysiological<br />
point of view, like in renal diseases or hypertension, changes in the reninangiotensin<br />
system occurred. Hypertension can be treated by β-blockers, inhibiting the conversion<br />
of angiotensinogen to angiotensin I, or by specific inhibition of the AT1-receptor by<br />
an Ang II antagonist like Losartan and its active derivate E-3174.<br />
Theodoropoulou et al. studied the molecular basis of the interaction of Losartan with membranes,<br />
using differential scanning calorimetry (DSC) and electron spin resonance spectroscopy<br />
(ESR) [1]. Mimicking the cell membrane employing dimyristoyl phospatidylcholine<br />
(DMPC) dispersion, they observed, with increased concentration of Losartan, a thermodynamic<br />
behaviour typical for the analogue charged lipid dimyristoyl phospatidylglycerol<br />
(DMPG).<br />
Studying DMPC dispersions by differential scanning calorimetry (DSC) which contained Ang II<br />
showed changes in the thermodynamic behaviour. Depending on the concentration of the<br />
peptide the onset of the pretransition and the main transition change. Ang II also adopts a<br />
well-defined structure in a phospholipid environment, as studied by Carpenter et al. using<br />
NMR [2]. Our interest focuses on the concentration-dependent structural changes induced by<br />
the insertion of Ang II on pure lipid dispersions, studied at different temperatures.<br />
Experiment<br />
To mimick a cell membrane a mixture of DMPC and DMPG (90:10, w/w) was dissolved in<br />
chloroform and methanol. The organic solvent was evaporated under a nitrogen stream and<br />
remaining traces of the solvent were removed under storage in a dessicator under vacuum.<br />
For the sample preparation the lipid films were rehydrated in a buffer contraining different<br />
amounts of the peptide hormone Angiotensin II. For all preparations the same lipid concen-<br />
51
tration was used and unilamellar vesicles were produced by extrusion at a temperature<br />
above the main phase transition. The contrast of solvent towards the lipid mixture was varied<br />
using pure D 2 O as a solvent for the sample preparation. Measurements were repeated for<br />
three different temperatures, 15 °C, 22 °C and 35 °C.<br />
Achievements and Main Results<br />
The measurements provided evidence that there is a weak concentration-dependent interaction<br />
between the membrane surface and Ang II. Changes occur mainly in the high q-ranges,<br />
showing decreased scattering intensities with increasing Ang II concentrations.<br />
The thickness of the bilayer remains unchanged, suggesting an interaction of the peptide<br />
with the surface. A detailed data analysis is under progress.<br />
References<br />
[1] Theodoropoulou et al., Biochimica et Biophysica Acta (1999) 1461: 135–146<br />
[2] Carpenter, K.A. et al., Eur. J. Biochem. (1998) 251: 448–453<br />
52
EXPERIMENTAL REPORT<br />
GeNF<br />
SANS-1<br />
Proposer:<br />
Co-Proposer(s):<br />
The Study of Interaction between Surfactin and Hemoglobin by SANS<br />
Aihua Zou 1 , 1 East China Unicersity of Science and Technology,<br />
Engineering, Shanghai, China<br />
Experimental Team:<br />
Head of Institute:<br />
Instrument Responsible: Vasyl Haramus 2 , 2 GKSS Research Centre <strong>Geesthacht</strong>, Germany<br />
Date(s) of Experiment: 11 th – 20 th November 2008<br />
Objectives<br />
The proposed project aims to study the interaction between hemoglubin (Hb) and surfactin.<br />
Surfactant-protein interactions have been great interest in the fields of medicine, chemistry,<br />
biology, cosmetics, drug delivery [1, 2]. Despite a large number of reports devoted to the<br />
characterization of Hemoglobin (Hb)/chemical surfactant complexes, a study that combines<br />
biosurfactant surfactin with Hb under identical experimental conditions is still missing. The<br />
SANS study in this project will be helpful to expatiate upon the conformation change of Hb in<br />
surfactin micelles, and to understand the binding capacity and electron transfer of Hb by surfactin<br />
more thoroughly. The knowledge of the interaction between Hb and surfactin may open<br />
up new avenues for the design of the biosurfactant in health care and biotechnology application.<br />
Experiment<br />
Surfactin (Fig.1) was originally obtained from the cell free broth of Bacillus subtilis HSO121 in<br />
our laboratory [3, 4]. 0.01M phosphate buffer (PD = 7.4) was used to prepare the samples.<br />
The quartz cuvettes (2 mm path length) containing the sample solutions were placed in a<br />
thermostatted sample holder to maintain a temperature of 20 o C.<br />
Figure 1:<br />
The structure of surfactin.<br />
Asp<br />
HO<br />
O<br />
O<br />
Leu<br />
H<br />
N<br />
O<br />
H<br />
N<br />
O<br />
NH<br />
Leu<br />
Val<br />
O<br />
HN<br />
O<br />
NH<br />
O<br />
Glu<br />
O<br />
NH O<br />
OH<br />
O<br />
Leu<br />
N<br />
H<br />
O<br />
Leu<br />
Achievements and Main Results<br />
Our SANS experiments were started with free Hb in PBS buffer (Fig. 2a). With the addition of<br />
surfactin, the scattering intensities of Hb were clearly increased. Due to poor contrast, scattering<br />
intensity for Hb sample in PBS buffer was very low at low q, we attend to extract infor-<br />
53
mation on the local structure of Hb by applying the indirect Fourier transformation (IFT) to the<br />
experiment data from the high-q range. IFT analysis gave a the apparent radius of gyration of<br />
23.9±0.6 Å for Hb in PBS buffer. And the apparent radius of gyration decreased to<br />
23.11±0.35 Å with the surfactin concentration at 2.4x10 -4 mol/L. The pair distance distribution<br />
function of Hb in PBS buffer exhibits a shape that is quite characteristic of an almost homogeneous<br />
locally spherical structure, and we obtain a first estimate of the diameter from the<br />
maximum distance of approximately 65 Å. This result is similar to those reported on Hb in<br />
literature [5]. P(r) function (Fig. 2b) showed that Hb in aqueous solution has a more compact<br />
structure than that with the surfactin, indicating that there are some interaction between surfactin<br />
and Hb. Details analysis is currently being carried out to understand how Hb conformation<br />
is changed with the addition of surfactin.<br />
0.1<br />
Hb, 0.25 g/l, surfactin, 0 mol/l<br />
Hb, 0.25 g/l, surfactin, 0.9x10 -4 mol/l<br />
Hb, 0.25 g/l, surfactin, 1.6x10 -4 mol/l<br />
Hb, 0.25 g/l, surfactin, 2.4x10 -4 mol/l<br />
0.00010<br />
0.00008<br />
Hb, 0.25 g/l, surfactin, 0 mol/l<br />
Hb, 0.25 g/l, surfactin, 0.9x10 -4 mol/l<br />
Hb, 0.25 g/l, surfactin, 1.6x10 -4 mol/l<br />
Hb, 0.25 g/l, surfactin, 2.4x10 -4 mol/l<br />
I (cm -1 )<br />
0.01<br />
p(r) (relative unit)<br />
0.00006<br />
0.00004<br />
1E-3<br />
0.00002<br />
0.01 0.1<br />
q (A -1 )<br />
(a)<br />
0.00000<br />
0 10 20 30 40 50 60 70<br />
Figure 2: Effect of the surfactin on SANS spectra of Hb in in 0.01 M phosphate buffer (pD = 7.4):<br />
(a) SANS spectra of Hb at different surfactin concentrations;<br />
(b) Pair distance distribution P(r) function obtained from the corresponding scattering curves in (a).<br />
r (A)<br />
(b)<br />
References<br />
[1] A. Chakraborty, D.Seth, P. Setua, N. Sarkar, J. Phys. Chem. B 110 (2006) 16607-16617.<br />
[2] M. Orioni, C. Roversi, F. La Mesa, G. Asaro, G. Pellizer, D. Errico, J. Phys. Chem. B 110 (2006)<br />
12129-12140.<br />
[3] C.S. Song, R.Q. Ye, B.Z. Mu, Colloids Surf. A 302 (2007) 82–87.<br />
[4] H. Namir, X.Y. Liu, S.Z. Yang, B.Z. Mu, Prot. Pept. Lett. 15 (2008) 265–269.<br />
[5] Wenjie Liu, Xia Guo, Rong Guo, International Journal of Biological Macromolecules 41 (2007)<br />
548–557.<br />
54
EXPERIMENTAL REPORT<br />
GeNF<br />
SANS-1<br />
A SANS investigation of Polycarbonate/Poly(styrene-co-acrylonitrile) blends<br />
Proposer:<br />
Co-Proposer(s):<br />
Demiao Lin 1 , 1 GKSS Research Centre <strong>Geesthacht</strong>, Germany<br />
Volker Abetz 1<br />
Experimental Team:<br />
Head of Institute:<br />
Instrument Responsible:<br />
Adriana Boschetti 1<br />
Volker Abetz 1<br />
Vasyl Haramus 1<br />
Date(s) of Experiment: 15 st – 18 th April 2008<br />
Objectives<br />
Early stage of spinodal decomposition in nanometer length scale is a very important issue in<br />
understanding the thermodynamics and optimizing morphology and mechanical properties of<br />
polymer blends. The kinetics follows Cahn-Hilliard-Cook model for early stage spinodal decomposition.<br />
Polycarbonate/Poly(styrene-co-acrylonitrile) (PC/SAN) is a kind of thermoplastics<br />
which is widely used in automotive industry. In most cases, PC/SAN blends are immiscible<br />
and only PC, SAN oligomers of molecular weight not higher than 3000g/mol [1, 2] can<br />
form one phase (homogeneous) blends . In another blend of PC/PMMA which was also reported<br />
to be immiscible in most cases, C.C.Han and coworkers [3] were able to prepare a<br />
trapped miscible state by a fast solution casting method. Considering the similar situation of<br />
the system, we are aiming to study the kinetics and thermodynamics of PC/SAN blends starting<br />
from a kinetics trapped miscible state.<br />
Experiment<br />
Deuterated-SAN (25 wt.% AN) synthesized by ARGETR ATRP(activators regenerated by<br />
electron transfer atom transfer radical polymerization) from deuterated Styrene monomer and<br />
protonated Acrylonitrile. The Mw and Mw/Mn of d-SAN and PC are respectively 44170 g/mol,<br />
1.15 and 39100g/mol,1.80. PC/d-SAN 50/50 samples for SAN were prepared by dissolving<br />
50:50 PC/SAN in THF solution, the total concentration for the blends is about 5 wt.%. The<br />
solution was then cast onto silica wafer at ca. 50 °C to make a miscible blend. SANS measurement<br />
was carried out at 25 °C in a very large q range in order to find out the location of<br />
the structure peak.<br />
Achievements and Main Results<br />
From Figure 1, it is clear that PC/d-SAN 50/50 has already phase separated to relatively<br />
huge domains, so that I (q) has a peak at very low q value, if it shows a peak at all at this late<br />
stage of phase separation. In Figure 2, I (q) is plotted to q -4 which is quite linear except the<br />
last point and this scaling relationship means that there is a very sharp interface in the phase<br />
boundary of PC/SAN, typical for strongly segregated systems.<br />
55
100<br />
PC/d-SAN 50/50<br />
25 o C<br />
200<br />
150<br />
PC/d-SAN 50/50<br />
25 o C<br />
10<br />
100<br />
I(q)<br />
I(q)<br />
1<br />
50<br />
0<br />
0.1<br />
0.05 0.10 0.15 0.20 0.25 0.30<br />
q (A -1 )<br />
0.00E+000 2.00E+008 4.00E+008 6.00E+008 8.00E+008 1.00E+009<br />
q -4<br />
Figure 1: Scattering Intensity as a function of<br />
scattering vector for PC/d-SAN 50/50 at 25 °C.<br />
Figure 2: Scattering Intensity as a function<br />
of q -4 for PC/d-SAN 50/50 at 25 °C.<br />
References<br />
[1] T.A. Callaghan, K. Takakuwa, D.R. Paul and A.R. Padwa, Polymer, 34,3796-3808 (1993).<br />
[2] Hongguo Li, Ying Yang, Reiko Fujitsuka, Toshiaki Ougizawa, Takashi Inoue. Polymer, 40, 927–933<br />
(1999).<br />
[3] M. Motowoka, H. Jinnai, T. Hashimoto Y. Qiu and C.C. Han J. Chem. Phys. 3, 2095-2100(1999).<br />
56
EXPERIMENTAL REPORT<br />
GeNF<br />
SANS-2<br />
Small-angle scattering instrument SANS-2<br />
Short Instrument Description:<br />
Small angle neutron scattering using cold non-polarised/polarised neutrons is a powerful tool<br />
for investigating the structure of matter in the range between 1 and 100 nm. It is a non destructive<br />
method with a wide range of applications in:<br />
– Metal physics (precipitates, clusters, interfaces, grain boundaries,...)<br />
– Materials science (defects, porosity,....)<br />
– Nanocrystalline materials (grain size, magnetic structures,...)<br />
– Polymers and polymer systems (blends, mixtures, structure and morphology,...)<br />
– Biology (viruses, proteins,...)<br />
– Complex liquids (microemulsions, colloids, liquid crystals,...)<br />
Local Contact:<br />
Dr. Melissa Sharp<br />
Phone/Fax : +49 4152 87-1209 / +49 4152 87-1338<br />
e-mail: melissa.sharp@gkss.de<br />
Helmut Eckerlebe<br />
Phone/Fax : +49 4152 87-1202 / +49 4152 87-1338<br />
e-mail: helmut.eckerlebe@gkss.de<br />
Schematic View of SANS-2:<br />
57
Instrument Details:<br />
Beamline:<br />
Monochromator:<br />
beamline 8 – cold neutron guide NG-2, radius of<br />
curvature R = 900 m, cross section 3 x 4 cm 2<br />
helical slot velocity selectors (Dornier)<br />
Wavelength range at<br />
sample position:<br />
0.3 to 2.0 nm<br />
Wavelength resolution:<br />
Δλ/λ = 0.1 (2 additional velocity selectors with<br />
Δλ/λ = 0.05 and 0.2 available)<br />
Length of collimation:<br />
max. 16 m (2 m elements)<br />
Flux at sample position:<br />
max = 2·10 7 cm -2 s -1 (1 m collimation, λ = 0.5 nm)<br />
Range of momentum transfer:<br />
0.01 ≤ q ≤ 3 nm -1 (small-angle scattering)<br />
q ≤ 25 nm -1 (wide-angle scattering with 2. detector)<br />
Distance sample to detector:<br />
1.0 m ≤ d ≤ 22 m<br />
optional 2. detector for wide angles: d = 1 m<br />
Detector:<br />
active area:<br />
resolution:<br />
background:<br />
2-dim position-sensitive 3 He-counter<br />
50 x 50 cm 2<br />
0.25 x 0.25 cm 2<br />
< 0.5 cps<br />
Supplementary equipment:<br />
– several electro-magnets up to 2.0 T (horizontal and<br />
vertical fields)<br />
– superconducting magnets up to 5.0 T<br />
– several cryostats (4– 400 K)<br />
– furnace (-30 °C to +900 °C, atmospheric condition,<br />
inert gas and vacuum)<br />
– linear translation, rotary, tilting and lift tables (freely<br />
programmable sample position)<br />
– “HOLONS”: holographic combined with SANS setup<br />
(see table A)<br />
Special features:<br />
– Sample environment space is variable from a few mm<br />
up to 2500 mm<br />
– User-friendly software for data reduction and<br />
evaluation running on PC (SANDRA a. o.)<br />
58
EXPERIMENTAL REPORT<br />
GeNF<br />
SANS-2<br />
Micellar solutions from thermo-responsive triblock copolymers studied<br />
using SANS<br />
Proposer:<br />
Co-Proposer(s):<br />
Christine M. Papadakis 1<br />
Amit Kulkarni 1<br />
1 Technische Universität München, Physikdepartment E13<br />
Experimental Team:<br />
User Group Leader:<br />
Instrument Scientist:<br />
Christine M. Papadakis 1 , Amit Kulkarni 1 ,<br />
Joseph Adelsberger 1 , Melissa Sharp 2<br />
Christine M. Papadakis 1<br />
Melissa Sharp 2 , 2 GKSS Research Centre <strong>Geesthacht</strong>, Germany<br />
Date(s) of Experiment: 23 rd –26 th November 2007, 15 th –20 th April 2008<br />
Objectives<br />
Stimuli-responsive polymers react strongly to even weak changes of their environment and<br />
are therefore of interest for a number of applications, such as drug delivery systems, sensors<br />
and micromechanics [1]. So far, macroscopic gels [2], microgels [3], and core-shell lattices<br />
with a cross-linked hydrophobic core and a cross-linked thermo-responsive shell [4] have<br />
been studied. An alternative approach is based on physically connected (micellar) gels from<br />
amphiphilic block copolymers with a responsive hydrophilic block and a hydrophobic block<br />
[5–8]. They have the advantage that the building blocks, i.e. the micelles, are much smaller<br />
than in chemically connected microgels and are thus expected to react faster to a change of<br />
temperature, and that the gels can easily be reshaped. We have investigated triblock copolymers<br />
having a thermo-responsive middle block and two short hydrophobic end blocks.<br />
Experiment<br />
Two triblock copolymers with deuterated polystyrene (dPS) end blocks having N dPS = 10 and<br />
a poly(N-isopropylacrylamide) (PNIPAM) middle block having N PNIPAM = 254 or 387 were<br />
studied by small angle neutron scattering (SANS) at the SANS-2 instrument at GKSS,<br />
<strong>Geesthacht</strong>. The wavelength was 0.58 nm, and the sample-to-detector distance was varied<br />
between 1 and 9 m. The sample temperature was varied between 25 and 36 °C. The isotropic<br />
scattering was azimuthally averaged, the transmission-corrected background due to the cell<br />
and the solvent was substracted, and the intensities were brought to absolute scale using a<br />
vanadium single crystal. All these operations were carried out using the software SANDRA<br />
[9]. D 2 O or a D 2 O/H 2 O mixture of ratio 17/83 were used to contrast-match the dPS core or<br />
the PNIPAM shell. In this way, a micellar solution of the short copolymer at a concentration of<br />
5 wt.-% was studied in D 2 O and concentrated micellar solutions from both copolymers at<br />
18 wt.-% were studied both in D 2 O and in D 2 O/H 2 O.<br />
Achievements and Main Results<br />
Fig. 1a shows SANS curves of a concentrated micellar solution in D 2 O at various temperatures.<br />
Here, the scattering is mainly due to the PNIPAM shells. The curves can be modelled<br />
by spherical core-shell particles having a liquid-like correlation represented by a Percus-<br />
Yevick structure factor. Above the LCST of 32 °C, the correlation peak is strongly shifted to<br />
59
higher q-values which reflects the aggregation of water-insoluble micelles, i.e. a sudden reduction<br />
of their distance. Moreover, strong forward scattering is observed above the LCST,<br />
i.e. the collapsed micelles form big clusters.<br />
Figure 1: SANS curves of the triblock copolymer with N dPS = 10 and N PNIPAM = 387 in an 18 wt.-% solution<br />
in (a) D 2 O and (b) D 2 O/H 2 O at 25 °C (squares), 28 °C (triangles up), 30 °C (circles), 33 °C (triangles<br />
down) and 36°C (diamonds).<br />
Similar results have been found in D 2 O/H 2 O (Fig. 1b). Here, only the dPS cores contribute to<br />
the scattering, thus the minima of the form factor are shifted to higher q-values than in D 2 O.<br />
These minima do not change position at the LCST, i.e. the core radius is unaltered, as expected.<br />
The correlation peak, which reflects the distance of the micelles, changes position in<br />
the same way as in D 2 O. Cooling back below the LCST (not shown) revealed that the switching<br />
behavior is reversible.<br />
In summary, the experiment was very succesful. We found that the micelles formed by the<br />
partially deuterated triblock copolymers show a reversible collapse transition of the PNIPAM<br />
shell at the LCST of 32 °C. Above, the collapsed micelles decrease their distance and form<br />
big clusters. SANS allowed us to gain detailed information on the structure and its changes<br />
on a large range of length scales.<br />
This work was financially supported by DFG in the priority program 'Intelligent hydrogels'<br />
(SPP1259).<br />
References<br />
[1] Das, M.; Zhong, H.; Kumacheva, E.; Ann. Rev. Mater. Res. 36 (2002), 117–311.<br />
[2] Hirokawa, Y.; Tanaka, T.; Matsuo, E. S.; J. Chem. Phys. 81 (1984), 6379–6380.<br />
[3] Hellweg, T.; Kratz, K.; Pouget, S.; Eimer, W.; Coll. Surf. A 202 (2002), 223–232.<br />
[4] Dingenouts, N.; Norhausen, C.; Ballauff, M.; Macromolecules 31 (1998), 8912–8917.<br />
[5] Zhou, X.; Ye, X.; Zhang, G.; J. Phys. Chem. B 111 (2007), 5111–5115.<br />
[6] Troll, T.; Kulkarni, A.; Wang, W.; Darko, C.; Bivigou Koumba, A.M.; Laschewsky, A.; Müller-<br />
Buschbaum, P.; Papadakis, C.M.; Colloid Polym. Sci. 286 (2008) 1079–1092.<br />
[7] Wang, W.; Troll, K.; Kaune, G.; Metwalli, E.; Ruderer, M.; Skrabania, K.; Laschewsky, A.; Roth,<br />
S.V.; Papadakis, C.M.; Müller-Buschbaum, P.; Macromolecules 41 (2008), 3209–3218.<br />
[8] Jain, A.; Kulkarni, A.; Bivigou Koumba, A.M.; Wang, W.; Busch, P.; Laschewsky, A.; Müller-<br />
Buschbaum, P.; Papadakis, C.M.; Macromol. Symp., submitted.<br />
[9] P. Biemann, M. Haese-Seiller, P. Staron, Physica B 276-278 (2000), 156.<br />
60
EXPERIMENTAL REPORT<br />
GeNF<br />
SANS-2<br />
In Vitro-Studies of Nanoparticle Dispersions<br />
Proposer:<br />
Co-Proposer(s):<br />
Experimental Team:<br />
User Group Leader:<br />
Instrument Responsible:<br />
Peter Albers 1 , 1 AQura GmbH, Germany<br />
Michael Hagemann 2 , 2 Evonik Degussa GmbH, Germany<br />
Christian Schulze Isfort 2<br />
Peter Albers 1<br />
Michael Hagemann 2<br />
Melissa Sharp 3 , 3 GKSS Research Centre <strong>Geesthacht</strong>, Germany<br />
Peter Albers 1<br />
Melissa Sharp 3<br />
Date(s) of Experiment: 8 th –12 th December 2008<br />
Objectives<br />
The impact of inorganic nanoparticles on the environment has become an area of concerted<br />
study in both the EU and the US. This is because of concerns about possible negative<br />
effects of nanomaterials on human health and biological systems in general given their widespread<br />
application (e.g. as pigments, fillers, in sun screens, etc.). In Germany a new initiative,<br />
NanoCare, has been established between biologists, chemists, toxicologists and material scientists<br />
from universities (Saarbrücken, Münster and Bielefeld), the Forschungszentrum Karlsruhe<br />
and the industry (BASF, Bayer, Solvay, Evonik) to look into these issues.<br />
In the current experiments the Evonik product AEROXIDE ® TiO 2 P25, a titanium dioxide with<br />
a specific surface area of about 50 m 2 /g and a primary particle size of about 21 nm, was<br />
studied by SANS. Goal of the experiments was to determine the size and shape of the<br />
nanoparticle aggregates in the presence of proteins and lipids under physiological conditions.<br />
Additionally, by discriminating between the scattering contribution of inorganic and organic<br />
matter of similar size one should be able to determine the adsorption of biological material<br />
onto the surface of the aggregates or any other interaction of the two.<br />
The SANS-experiments were performed complementary to the characterization of the size<br />
distribution and the particle morphology of the aggregates (TiO 2 P25) by Dynamic Light Scattering<br />
(DLS), Analytical Ultracentrifugation (AUC), X-ray AUC, Transmission Electron Microscopy<br />
(TEM), Cryo-TEM and, finally, Energy Dispersive X-ray (EDX) Nanoanalysis in a Field<br />
Emission TEM (FE-TEM) to cross check particle sizes and compositions.<br />
Experiment<br />
The SANS measurements were carried out with the SANS-2 instrument at the <strong>Geesthacht</strong><br />
Neutron Facility (GeNF). Dispersions of AEROXIDE ® TiO 2 P25 in Fetal Calf Serum (FCS),<br />
Dulbecco’s Modified Eagles’s Medium (DMEM) and D 2 O were studied as in vitro experiments.<br />
A rotating sample rack was used to avoid settling of the dispersed material. The experiments<br />
were performed utilizing a polarized neutron beam with the polarisation P 0 = 0.95<br />
and a mean wavelength of λ = 5.8 Å (Δλ/λ = 0.1). To cover a range of scattering vectors<br />
detector distances of 786 mm, 2786 mm and 8786 mm were employed with an appropriate<br />
collimation. The neutrons were detected by a 256x256 position sensitive detector. All measurements<br />
were performed at ambient temperature.<br />
The biologically sensitive samples were prepared under sterile conditions directly before the<br />
experiments. No aging effects were recognized during measurements.<br />
61
Achievements and Main Results<br />
The general goal of the experiments was to examine the interaction between the organic<br />
(enzymes, lipids) and inorganic (TiO 2 P25) matter. Therefore the first milestone of the experiments<br />
was the successful contrast matching of TiO 2 .<br />
Matchpoint P 25 : 42,8 % D2O<br />
5,0E+04<br />
4,5E+04<br />
4,0E+04<br />
The contrast point was<br />
found at a 42.8 % D 2 O in<br />
an aqueous solution.<br />
Cross Section [1/cm/sr]<br />
3,5E+04<br />
3,0E+04<br />
2,5E+04<br />
2,0E+04<br />
1,5E+04<br />
1,0E+04<br />
5,0E+03<br />
0,0E+00<br />
0 20 40 60 80 100<br />
% D2O<br />
Run 1<br />
Run 2<br />
Run 3<br />
Cross Section [1/cm/sr]<br />
1,0E+03<br />
1,0E+02<br />
1,0E+01<br />
1,0E+00<br />
1,0E-01<br />
First qualitative results<br />
show that the size of the<br />
TiO 2 particles increases,<br />
when it is dispersed in a<br />
biological medium containing<br />
proteins, lipids and<br />
salts. Quantitative analyses<br />
and a detailed fitting of the<br />
data is in preparation and<br />
will be carried out soon.<br />
1,0E-02<br />
1,0E-02 1,0E-01 1,0E+00 1,0E+01<br />
Scattering Vector [1/nm]<br />
Sample: 6,25% FCS, 5% titana; Background: 6,25% FCS<br />
Sample: 18,75% FCS, 5% titana; Background: 18,75% FCS<br />
Sample: 12,5% FCS, 5% titana; Background: 12,5% FCS<br />
Sample: 5% titania in D2O; Background: D2O<br />
References<br />
[1] Heiss, A.; Jahnen-Dechent, W; Endo, H.; Schwahn, D.; Structural Dynamics of a Colloidal Protein-<br />
Mineral Complex Bestowing on Calcium Phosphate a High Solubility in Biological Fluids; Biointerfaces,<br />
2(1) (2007), 16–20.<br />
[2] Maier, M, Hannebauer, B; Holldorff, H.; Albers, P.; Does Lung Surfactant Promote Disaggregation<br />
of Nanostructured Titanium Dioxide? J. Occ. Env. Med., 48(12) (2006), 1314-1320.<br />
[3] King, S. M.; Griffiths, P. C.; Using SANS to Study Adsorbed Layers in Colloidal Dispersions; in<br />
Applications of Neutron Scattering to Soft Condensed Matter; Ed. B.J. Gabrys; Gordon and Breach<br />
Science Publishers, New York, 2000; pp. xii and 362.<br />
[4] Perkins, S. J.; X-ray and Neutron Solution Scattering; in Modern Physical Methods in Biochemistry,<br />
Part B; Elsevier; 1988.<br />
[5] Schulze, C.; Kroll, A.; Lehr, C.-M.; Schäfer, U.F.; Becker, K.; Schnekenburger, J.; Schulze Isfort, C.;<br />
Landsiedel, R.; Wohlleben, W.; Not ready to use – overcoming pitfalls when dispersing nanoparticles<br />
in physiological media, Nanotoxicology 2(2) (2008), 51–61.<br />
62
EXPERIMENTAL REPORT<br />
GeNF<br />
SANS-2<br />
Study of novel graft copolymer systems and their solubilisation behaviour<br />
Proposer:<br />
Terence Cosgrove 1<br />
Co-Proposer(s):<br />
Beth Foster 1 , 1 School of Chemistry, University of Bristol, UK<br />
Melissa Sharp 2 , 2 GKSS Research Centre <strong>Geesthacht</strong>, Germany<br />
Experimental Team: Beth Foster 1 , Ben Cheesman 1 , Voss Gibson 1 ,<br />
Melissa Sharp 2<br />
User Group Leader: Terence Cosgrove 1<br />
Instrument Responsible: Melissa Sharp 2<br />
Date(s) of Experiment: 11 th – 14 th April 2008<br />
Objectives<br />
Commercial graft copolymers have recently been developed in our research group, comprising<br />
a polyisoprene (PI) backbone with polyethylene oxide (PEO) side chains [1]. These<br />
polymers exhibit interesting behaviour due to the higher hydrophilicity of the graft chains in<br />
comparison to the backbone, creating potential for a wide range of applications. Due to the<br />
poor solubility of polyisoprene in water, these polymers swell in aqueous solution but are not<br />
fully solubilised, even in water/methanol mixtures of up to 75% methanol. However, interestingly<br />
if the polymers are initially dissolved in a small quantity of methanol and then added to<br />
water, they retain their solubility.<br />
This novel behaviour is of particular interest since it could provide a straightforward method<br />
of incorporating hydrophobic drugs into the polymer core. Our SANS experiments therefore<br />
aimed to investigate the size and structure of the graft polymer aggregates formed on addition<br />
to water from methanol, in order to understand the mechanisms by which methanol is<br />
helping to solubilise the polymers, as well as studying the incorporation of guest molecules<br />
such as ibuprofen into the polymer suspensions.<br />
Experiment<br />
The measurements were carried out on the SANS-2 instrument, on two separate occasions.<br />
All samples were measured in 1 mm pathlength quartz Hellma cells, at 298 K, using cold<br />
neutrons with a wavelength of 5 Å. The instrument configurations were slightly different for<br />
the two sets of samples, but in both cases covered a Q range of at least 0.004-0.3 Å -1 .<br />
Achievements and Main Results<br />
The SANS data was found to fit to a ‘fuzzy sphere’ model, which models the polymer as a<br />
spherical aggregate, becoming increasingly diffuse with distance from the core [2]. This<br />
would correlate with a proposed structure of the backbone forming the core of the aggregate,<br />
surrounded by a corona made up of the graft chains. A Hayter-Penfold soft sphere potential<br />
[3,4] was used to describe interactions between aggregates. For “REV-10” graft copolymer<br />
(comprising 10 grafts of 2000 g mol -1 PEO), the aggregates show radii of approx. 67 Å. This<br />
size was only weakly affected by polymer concentration; increasing the REV-10 concentration<br />
from 0.5 to 1.6 %wt/vol caused the radius to increase from 65.9 to 69.0 Å.<br />
63
Decreasing the number of graft chains caused the scattering data to display a steep negative<br />
gradient at low Q, as shown in Figure 1, with a Q dependence of approx. -2.5. This could<br />
indicate that the aggregates are not simple spherical micelles (for instance, rod-like micelles<br />
and vesicles have been reported to be formed by certain graft copolymers [2–4]), or that<br />
there are strong attractive interactions between aggregates. Approximate Debye-Guinier<br />
fitting suggested that these aggregates have radii of around 110–120 Å, reflecting a poorer<br />
solubility and greater tendency to aggregate for polymers with fewer graft PEO chains.<br />
Figure 1:<br />
SANS data for 0.9 % wt/vol samples of<br />
REV-7 and REV-10 graft copolymers<br />
(comprising a PI backbone with an average<br />
of 3.5 and 10 graft PEO chains respectively)<br />
in 9 % h 4 -methanol, 91 % D 2 O.<br />
The solid line shows a fit to the fuzzy<br />
sphere model (data for REV-7 could not<br />
be fitted accurately due to the gradient at<br />
low Q).<br />
As shown in Figure 2, on decreasing the deuteration of the methanol used in the samples,<br />
the intensity of the scattering from the aggregates was observed to decrease. This indicates<br />
that on addition to D 2 O, methanol mixes with the solvent rather than being retained within the<br />
polymer aggregates: when h 4 -methanol is used, it raises the scattering length density of the<br />
solvent, decreasing the contrast, whereas if the methanol was localised within the polymer,<br />
the use of h 4 -methanol would increase the contrast between the aggregates and solvent.<br />
The fit parameters show that the difference in SLD between the aggregates and solvent decreases<br />
from 5.90 to 5.34x10 -6 Å -2 , which is almost exactly the change predicted if all of the<br />
methanol mixes homogeneously with the D 2 O. Furthermore, the size of the aggregates in<br />
methanol alone is very similar to that in the methanol/water mixed solvent system (both have<br />
radii of 68±2 Å), suggesting that the structure of the aggregates is not strongly affected when<br />
diluted in water. It is therefore likely that the mechanism of stabilisation is related to the<br />
polymers being able to adopt a favourable conformation when dissolved in methanol (with<br />
the soluble graft chains oriented outwards), so that they remain stable when poured into water.<br />
64<br />
Figure 2:<br />
SANS data for 0.9 % wt/vol REV-10 graft<br />
copolymer in 9 % methanol, 91 % D 2 O,<br />
with varying deuteration of the methanol.<br />
Fits omitted for clarity.
When ibuprofen is added to the polymer solutions, significant changes in the scattering are<br />
observed, as shown in Figure 3. The fitted parameters reveal that as the ibuprofen concentration<br />
of the solution is increased from 0 to 0.14 % wt/vol, the aggregates gradually increase<br />
in size from 67.0 Å to 85.2 Å, indicating uptake of ibuprofen. The increase in micellar volume<br />
is greater than the volume of ibuprofen added, therefore the ibuprofen is likely to also be<br />
causing a change in the aggregation of the polymer. The Debye length of the aggregates<br />
decreases with ibuprofen concentration, showing a weakening of the repulsive interactions<br />
between aggregates, except for the sample with highest ibuprofen content, where a change<br />
in the shape of the scattering curve is observed, which could possibly indicate changes in the<br />
polymer conformation.<br />
Figure 3:<br />
SANS data for 0.9 % wt/vol REV-10<br />
graft copolymer in 9 % h 4 -methanol,<br />
91 % D 2 O, with varying concentrations<br />
of ibuprofen. Solid lines show fits to<br />
the fuzzy sphere model. Data have<br />
been shifted vertically for clarity; the<br />
inset shows the data without shifting.<br />
Alteration of the methanol content of the samples containing ibuprofen also caused significant<br />
changes in the aggregation, with an increase in methanol leading to a decrease in the<br />
aggregate size. This reflects the increasing solubility of ibuprofen as the methanol content of<br />
the solvent is raised, causing release from the aggregates and a subsequent decrease in<br />
aggregate size. It is therefore possible that release of drug from the polymer could be triggered<br />
by alteration of the solution properties, to modify the solubility of the drug – for instance, pH<br />
or temperature changes.<br />
References<br />
[1] Cosgrove, T.; Craik-White, H.; Hasan, E.A.; Gibson, V.M.; Polymeric materials having reduced<br />
tack, methods of making the materials and chewing gum compositions containing such materials,<br />
PCT Int. Appl. (2006), WO 2006016179.<br />
[2] Steiger, M.; Richtering, W.; Pedersen, J.; Lindner, P.; Small-angle neutron scattering study of structural<br />
changes in temperature sensitive microgel colloids, J. Chem. Phys. 120 (2004), 6197–6206.<br />
[3] Hayter, J.; Penfold, J.; Self-consistent structural and dynamic study of concentrated micelle solutions,<br />
J. Chem. Soc., Faraday Trans. 1, 77 (1981), 1851–1863.<br />
[4] Hayter, J.; Zulauf, M.; Attractive interactions in critical scattering from non-ionic micelles, Colloid<br />
Polym. Sci. 260 (1982), 1023–1028.<br />
[5] Lecommandoux, S.; Checot, F.; Borsali, R.; Schappacher, M.; Deffieux, A.; Brulet, A.; Cotton, J.;<br />
Effect of dense grafting on the backbone conformation of bottlebrush polymers: determination of<br />
the persistence length in solution, Macromolecules 35 (2002), 8878–8881.<br />
[6] Li, X.; Ji, J.; Shen, J; Spontaneous vesicle formation in aqueous solutions of comb-like PEG, Macromol.<br />
Rapid Commun. 27 (2006), 214–218.<br />
[7] Li, X.; Ji, J.; Wang, X.; Wang, Y.; Shen, J.; Stability and drug loading of spontaneous vesicles of<br />
comb-like PEG derivates, Macromol. Rapid Commun. 28 (2007), 660–665.<br />
65
EXPERIMENTAL REPORT<br />
GeNF<br />
SANS-2<br />
Synthesis and characterisation of linear and<br />
six-arm star poly (styrene-sulfonate) (PSSNa)<br />
Proposer:<br />
Co-Proposer(s):<br />
Experimental Team:<br />
Terence Cosgrove 1 , 1 School of Chemistry, University of Bristol,<br />
United Kingdom<br />
Haruna Musa 1<br />
Haruna Musa 1 , Ben Cheesman 1 , Melissa Sharp 2<br />
2 GKSS Research Centre <strong>Geesthacht</strong>, Germany<br />
User Group Leader: Terence Cosgrove 1<br />
Instrument Responsible: Melissa Sharp 2<br />
Date(s) of Experiment: 17 th – 22 nd June, 2008<br />
Objectives<br />
These experiments were aimed towards investigating the properties of linear and six-arm<br />
star poly(styrene sulfonate) containing alpha-cyclodextrin core and it's inclusion complex<br />
with sodium oleate or amphiphilic poly(ethylene oxide) for potential application in topical microbicides<br />
formulation or controlled drug delivery.<br />
Poly(styrenesulfonic acid) and its salts (PSSNa) are synthetic water-soluble polymers with<br />
many applications such as flocculants, antistatic, emulsifiers, catalysts for various reactions,<br />
ion exchange resins and membranes and are also convenient models for the investigation of<br />
the properties of biopolymers [1] .<br />
Presently, there is growing interest in the synthesis of water-soluble, linear poly(styrene sulfonate)<br />
by controlled radical polymerisation techniques due to the biocompatibility and nontoxic<br />
nature of this polymers which make them potentially useful as active ingredient in topical<br />
microbicides [2, 3] . Similarly the use of polymers in controlled delivery of drugs and genes is<br />
currently receiving greater attention [4, 5] . In recent times, star-like polymers have also attracted<br />
enormous research interest due to their unique hydrodynamic properties (e.g. lower solution<br />
and melt viscosities) and multiple chain end-functionality when compared to their linear<br />
polymer counterparts [6] .<br />
However, little has been done on star poly(styrene sulfonate) containing alpha-cyclodextrin<br />
core systems. This novel system could be very useful in drug delivery in view of the non-toxic<br />
nature and biocompatibility of both PSSNa and cyclodextrins.<br />
Experiment<br />
A linear and six-arm star poly(styrene sulfonate) of molar mass 11,200 g/mol and 44051 g/mol<br />
respectively were synthesised by controlled radical polymerisation and studied by small angle<br />
neutron scattering (SANS) using the SANS-2 instrument at GKSS, <strong>Geesthacht</strong>. The wavelength<br />
was 0.58 nm, and the sample-to-detector distance was varied between 0 m and 8m.<br />
The sample temperature was maintained at 20 o C and 1 mm sample cells were used for all<br />
the measurements. The isotropic scattering was azimuthally averaged, the transmissioncorrected<br />
background was subtracted. All these operations were carried out using the software<br />
SANDRA 7 . A concentration range between 1–10 wt.-% solutions in D 2 O were initially<br />
prepared for each of linear PSSNa, star PSSNa, PEO (MW 6,000), alpha-cyclodextrin and<br />
67
sodium oleate. However, a similar scattering was observed for sample concentration of 1 and<br />
3.5 wt.-% as well as for 7 and 10 wt.-%, hence we decided to conduct our measurements on<br />
samples with concentrations of 3.5 and 10 wt.-% of the polymers. The inclusion complexes<br />
were prepared by mixing equal volumes of star polymer and PEO/ sodium oleate. Also an<br />
equal volume of 0.2 wt.-% sodium chloride was mixed with 3.5 % and 10 % solution of star<br />
PSSNa in D 2 O in order to screen any electrostatic interaction from the charged arms and the<br />
scattering of this solution was compared with that of charged-star PSSNa system (without<br />
any added salt).<br />
Achievements and Main Results<br />
Initial plot of the raw data revealed that the two different star poly(styrene sulfonate) have<br />
different scattering curves which arises as a result of shielding of anionic charge on the<br />
polymer via addition of sodium chloride. Presently fitting is in progress in order to determine<br />
the exact number of arms which is critical to the potential applications of this star polyanion<br />
as microbicides agent.<br />
Figure 1: Scattering curve<br />
of 3.5 wt.-% of six-arm star<br />
poly(styrene sulfonate) in D2O<br />
and of 3.5 wt.-% of six-arm<br />
star poly(styrene sulfonate)<br />
+ 0.2 wt.-% NaCl in D2O.<br />
This work is financially supported by Revolymer, UK and David Fairhurst, International Partnership<br />
for Microbicides, Silver Spring, MD., USA.<br />
References<br />
[1] Choi C.; Kim Y.; Polymer Bulletin, 49, (2003), 433.<br />
[2] Steven E.S.; Iris E.V.; Kevin W. and Ann E.J.; The Journal of Infectious Diseases, 189, (2004);<br />
410-9.<br />
[3] Anderson R.A.; Feathergill K.; Diao X.; Cooper M.; Kirkpatrick R.; Spear P.; Waller D.P.; Chany C.;<br />
Doncel G.F.; Herold B.; Zaneveld L.J.; J. Androl, 21, (2000), 862–875.<br />
[4] Stephen H.C.; Saltzman W.M.; Emmanuel P.G.; Journal of Controlled Release 90 (2003) 163–169.<br />
[5] Fu J.; Fiegel J.; Krauland E.; Hanes J.; Biomaterials. 23, (2002), 4425-33.<br />
[6] D. Moinard.; R. Borsali.; D. Taton and Y. Gnanou, Macromolecules,38, (2005), 7105.<br />
68
EXPERIMENTAL REPORT<br />
GeNF<br />
SANS-2 / DCD<br />
Structure of itraconazole nanoparticles as a delivery system<br />
Proposer:<br />
Co-Proposer(s):<br />
Experimental Team:<br />
User Group Leader:<br />
Instrument Responsible:<br />
Mont Kumpugdee Vollrath 1 , 1 Pharmazeutische Technologie,<br />
Technische Fachhochschule Berlin, Germany<br />
Pornsak Sriamornsak 2 , 2 Department of Pharmaceutical Technology,<br />
Silpakorn University, Thailand<br />
Kanokporn Burapapadh 1,2<br />
Melissa Sharp 3 , 3 GKSS Research Centre <strong>Geesthacht</strong>, Germany<br />
Mont Kumpugdee Vollrath 1<br />
Melissa Sharp 3<br />
Date(s) of Experiment: 11 th –15 th November 2008<br />
Objectives<br />
Itraconazole is an orally active triazole antimycotic agent, which is active against a broad<br />
spectrum of fungal species including Cryptococcus, Candida, Aspergillus, Blastomyces and<br />
Histoplasma capsulatum. This capsulatum can cause opportunistic infection in HIV infected<br />
patients [Saag 1988]. Itraconazole has a molecular formula C 35 H 38 Cl 2 N 8 O 4 and molecular<br />
weight of 705.64. Itraconazole is a weakly base drug with lipid solubility (n-octanol/water partition<br />
log 5.66 at pH 8.1) and a pK of 3.7, possessing extremely low water solubility (less than<br />
3 mg/ml in aqueous solutions). Itraconazole is ionized only at a low pH, such as gastric juice.<br />
Therefore, on oral administration, the gastric acidity is needed for adequate dissolution. The<br />
bioavailability of itraconazole is known to be increased after a meal as compared with that<br />
found in the fasting state. Thus preparation of suitable dosage form that can increase solubility<br />
of itraconazole in basic environment of human intestine is needed in order to increase<br />
drug bioavailability.<br />
Nanoparticulate dosage form consists of 10-1,000 nanometers in size of particles dispersed<br />
as colloid in various medium or matrix. These particles carry active ingredient that dissolved,<br />
entrapped or encapsulated. Nanoparticles preparation is useful in increasing of drug absorption<br />
and stability in the gastrointestinal tract. Many studies reported the use of natural and<br />
synthetic polymers as a carrier in nanoparticles formation with various techniques. Physicochemical<br />
properties of drugs, polymer and site of absorption should be considered in<br />
nanoparticles preparation [Kreuter 1994].<br />
Pectin is a natural polymer, which was applied in both pharmaceutical, food and biotechnological<br />
industries. It has been used as a thickening agent, a gelling agent and a colloidal stabilizer.<br />
Pectin was extracted from primary cell wall of higher plant, especially in citrus fruits,<br />
apple and beet root. The characteristic structure of pectin is a linear chain of α-(1-4)-linked<br />
D-galacturonic acid that forms the pectin-backbone [Van Buren 1991]. Pectin has a molecular<br />
weight of typically 50,000-150,000 dalton, varying with origin and extraction conditions.<br />
The classification of pectin depended on degrees of esterification (DE) that influenced pectin<br />
properties. Pectin is soluble in pure water and show negative charge. Low degree of esterification<br />
pectins can form water insoluble gel through the interaction between carboxylic group<br />
of pectin and divalent cation [Guo 1998], while high degree of esterification pectins can form<br />
gel with sugar in acidic environment. Moreover, pectin can be used as a good emulsifier in<br />
69
oil-in-water emulsion [Akhtar 2002]. Currently, pectin was used in many drug delivery systems,<br />
for instants, controlled release [Kubo 2004, Itoh 2007], colonic drug delivery [Wei 2008]<br />
and mucoadhesive system [Thirawong 2008].<br />
Experiment<br />
In order to form nanoparticulate dosage form, oil-in-water and chloroform-in-water emulsion<br />
were prepared using particular pectin as an emulsifier by 20-minute homogenization of a<br />
mixture of pectin solution and miglyol 812 or chloroform, respectively. Three types of pectin<br />
with different degrees of esterification were used in this study. Concentrations of pectin were<br />
varied to emulsify the mixtures at the mixing speed of 24000 rpm. Itraconazole was added in<br />
the formula by dissolving in miglyol 812 or chloroform before emulsification. The resulted<br />
emulsions were characterised by TEM, light scattering, SANS and USANS. For neutron scattering<br />
measurement the samples were dispersed in D 2 O. In addition contrast variation measurements<br />
were performed, where the D 2 O:H 2 O ratio was varied. The small-angle neutron<br />
scattering (SANS) measurements were carried out on the SANS-2 instrument at GKSS. For<br />
the measurements the sample-detector distances used were 1, 3, 9 and 21 m, together with<br />
appropriate collimation. The wavelengths used were 5.8 and 11.6 Ǻ, with the wavelength<br />
resolution being Δλ/λ = 10 %. In addition, for the oil-in-water emulsion, ultra-small-angle<br />
neutron scattering (USANS) measurements were carried out on the DCD diffractometer. The<br />
setup comprises two triple-bounce channel cut perfect Si(111) crystals. The wavelength used<br />
for this set of measurements was 4.43 Ǻ. The wavelength resolution was Δλ/λ = 1×10 -5 .<br />
The USANS data was corrected for slit-smearing and multiple scattering. The samples were<br />
placed in Hellma rectangular quartz cuvettes, which were placed in an automatic sample<br />
changer connected to a Julabo.<br />
Achievements and Main Results<br />
Pectin cu201, which is a hydrophobic polymer, acted as the most suitable one. The median<br />
droplet size of emulsion decreased with the increase of pectin concentration. Using of pectin<br />
solution (3 %w/w) provided the smallest droplet size in both oil-in-water and chloroform-inwater<br />
emulsions. An addition of itraconazole into the formula tremendously affected the<br />
emulsion droplet size of chloroform-in-water emulsion. Specifically, the size was decreased<br />
to less than one micrometer when itraconazole was added (Fig 1). The size distribution was<br />
also confirmed by light scattering (Fig. 2).<br />
70<br />
Figure 1:<br />
The TEM-picture (2550x) of<br />
the chloroform-in-water emulsion<br />
containing itraconazole, prepared<br />
by using 3 % of pectin cu201.
Figure 2: Light scattering pattern of chloroform-in-water emulsion containing itraconazole, prepared<br />
by using 3 % of pectin cu201.<br />
Emulsions prepared from pectin cu201 were investigated by neutron scattering techniques<br />
for their sizes and structures. Oil-in-water and chloroform-in-water emulsions show clearly<br />
different scattering patterns as demonstrated in Figure 3. The structure and size of the emulsion<br />
need to be calculated in the future by a suitable model fitting. The ultra-small-angle neutron<br />
scattering measurement result for the oil-in-water emulsion is shown in Figure 4.<br />
Figure 3: SANS scattering pattern of oil-in-water emulsion (green line) and chloroform-in-water emulsion<br />
(black line).<br />
71
3,00E+06<br />
2,50E+06<br />
2,00E+06<br />
Intensity<br />
1,50E+06<br />
1,00E+06<br />
5,00E+05<br />
0,00E+00<br />
0,0E+00 5,0E-03 1,0E-02 1,5E-02 2,0E-02<br />
Q (nm-1)<br />
Figure 4: USANS scattering pattern of oil-in-water emulsion.<br />
References<br />
[1] Saag M.S. and Dismukes W.E.: Azole antifungal agents: Emphasis on new triazoles. Antimicrobial<br />
Agents and Chemotherapy, 1988: 32(1): 1–8.<br />
[2] Kreuter. J.: Nanoparticles. In: Jorg Kreuter, editor: Colloidal drug delivery systems, Marcel Dekker,<br />
New York, 1994: 219–221.<br />
[3] Van Buren. J.P.: Function of pectin in plant tissue structure and firmness. In Reginald H. Walter, editor:<br />
The chemistry and technology of pectin, Academic press, New York, 1991: 1–17.<br />
[4] Guo J.H., Skinner G.W., Harcum W.W. and Barnum P.E.: Pharmaceutical application of naturally<br />
occurring water-soluble polymers. Pharmaceutical Science & Technology Today, 1998: 1: 254–261.<br />
[5] Akhtar M., Dickinson E., Mazoyer J. and Langendorff V: Emulsion stabilizing properties of depolymerized<br />
pectin. Food Hydrocolloids, 2002: 16: 249–256.<br />
[6] Kubo W., et al.: Oral sustain delivery of ambroxol from in situ-gelling pectin formulations. International<br />
Journal of Pharmaceutics, 2004: 271: 233–240.<br />
[7] Itoh K., et al.: In situ gelling pectin formulations for oral drug delivery at high gastric pH. International<br />
Journal of Pharmaceutics, 2007: 335(1-2): 90–96.<br />
[8] Wei H., et al.: Study on colon-specific pectin/ethylcellulose film-coated 5-fluorouracil pellets in rats.<br />
International Journal of Pharmaceutics, 2008: 348(1-2): 35–45.<br />
[9] Thirawong N., Thongborisute J., Takeuchi H., and Sriamornsak P.: Improved intestinal absorption of<br />
calcitonin by mucoadhesive delivery of novel pectin–liposome nanocomplexes. Journal of Controlled<br />
Release, 2008: 125(3): 236–245.<br />
72
EXPERIMENTAL REPORT<br />
GeNF<br />
SANS-2<br />
Proposer:<br />
Co-Proposer:<br />
Experimental Team:<br />
User Group Leader:<br />
Instrument Responsible:<br />
Date of Experiment: May 2008<br />
Investigation of swollen Pluronic micelles<br />
Melissa Sharp 1 , 1 GKSS Research Centre <strong>Geesthacht</strong>, Germany<br />
Melissa Sharp 1<br />
Andreas Schreyer 1<br />
Melissa Sharp 1<br />
Objectives<br />
The study of the solubilisation of low-molecular weight organic compounds by Pluronic block<br />
copolymer micelles is of interest in the pharmaceutical industry, since such compounds may<br />
be used as adjuvants. Adjuvants are compounds used by the pharmaceutical industry to aid<br />
the drug delivery process [1] . A model system comprising Pluronic block copolymer micelles<br />
has been studied. These polymers are triblock copolymers, with structure poly(ethylene<br />
oxide)-poly(propylene oxide)-poly(ethylene oxide). In the past the model adjuvants studied<br />
were benzyl benzoate and benzyl alcohol [2] . These two adjuvants have different aqueous<br />
solubilities. As a follow up to these sets of measurements it was thought to be interesting to<br />
study a different aromatic compound, for the purposes of comparison, and so the solubilisation<br />
of toluene was studied. The aim of the SANS measurements was to gain a better understanding<br />
of how the added compound affects the structure of the polymeric micelles. The<br />
effect of toluene both in terms of the concentration of toluene and the temperature of the solutions<br />
was investigated.<br />
Experiment<br />
The small-angle neutron scattering measurements were carried out on the SANS-2 instrument<br />
at GKSS. For the measurements three sample-detector distances were used, these<br />
were approximately 1, 4 and 22 m. The wavelength used was 5.8 Å, with a wavelength resolution<br />
of Δλ/λ = 10 %. An automatic sample changer connected to a Julabo was used for the<br />
measurements; temperatures in the range of 25 ºC to 70 ºC were used. The samples were<br />
placed in 1 mm pathlength Hellma quartz cuvettes. Absolute calibration was done using<br />
water; water was also used to correct for the detector efficiency. Background correction was<br />
done using the same D 2 O/H 2 O ratio as used to prepare a given sample.<br />
The samples consisted of either Pluronic F68 or Pluronic P85 in aqueous solution with deuterated<br />
toluene solubilised. Measurements were carried out where the aqueous solution was<br />
contrast matched to the toluene, leaving only the scattering from the polymer. In addition the<br />
aqueous solution was contrast matched to the polymer, leaving only the scattering from the<br />
toluene.<br />
Achievements and Main Results<br />
Using Pluronic F68, which has a relatively high critical micellisation concentration of 30 w/w %<br />
at 25°C, [3] it can be seen that the addition of toluene leads to the micellisation of the Pluronic<br />
block copolymer. This is clearly seen in Figure 1, from the sharp increase in the scattering<br />
73
intensity. Model fitting of the data is underway using the Pedersen model for spherical block<br />
copolymer micelles 3 , in order to obtain the detailed structures of these micelles.<br />
Figure 1:<br />
Pluronic F68 with toluene<br />
solubilised. Adding toluene leads<br />
to the micellisation of the polymer.<br />
The effect of the solubilisation of toluene by Pluronic P85 was also investigated. Here the<br />
polymer concentration chosen was to be slightly above the critical micellisation concentration<br />
at room temperature. For this set of measurements the toluene concentration was changed<br />
and in addition the effect of temperature was studied. The scattering curves for Pluronic P85<br />
with 1 % toluene solubilised is shown in Figure 2. For this set of measurements the aqueous<br />
solution was contrast matched to the toluene, leaving just the scattering from the polymer.<br />
From the change in the shape and intensity of the scattering curves it seems that increasing<br />
the temperature leads to a change in the shape of the micelles formed, once the temperature<br />
reaches 50 °C. Such changes are also observed for the Pluronic block coplymer in aqueous<br />
solution, but only at much higher temperatures. Model fitting of the data is underway.<br />
Figure 2:<br />
Pluronic P85 with 1 % toluene<br />
solubilised. The effect of temperature<br />
was studied.<br />
References<br />
[1] Wang, L.; Venkatraman, S.; Kleiner, L. J. Controlled Release 2004, 99, 207.<br />
[2] Sharp, M. PhD Thesis, University of Bristol, 2007<br />
[3] Pedersen, J.; Gerstenberg, M. Macromolecules 1996, 29, 1363–1365.<br />
74
EXPERIMENTAL REPORT<br />
GeNF<br />
SANS-2<br />
A study of the phase behaviour of reverse Pluronics<br />
Proposer:<br />
Co-Proposer(s):<br />
Experimental Team:<br />
User Group Leader:<br />
Instrument Responsible:<br />
Melissa Sharp 1 , 1 GKSS Research Centre <strong>Geesthacht</strong>, Germany<br />
Melissa Sharp 1<br />
Andreas Schreyer 1<br />
Melissa Sharp 1<br />
Date(s) of Experiment: May and September 2008<br />
Objectives<br />
While a significant amount of work has been carried out on the phase behaviour of Pluronic<br />
block copolymers in water [1,2] , relatively little work has been done on the closely related reverse<br />
Pluronic block copolymers. Reverse Pluronics are also triblock copolymers with structure<br />
poly(propylene oxide)-poly(ethylene oxide)-poly(propylene oxide), that is, in contrast to<br />
the Pluronics, the hydrophobic part of the polymer forms the end blocks. Since these polymers<br />
are of interest for a number of applications in industry, it was thought to be interesting<br />
to characterise the phase behaviour of these polymers in water. Small-angle neutron scattering<br />
measurements were therefore carried out in order to obtain the detailed structures<br />
formed by these polymers over a wide range of polymer concentrations and temperature.<br />
Experiment<br />
The small-angle neutron scattering measurements were carried out on the SANS-2 instrument<br />
at GKSS. For the measurements three sample-detector distances were used, these<br />
were approximately 1 and 4 m. The wavelength used was 5.8 Å, with a wavelength resolution<br />
of Δλ/λ = 10 % (May) or 20 % (September). An automatic sample changer connected to<br />
a Julabo was used for the measurements; temperatures in the range of 25 ºC to 70 ºC were<br />
used. The samples were placed in 1 or 2 mm pathlength Hellma quartz cuvettes, depending<br />
on the quantity of hydrogenated material in the sample. Absolute calibration was done using<br />
water; water was also used to correct for the detector efficiency. The background correction<br />
was done using an empty cuvette. The samples consisted of Pluronics 10R5 or 17R4 in D 2 O,<br />
with the polymer concentration being increased from 1 to 80 w/w %.<br />
75
Achievements and Main Results<br />
In Figure 1 the scattering curves obtained for Pluronic 10R5 at 25 °C and 70 °C are shown. It<br />
can be seen that the effect of polymer concentration and temperature is quite significant.<br />
Figure 1: SANS curves obtained for Pluronic 10R5 at 25 °C (top) and 70 °C (bottom).<br />
For the lower polymer concentrations it is possible to obtain good fits using the Debye function<br />
[3] . The radii of gyration obtained as a result of this fitting are shown in Figure 2 for the<br />
polymer at 25 °C as a function of polymer concentration. It can be seen that as the polymer<br />
concentration increases, the apparent radius of gyration increases. This has also been observed<br />
for other polymers 2 , and reflects the fact that at higher polymer concentrations the<br />
polymer chains are interacting with each other, and the solution can no longer be considered<br />
dilute.<br />
76
The effect of temperature has also been investigated and the radii of gyration obtained are<br />
shown in Figure 3 for a number of polymer concentrations. It can be seen that as the temperature<br />
is increased, the polymer coils begin to swell.<br />
Further and more detailed analysis of the data is underway.<br />
Figure 2:<br />
Radius of gyration obtained<br />
for Pluronic 10R5 at 25 °C,<br />
as a function of polymer concentration.<br />
Figure 3:<br />
Radius of gyration obtained<br />
for Pluronic 10R5 for different<br />
polymer concentrations,<br />
as a function of temperature.<br />
References<br />
[1] Alexandridis, P.; Hatton T. Colloids and Surf. A 1995, 96, 1–46.<br />
[2] Sharp, M. PhD Thesis, University of Bristol, 2007<br />
[3] Debye, P. J. Phys. Colloid Chem. 1947, 51, 18.<br />
77
EXPERIMENTAL REPORT<br />
GeNF<br />
SANS-2<br />
Proposer:<br />
Co-Proposer(s):<br />
Experimental Team:<br />
User Group Leader:<br />
Instrument Scientist:<br />
Neutron diffraction from gratings<br />
in holographic polymer dispersed liquid crystals<br />
Date(s) of Experiment: 4 th – 9 th April 2008<br />
Martin Fally 1 , 1 Faculty of Physics, University of Vienna, Austria<br />
Martin Bichler 1 ,<br />
Irena Drevenšek-Olenik 2 , 2 J. Stefan Institute & University of<br />
Ljubljana, Slovenia<br />
Martin Fally 1 , Martin Bichler 1 , Irena Drevenšek-Olenik 2 ,<br />
Helmut Eckerlebe 3 , 3 GKSS Research Centre <strong>Geesthacht</strong>, Germany<br />
Anton Zeilinger 1<br />
Helmut Eckerlebe 3<br />
Scientific Objectives<br />
This experiment was part of a series to gain insight into the photopolymerization induced<br />
phase separation process in (holographic) polymer dispersed liquid crystals (H-PDLC). The<br />
samples contained a homogeneous mixture of liquid crystal, photosensitive monomers and a<br />
photo initiator. Exposed to a holographic interference pattern photopolymerization occurs.<br />
The reaction rate is higher in bright areas, leading to diffusion of monomers into the illuminated<br />
regions and subsequent polymerization, while the liquid crystal molecules congregate<br />
in the dark areas [1]. To contribute to the understanding of these complex phenomena and to<br />
obtain detailed information on the formation of H-PDLCs and the process of phase seperation<br />
(especially the LC droplet size and shape), neutron diffraction was employed. It offers an<br />
appropiate tool for this purpose and has already been used in earlier experiments [2, 3, 4, 5].<br />
For this series of measurements samples of HPDLC with different grating spacings were<br />
investigated, thus exploring the role of diffusion. Furthermore, we performed first experiments<br />
on holographically patterned nanoparticle dispersed polymers (ZrO2 or SiO2), the nanoparticles<br />
thereby replacing the LC component. Finally, a practical purpose was to take another<br />
step in the optimisation of H-PDLCs and nanoparticle dispersed polymers for use as<br />
neutron optical elements, in particular as beamsplitters and mirrors in interferometry.<br />
Experimental Technique<br />
Small-angle neutron diffraction experiments were performed at SANS-2. The used neutron<br />
wavelengths were 11.58 Å and 19.6 Å with a spread of = 10 %. We employed the full<br />
available collimation length of 16m, using diaphragms of 20 x 20 mm² or 10 x 40 mm² at the<br />
entrance and a 5 mm pinhole in front of the sample. Because of the small diffraction angles<br />
B = ~0.5 mrad the maximum sample to detector distance (21 m) was employed.<br />
The investigated samples of H-PDLC were part of a series from a single batch. To create a<br />
sample the volume between two glass plates, separated by spacers of 50 μm thickness, was<br />
filled with a mixture of 55 wt.-% LC (TL203, Merck), 33 wt.-% prepolymer (PN393, Nematel)<br />
which is photosensitve in the uv [6] and 12 wt.-% 1,1,1,3,3,3,3-Hexafluoroisopropyl acrylate<br />
(HFIPA, Sigma-Aldrich). An Argon ion laser operating at 351 nm wavelength was used in a<br />
two wave mixing setup to record sinusoidal gratings in the samples. By changing the angle<br />
between the two beams, samples with four different grating spacing were produced<br />
79
( = 1200 nm, 1000 nm, 560 nm, 433 nm). A broadband uv-lamp was used for postcuring.<br />
The partial phase separation and the highly polarizable LC components yield efficient anisotropic<br />
gratings for light [6, 7], the modulation of the scattering length density on the other<br />
hand, constitute contrast for neutron diffraction [8]. The samples containing nanoparticles<br />
have been provided by Y. Tomita [9].<br />
Achievements and Main Results<br />
Complete rocking curves were conducted on H-PDLCs and nanoparticle samples, that is the<br />
angular dependence of the diffraction efficiency η (diffracted intensity over incoming intensity).<br />
We were able to demonstrate profound diffraction efficiencies for nanoparticle dispersed<br />
polymer samples for the first time. Fig. 1 shows the detected intensity (zero, ±1 st ,<br />
±2 nd orders) of neutron diffraction (19.6 Å wavelength) from a sample containing SiO2<br />
nanoparticles in a polymer matrix. The reason for the detection of higher orders is twofold: 1)<br />
the diffraction process involves multiple beam coupling (in the rigorous coupled wave regime)<br />
and 2) the grating is slightly nonsinusoidal. Fig. 2 depicts the angular dependence of the diffraction<br />
efficiency for the first orders for a grating made of a ZrO 2 particle dispersed polymer.<br />
Figure 1: Detector image (neutron counts in<br />
lin scale) of a SiO2 nanoparticle dispersed<br />
polymer sample, displaying the 0th, ±1st<br />
and ±2nd orders.<br />
Wavelength: 1.96 nm, particle size ~13 nm,<br />
grating spacing = 1000 nm, grating thickness<br />
50 micron.<br />
Figure 2: Rocking curve of a grating built from a<br />
ZrO2 nanoparticle dispersed polymer sample.<br />
Wavelength: 1.16 nm, particle size ~2 nm, grating<br />
spacing = 1000 nm, grating thickness 51 micron.<br />
A systematic study of the diffraction efficiency of 11 HPDLC samples with various grating<br />
spacings and thicknesses was done during our experiments. Samples with lower grating<br />
spacing (433 nm, 560 nm) and larger thickness (100 micron) show less diffraction, probably<br />
related to the fact, that the phase separation process is far from being complete. Best results<br />
were achieved with the = 1 m samples. The results together with a reasoning for optimal<br />
diffraction gratings were accepted for publication recently [10]. The diffraction efficiency of<br />
the H-PDLCs were around 0,9 % for 1.16 nm wavelength, the nanoparticle dispersed polymers<br />
using SiO 2 (20 wt.-%) resulted in a η of 3 % while ZrO 2 (12 wt.-%) showed an efficiency<br />
of 0,7 %. The samples and thus the gratings are rather thin (d = 50–100 m) and can't be<br />
much higher for HPDLCs because of strong optical scattering during the holographic preparation<br />
process.<br />
80
H-PDLCs are interesting for the fabrication of neutron optical devices (gratings, lenses, mirrors,..)<br />
for cold neutrons. Nanoparticles dispersed in a polymer matrix are even more promising<br />
candidates for neutron optical gratings, e.g. in a LLL-neutron interferometer. Still the<br />
photopolymerization process needs further investigations to optimize the materials for light<br />
optical and neutron optical purposes.<br />
References<br />
[1] C.C. Bowley, G.P. Crawford: Appl. Phys. Lett. 76, 2235 (2000)<br />
[2] M. Fally: Appl. Phys. B 75, 405 (2002)<br />
[3] F. Havermeyer, R.A. Rupp, D.W. Schubert, E. Krätzig: Physica B 276-278, 330 (2000)<br />
[4] M. Fally, M.A. Ellabban, M. Bichler, I. Drevenšek-Olenik: Proc. SPIE 6587, 65871J (2007)<br />
[5] M. Fally, I. Drevenšek-Olenik, M.A. Ellabban, K.P. Pranzas, J. Vollbrandt: Phys. Rev. Lett. 97,<br />
167803 (2006)<br />
[6] I. Drevenšek-Olenik, V. Jazbinšek, M.E. Sousa, A.K. Fontecchio, G.P. Crawford, M. Čopič: Phys.<br />
Rev. E 69, 051703 (2004)<br />
[7] I. Drevenšek-Olenik, M. Fally, M. A. Ellabban: Phys. Rev. E 74, 021707 (2006)<br />
[8] R.A. Rupp, J. Hehmann, R. Matull, K. Ibel: Phys. Rev. Lett. 64, 301 (1990)<br />
[9] N. Suzuki, Y. Tomita, K. Ohmori, M. Hidaka, K. Chikama: Opt. Express 14, 12712 (2006)<br />
[10] M. Fally, M. Bichler, M.A. Ellabban, I. Drevenšek Olenik, C. Pruner, H. Eckerlebe, K.P. Pranzas:<br />
"Diffraction Gratings for Neutrons from Polymers and Holographic Polymer-Dispersed Liquid<br />
Crystals" accepted for publication in J. Opt. A -Pure Appl. Op. 11 (2009)<br />
81
EXPERIMENTAL REPORT<br />
GeNF<br />
SANS-2 / DCD<br />
Anomalous changes of metal hydroxides fractal properties<br />
at the point of zero charge<br />
Proposer:<br />
Co-Proposer(s):<br />
Experimental Team:<br />
User Group Leader:<br />
Instrument Scientist:<br />
V.K. Ivanov 1 , 1 Institute of General and Inorganic Chemistry,<br />
Moscow, Russia<br />
G.P. Kopitsa 2 , 2 Petersburg Nuclear Physics Institute, Gatchina,<br />
Russia<br />
A.E. Barantchikov 1 , 1 Institute of General and Inorganic<br />
Chemistry, Moscow, Russia<br />
V.K. Ivanov 1<br />
G.P. Kopitsa 2 ,<br />
V.K. Ivanov 1<br />
M. Sharp 3 , 3 GKSS Research Centre <strong>Geesthacht</strong>, Germany<br />
Date(s) of Experiment: 17 th –23 rd August 2008<br />
Objectives<br />
The goal of this proposal is to study unusual dramatic changes in the microstructure and<br />
properties of amorphous gels of metal hydroxides upon the change of acidity of reaction medium<br />
with respect to the point of zero charge of the hydroxides’ surface.<br />
Synthesis of nanocrystalline functional oxide materials by the so-called “soft chemistry”<br />
methods at relatively low temperatures has become one of the most widely used techniques<br />
mainly due to considerable energy savings. Processing nanomaterials by the soft chemistry<br />
methods allows one to tune their composition and properties simply by varying synthesis<br />
parameters. For example, hydrothermal treatment being one of the most convenient “soft<br />
chemistry” methods gives an opportunity to control phase composition and morphology of<br />
nanocrystalline products by adjusting temperature, pressure, duration of the treatment, concentration<br />
and acidity (pH) of initial solutions and suspensions [1–4]. The exact mechanisms<br />
of the processes taking place during synthesis of nanomaterials by the soft chemistry methods,<br />
especially under hydrothermal conditions, were established in a few cases only [5–7].<br />
This is mainly due to the fact that formation of nanocrystalline oxides from aqueous solutions<br />
of metal salts is a very complicated process, which consists of a number of stages including<br />
hydrolysis, consequent olation and oxolation, dehydration, crystallization of amorphous<br />
phases and finally growth of nanoparticles according to dissolution-precipitation mechanism.<br />
In turn, most of the properties of nanocrystalline products are largely determined by the<br />
structure of intermediate amorphous phases. For instance, the aggregate structure of<br />
nanocrystalline oxide powders prepared from gels of the corresponding hydroxides depends<br />
on the structure of the latter because decomposition of hydroxides proceeds following the<br />
autocatalytic topotactic mechanism [6, 8].<br />
Recently we have found for the first time [9, 10] that variation of precipitation pH of amorphous<br />
hydrated zirconia gels results in dramatic changes in their mesostructure. For instance,<br />
it was established that the surface area of dried ZrO 2·nH 2 O gels increases in two<br />
orders of magnitude (from 2 to 200 m 2 /g) upon increasing pH of precipitation from 5 to 7. It<br />
was further shown by SANS and USANS measurements that such a difference is mainly due<br />
83
to changes in the character of aggregation of hydrated zirconia monomer particles: the samples<br />
obtained at lower pH values (pH = 3; 4; 5) are non-fractal, while the samples precipitated<br />
at pH = 6 and pH = 7; 7.5; 8; 9 are mass and surface fractals, respectively. We have<br />
demonstrated that the nature of this effect lies in the change of relative amount of ions and<br />
counter-ions adsorbed on the surface of hydrated zirconia in the course of precipitation below<br />
and above the point of zero charge.<br />
We suppose that the effect observed should be a common feature not only for hydrated zirconia<br />
but also for other metal hydroxides. Therefore we intend to study the mesostructure of<br />
hydroxides of several metals precipitated at pH values below and above their points of zero<br />
charge. The objects of interest include HfO 2 xH 2 O, Cr(OH) 3 , SnO 2 xH 2 O, Al(OH) 3 ,TiO 2 xH 2 O<br />
and the composite (Ce,Zr)O 2 xH 2 O, whose decomposition results in formation of corresponding<br />
nanocrystalline functional oxide materials.<br />
Experiment<br />
1. Samples. Six series of the samples of Hf, Sn, Cr, Ce,Zr, Al and Ti-based xerogels, prepared<br />
by precipitation at different pH values were studied. The samples were kept in quartz<br />
cells with a path length of 1 mm.<br />
2. Small-angle neutron scattering. The SANS experiment was performed at the SANS-2<br />
scattering facility of FRG-1 research reactor in <strong>Geesthacht</strong> (Germany), which operates in<br />
near point geometry using neutrons with the wavelengths 0.58 and 1.16 nm (/ 0.2).<br />
The range of momentum transfer 110 -2 < q < 2.4 nm -1 was obtained using four sample-todetector<br />
distances (1, 3, 9 and 21.7 m). The scattered neutrons were detected by a position<br />
sensitive detector with 256x256 pixels. The measured data were calibrated by the incoherent<br />
scattering of vanadium and corrected for the sample transmission, background scattering<br />
(from the quartz cell) and detector response. The resulted data were processed by the software<br />
of SANDRA.<br />
The USANS measurements were performed using a DCD double crystal diffractometer (at<br />
the same FRG-1 reactor of the GKSS Research Centre) at a working neutron wavelength of<br />
0.443 nm with / = 1 10 -5 . This instrument was equipped with double monochromator<br />
unit based on perfect silicon crystals cut along the (111) plane. The first crystal was used to<br />
form the neutron beam and second crystal performed the monochromator function. The angular<br />
distribution of neutrons in the beam past the sample (situated behind the double monochromator)<br />
was measured by rotating an analyzer crystal (identical to the monochromator<br />
crystal) at a minimum angular step of 2 10 -7 deg. The full width at half height (FWHM)<br />
of the instrument line was w 0 = 2 10 -4 nm -1 . The momentum transfer was varied within<br />
1.5 10 -5 < q < 5 10 -2 nm -1 .<br />
Achievements and Main Results<br />
The momentum dependences of the SANS cross section d(q)/d measured for the samples<br />
of the amorphous xerogel HfO 2 nH 2 O precipitated at different pH values are shown in<br />
Fig. 1a in the log-log scale. As it can be seen, for all the samples the cross section d(q)/d<br />
behave as q -n at q < q 0.25 nm -1 . It was found that the exponent n is close to 4 for the<br />
sample with pH = 4 and equal to 3.83, 3.65 and 3.47 for the samples with pH = 6, 7 and 8,<br />
respectively. The dependence of the fractal dimension D S = 6 – n versus the acidity pH of<br />
medium is shown in Fig. 1b together with the data for the samples of the HfO 2 nH 2 O amorphous<br />
xerogels with pH = 3 and 9, which were obtained in our early work [9]. It means that<br />
84
in these amorphous xerogels transition from porous structure with practically smooth interface<br />
(D S 2) to the surface fractal with the dimension D S = 2.62 is observed with the increase<br />
pH of medium. This undoubtedly verifies results obtained in our early works [9, 10] for the<br />
amorphous ZrO 2·nH 2 O xerogels.<br />
d(q)/d (cm 2 /g)<br />
1000000<br />
100000<br />
10000<br />
1000<br />
100<br />
10<br />
pH = 4<br />
pH = 6<br />
pH = 7<br />
pH = 8<br />
D S<br />
2,5<br />
1<br />
a)<br />
0,1<br />
1E-3 0,01 0,1<br />
momentum transfer, q (nm -1 )<br />
2,0<br />
b)<br />
2 3 4 5 6 7 8 9 10<br />
pH<br />
HfO 2<br />
Figure 1: The SANS cross section d(q)/dversus q (a) and the fractal dimension D S versus the precipitation<br />
pH (b) for the HfO 2 nH 2 O amorphous xerogels synthesized at pH = 4, 6, 7, 8.<br />
The same effect is also observed for the (Ce,Zr)O 2 xH 2 O composite xerogels. As it can be<br />
clearly seen from Fig. 2b, the values of the fractal dimension D S , which were obtained from<br />
the slope of the straight-line sections of d(q)/d curves plotted in the log-log scale (Fig. 2a),<br />
increase with the increase of the precipitation pH. One should note that for SnO 2 xH 2 O the<br />
tendency turns to be opposite – upon the increase of precipitation pH the values of the fractal<br />
dimension D S decreases from 2.29 to 2.17 (Fig. 3). In fact, such an effect arises from the<br />
differences in chemical properties of hydrated oxides under study.<br />
The treatment of the USANS and SANS data for the samples of Cr, Al and Ti-based xerogels<br />
and interpretation of all the data obtained are in progress.<br />
10000<br />
2,3<br />
1000<br />
pH = 5<br />
pH = 6<br />
pH = 9<br />
d(q)/d (cm 2 /g)<br />
100<br />
10<br />
D S<br />
2,2<br />
2,1<br />
1<br />
0,1<br />
a)<br />
0,1 1<br />
momentum transfer, q (nm -1 )<br />
b)<br />
2,0<br />
4 5 6 7 8 9 10<br />
pH<br />
CeZrO 2<br />
Figure 2: The SANS cross section d(q)/dversus q (a) and the fractal dimension D S versus the<br />
precipitation pH (b) for (Ce,Zr)O 2 nH 2 O composite amorphous xerogels synthesized at pH = 5, 6, 9.<br />
85
2,6<br />
2,5<br />
2,4<br />
SnO 2<br />
Figure 3:<br />
The fractal dimension D S versus the precipitation pH<br />
for SnO 2 xH 2 O amorphous xerogels synthesized<br />
at pH = 2, 3 and 6.<br />
D S<br />
2,3<br />
2,2<br />
2,1<br />
2,0<br />
1 2 3 4 5 6 7<br />
pH<br />
References<br />
[1] L. Xiang, Y.P. Yin, Y. Jin, J. Mater. Sci. 37 (2002) 349.<br />
[2] H. Yin, Y. Wada, T. Kitamura, S. Kambe, S. Murasawa et al. J. Mater. Chem. 11 (2001) 1694.<br />
[3] Z. Yanqing, S. Erwei, C. Zhizhan, L. Wenjun, H. Xingfang, J. Mater. Chem. 11 (2001) 1547.<br />
[4] H.-J. Noh, D.-S. Seo, H. Kim, J.-K. Lee, Mater. Lett. 57 (2003) 2425.<br />
[5] P.E. Meskin, F.Yu. Sharikov, V.K. Ivanov et al. Mat. Chem. Phys. 104 (2007) 439.<br />
[6] F.Yu. Sharikov, V.K. Ivanov, Yu.V. Sharikov et al. Russ. J. Inorg. Chem. 51 (2006) 1841.<br />
[7] F.Y. Sharikov, P.E. Meskin, V.K. Ivanov, et al. Dokl. Chem. 403 (2005) 152.<br />
[8] P.H. Wen, H. Itoh, W.P. Tang, Q. Feng, Langmuir 23 (2007) 11782.<br />
[9] G.P. Kopitsa, V.K. Ivanov, S.V. Grigoriev et al. JETP Letters 85 (2007) 122.<br />
[10] V.K. Ivanov, G.P. Kopitsa, O.S. Polezhaeva, S.V. Grigoriev, P. Klaus Pranzas et al. Phys. Rev. E,<br />
2008, submitted for publication.<br />
86
EXPERIMENTAL REPORT<br />
GeNF<br />
SANS-2<br />
Proposer:<br />
Influence of ultrasonication on nanoscale heterogeneous systems<br />
of metal hydroxides<br />
Co-Proposer(s):<br />
Experimental Team:<br />
User Group Leader:<br />
Instrument Scientist:<br />
Date(s) of Experiment: 24 th –28 th August 2008<br />
A.E. Barantchikov 1 , 1 Institute of General and Inorganic<br />
Chemistry, Moscow, Russia<br />
G.P. Kopitsa 2 , 2 Petersburg Nuclear Physics Institute, Gatchina,<br />
Russia<br />
V.K. Ivanov 1 , 1 Institute of General and Inorganic Chemistry,<br />
Moscow, Russia<br />
V.K. Ivanov 1<br />
G.P. Kopitsa 2 ,<br />
A.E. Barantchikov 1<br />
M. Sharp 3 , 3 GKSS Research Centre <strong>Geesthacht</strong>, Germany<br />
Objectives<br />
Ultrasonic processing is one of the most powerful methods of advanced materials synthesis.<br />
In the last few years a great number of papers and reviews were published devoted to the<br />
development of methods of nanopowders and nanocomposites preparation utilizing ultrasound<br />
[1–5]. It should be noted that the mechanism of sonochemical reactions in homogeneous<br />
liquids is well studied and thus obtained data are usually treated in the frames of two major<br />
theories, namely, hot spot theory [6] and the theory of local electrization [7, 8]. On the other<br />
hand, information on the specific action of high intensity ultrasound on heterogeneous systems<br />
(mainly liquid-solid systems) is rather poor. It is generally accepted that shockwaves<br />
and local microjets in the liquid, following the collapse of cavitation bubbles, give rise to a<br />
number of specific effects including de-agglomeration of the solid, decrease of the mean particle<br />
size, increase of the surface area etc. [1, 9]. It should be noted that all of these results<br />
were obtained for suspensions containing relatively large particles, which size is comparable<br />
to the size of collapsing cavitation bubbles (> 0.5–1 m). On the other hand, the influence of<br />
sonication on heterogeneous systems consisting of nanometer-scale particles (for instance,<br />
sols and gels) is virtually unstudied. It should be also emphasized that these systems have a<br />
great potential in the field of nanomaterials synthesis [10–12] and it is obvious that determination<br />
of the mechanism of the action of ultrasound on their mesostructure is of a great practical<br />
importance.<br />
Thus the main goal of this proposal is to study the influence of ultrasonication on the<br />
mesostructure of amorphous gels of various metal hydroxides and hydrous oxides (including<br />
ZrO 2 xH 2 O, Cr(OH) 3 , Y(OH) 3 , In(OH) 3 , Al(OH) 3 and TiO 2 xH 2 O) by means of small-angle neutron<br />
scattering (SANS) in a wide momentum transfer range (0.01–2.5 nm -1 ). SANS technique<br />
gives unique opportunity to analyze such systems as they are of an amorphous or semicrystalline<br />
nature, while conventional methods of materials investigation (XRD, electron microscopy,<br />
etc.) cannot provide reliable information on their structure.<br />
Our previous SANS experiments [13] had shown for the first time that ultrasound notably<br />
affects the mesostructure of amorphous gels of iron(III) hydroxide, namely it results in the<br />
increase of homogeneity of xerogels in the mesoscopic range and, on the other hand, in increase<br />
of Fe(OH) 3 clusters and monomer particle sizes as well as in increase of fractal dimension.<br />
It was also established that ultrasonically-induced changes in the mesostructure of<br />
87
gels greatly affect their subsequent transformation into mesoporous nanocrystalline iron(III)<br />
oxide under hydrothermal conditions. Thus we can suppose that ultrasonication appears to<br />
be a promising method, which allows one to obtain materials with controlled structure.<br />
Experiment<br />
1. Sample. Six series of the samples of Zr, Cr, Y, In, Al and Ti-based xerogels prepared by<br />
precipitation from aqueous solutions of corresponding salts with or without ultrasonication<br />
were studied. The samples were kept in quartz cells with a path length of 1 mm.<br />
2. Small-angle neutron scattering. The SANS experiment was performed at the SANS-2<br />
scattering facility of FRG-1 research reactor in <strong>Geesthacht</strong> (Germany), which operates in<br />
near point geometry using neutrons with the wavelengths 0.58 and 1.16 nm (/ 0.2).<br />
The range of momentum transfer 110 -2 < q < 2.4 nm -1 was obtained using four sample-todetector<br />
distances (1, 3, 9 and 21.7 m). The scattered neutrons were detected by a position<br />
sensitive detector (256x256 pixels). The measured data were calibrated by the incoherent<br />
scattering of vanadium and corrected for the sample transmission, background scattering<br />
from the quartz cell, detector response and apparent density Н for each sample. All measurements<br />
were done at room temperature. The resulted data were processed by the SAN-<br />
DRA software.<br />
Achievements and Main Results<br />
Figure 1 shows the experimental curves of the differential cross section d(q)/d for amorphous<br />
ZrO 2 xH 2 O xerogels precipitated from ZrO(NO 3 ) 2 solutions of different concentrations<br />
without ultrasonic treatment (Fig. 1a) and after sonication (Fig. 1b). As it can be seen, for all of<br />
the samples the d(q)/d behave as q -n at q < q 0.15 nm -1 . The exponent n values found<br />
from the slope of the straight-line parts of the curves plotted in log-log scale lie in the range<br />
from 3.47 to 3.68. This corresponds to the scattering from the fractal surface with the dimension<br />
2.32 < D s = 6 – n < 2.53. Moreover, according to these figures,<br />
1000<br />
ZrO 2<br />
*nH 2<br />
O (control)<br />
c = 1 g/mol<br />
c = 0.25 g/mol<br />
c = 0.1 g/mol<br />
1000<br />
ZrO 2<br />
*nH 2<br />
O (ultrasound)<br />
c = 1 g/mol<br />
c = 0.25 g/mol<br />
c = 0.1 g/mol<br />
d(q)/d (cm 2 /g)<br />
100<br />
10<br />
d(q)/d (cm 2 /g)<br />
100<br />
10<br />
1<br />
1<br />
0,1<br />
a)<br />
0,1 1<br />
0,1<br />
b)<br />
0,1 1<br />
momentum transfer, q (nm -1 )<br />
momentum transfer, q (nm -1 )<br />
Figure 1: The SANS cross section d(q)/d for the control (non-sonicated) (a) and sonicated (b)<br />
samples of the amorphous ZrO 2 xH 2 O xerogels precipitated from ZrO(NO 3 ) 2 solutions with the different<br />
concentrations c = 0.1, 0.25 and 1 g/l.<br />
88
SANS intensity from the samples prepared from more concentrated solutions (c = 1 g/l) in<br />
both cases is notably higher. This clearly indicates that (1) the nuclear density homogeneity<br />
of xerogels in the range 1–100 nm is decreased with the increase of solutions concentration<br />
and (2) this situation is not changed upon sonication.<br />
To analyze quantitatively the influence of ultrasonic treatment on the structure of amorphous<br />
ZrO 2 xH 2 O xerogels we have compared the scattering from sonicated (US) and nonsonicated<br />
(C) samples. The results of such a comparison are presented in Fig. 2 as a difference<br />
in scattering between these samples:<br />
dDif<br />
( q)<br />
dUS<br />
( q)<br />
dC<br />
( q)<br />
.<br />
d<br />
d<br />
d<br />
(1)<br />
d(q)/d = d US<br />
(q)/d - d K<br />
(q)/d, cm 2 g -1<br />
100<br />
50<br />
0<br />
-50<br />
a )<br />
c = 1 g/mol<br />
0,1 1<br />
d(q)/d = d US<br />
(q)/d - d K<br />
(q)/d, cm 2 g -1<br />
10000<br />
1000<br />
100<br />
10<br />
1<br />
0,1<br />
0,01<br />
b)<br />
c = 0.25 g/mol<br />
c = 0.1 g/mol<br />
0,1 1<br />
momentum transfer, q (nm -1 )<br />
momentum transfer, q (nm -1 )<br />
Figure 2: Differences between SANS data for the sonicated and non-sonicated samples of the amorphous<br />
ZrO 2 xH 2 O xerogels obtained from Zr(NO 3 ) 3 solutions of different concentrations (c = 1 (a), 0.25<br />
and 0.1 g/l (b)).<br />
According to these data, it is clear that this difference is positive over the entire q range for<br />
the samples prepared from more diluted solutions (c = 0.1 and 0.25 g/l) and is negative at<br />
0.05 < q < 0.35 nm -1 for the samples prepared from concentrated solution (c = 1 g/l). Moreover,<br />
it was found that upon ultrasonic treatment the fractal dimension D s increases from<br />
2.33 to 2.53 prepared from diluted solutions (c = 0.1 g/l), while the opposite situation is observed<br />
for the samples prepared from concentrated solution (c = 1 g/l) where the fractal dimension<br />
decreases from 2.44 to 2.35. These results partially correspond to the data obtained<br />
in our early work [13] for the amorphous xerogels of iron(III) hydroxide.<br />
The similar effect of the ultrasound treatment on the mesostructure was also observed for the<br />
amorphous gels of yttrium(III) hydroxide. Figure 3 shows the experimental curves of the differential<br />
cross section d(q)/d for the amorphous Y(OH) 3 yH 2 O xerogels precipitated from<br />
Y(NO 3 ) 3 solutions of different concentrations c = 0.1 (Fig. 3a) and 1 g/l (Fig. 3b) without ultrasonic<br />
treatment and upon sonication. According to this figure, ultrasonic treatment results in<br />
the increase of the scattering in the case of the samples prepared from the diluted solution<br />
(c = 0.1 g/l) and in the decrease of those ones prepared from the concentrated solution (c = 1 g/l).<br />
The most interesting effect was observed for the amorphous Cr(OH) 3 yH 2 O xerogels (Fig. 4).<br />
In this case the sonication results in the transition from the mass fractal structure with the<br />
89
dimension D V ≈ 2.87 and the upper size of particles R ≈ 12 nm to the porous structure with<br />
the fractal phase boundaries and upper self-similarity limit R ≈ 35 nm. The dimension D S of<br />
the obtained surface fractals increases with the increase of the concentrations of the initial<br />
solutions of Cr(NO 3 ) 3 from 2.35 to 2.9.<br />
10000<br />
1000<br />
c = 0.1 g/mol<br />
control sample<br />
conicated sample<br />
10000<br />
1000<br />
c = 1 g/mol<br />
control sample<br />
conicated sample<br />
d(q)/d (cm 2 /g)<br />
100<br />
10<br />
d(q)/d (cm 2 /g)<br />
100<br />
10<br />
1<br />
1<br />
0,1<br />
a)<br />
0,1 1<br />
momentum transfer, q (nm -1 )<br />
0,1<br />
b)<br />
0,1 1<br />
momentum transfer, q (nm -1 )<br />
Figure 3: The SANS cross section d(q)/d for the control (non-sonicated) and sonicated samples of<br />
the amorphous Y(OH) 3 xH 2 O xerogels precipitated from Y(NO 3 ) 3 of with different concentrations (c =<br />
0.1 (a) and 1 g/l (b)).<br />
10000<br />
1000<br />
c = 0.1 g/mol<br />
control sample<br />
conicated sample<br />
10000<br />
1000<br />
c = 1 g/mol<br />
control sample<br />
conicated sample<br />
d(q)/d (cm 2 /g)<br />
100<br />
10<br />
d(q)/d (cm 2 /g)<br />
100<br />
10<br />
1<br />
1<br />
0,1<br />
0,1 1<br />
0,1<br />
0,1 1<br />
momentum transfer, q (nm -1 )<br />
momentum transfer, q (nm -1 )<br />
Figure 4: The SANS cross section d(q)/d for the control (non-sonicated) and sonicated samples<br />
of the amorphous Cr(OH) 3 xH 2 O xerogels precipitated from Cr(NO 3 ) 3 solutions of different concentrations<br />
(c = 0.1 (a) and 1 g/l (b)).<br />
The treatment of the SANS data for the samples of In, Al and Ti-based xerogels and interpretation<br />
of all the data obtained are in progress.<br />
90
References<br />
[1] A.Ye. Baranchikov, V.K. Ivanov, Yu.D. Tretyakov Russ. Chem. Rev. 76, 133 (2007)<br />
[2] K.S. Suslick. Ann. Rev. Matls. Sci. 29, 295 (1999)<br />
[3] A. Gedanken Ultrasonics Sonochemistry. 11, 47 (2004)<br />
[4] Y. Zhao, R. Feng, Y. Shi, M. Hu. Ultrasonics Sonochemistry. 12, 173 (2005)<br />
[5] Barantchikov A.Ye., Ivanov V.K., Oleynikov N.N., Tretyakov Yu.D. Mend. Comm. 4, 143 (2004)<br />
[6] E.A. Neppiras. Physics Report. 61, 159 (1980)<br />
[7] M.A. Margulis, I.M. Margulis. Ultrasonics sonochemistry. 9, 1 (2002)<br />
[8] M.A. Margulis. Sonochemistry and cavitation. Gordon and Breach Science Publishers SA,<br />
Luxembourg, 1995<br />
[9] K. Chatakondu, M. Green, M. Thompson, K. Suslick. J. Chem. Soc. Chem. Comm. 900 (1987)<br />
[10] The Chemistry of Nanomaterials: Synthesis, Properties and Applications. (Eds. C.N.R. Rao,<br />
A. Müller, A.K. Cheetham). Wiley-VCH, Germany, 2004<br />
[11] Nanomaterials: Synthesis, Properties and Applications. (Eds. A.S. Edelstein, R.C. Cammarata).<br />
Inst. of Phys. Publishing Bristol and Philadelphia, 1997<br />
[12] Meskin P.E., Ivanov V.K., Barantchikov A.E. et al. Ultrasonics Sonochemistry. 13, 47 (2006)<br />
[13] V.K. Ivanov, G.P. Kopitsa, F.Yu. Sharikov, A.Ye. Baranchikov, A.S. Shaporev, S.V. Grigoriev,<br />
P. Klaus Pranzas. Phys. Rev. B, 2008, submitted for publication.<br />
91
EXPERIMENTAL REPORT<br />
GeNF<br />
SANS-2 / DCD<br />
Domain Growth and precipitation in amorphous Si-C-N<br />
Proposer:<br />
Co-Proposer(s):<br />
Experimental Team:<br />
User Group Leader:<br />
Instrument Scientists:<br />
Harald Schmidt 1<br />
1 Institut für Metallurgie, AG Materialphysik, TU Clausthal, Robert-<br />
Koch-Str.42, 38678 Clausthal-Zellerfeld, Germany<br />
Wolfgang Gruber 1<br />
Wolfgang Gruber 1 , Harald Schmidt 1<br />
Harald Schmidt 1<br />
Melissa Sharp 2 , Helmut Eckerlebe 2<br />
2 GKSS Research Centre <strong>Geesthacht</strong>, Germany<br />
Date(s) of Experiment: 21 st – 25 th April 2008<br />
Objectives<br />
Polymer-derived ceramic solids of the system Si-C-N are very attractive for the design of the<br />
next generation of ultra-high temperature structure materials [1, 2]. These materials are produced<br />
by the conversion of organo-elemental precursors (polymers) into inorganic ceramics<br />
by solid state thermolysis at relatively low temperatures of about 1000 °C, which has the<br />
advantage to manufacture ceramic components in a flexible and relatively cost efficient approach.<br />
Using solid state thermolysis, it is possible to obtain metastable amorphous materials<br />
in form of bulk materials, powders, fibres, coatings etc. which are not available by conventional<br />
technologies. The ceramics are free of sinter additives and of oxidic grain boundary<br />
phases and have excellent mechanical properties, a good oxidation resistance, and an extraordinary<br />
thermal stability up to 2000 °C.<br />
Si-C-N ceramics form an amorphous non-equilibrium state after thermolysis, which is stable<br />
up to about 1500 °C. Previous investigations with small and wide angle X-ray and neutron<br />
scattering [3,4] proved a phase separation of the material on the sub-nanometer scale. A<br />
silicon rich phase is composed of amorphous Si 3+0.25x C x N 4-x (x = 0–4) domains and a carbon<br />
rich phase is composed of graphite-like amorphous carbon domains with sp 2 hybridised<br />
structural units with diameters of about 0.7 nm.<br />
The samples under investigation were Si-C-N bulk materials produced by uniaxial warm<br />
pressing. After annealing at 1500 °C for less than one hour the samples are still X-ray amorphous.<br />
For longer annealing times at this temperature nano-crystalline SiC and microcrystalline<br />
Si 3 N 4 [5] is formed. Silicon nitride reacts with carbon to silicon carbide and nitrogen,<br />
according to<br />
Si 3 N 4 + C SiC + N 2 .<br />
According to the mass action law the phases formed during annealing at a certain temperature<br />
are expected to depend on the nitrogen partial pressure. In fact, investigations of the<br />
crystalline phases yielded that after annealing at 1500 °C for several hours crystalline silicon<br />
nitride is found at a nitrogen partial pressure of 1 bar [5] while silicon carbide is found at a<br />
nitrogen partial pressure of 1 mbar [6]. At a nitrogen partial pressure of 1 mbar the rate constants<br />
for crystallization are significantly higher. The amorphous phases formed after annealing<br />
at 1500 °C for less than one hour were investigated by SAXS [7]. For both nitrogen partial<br />
pressures, 1 bar and 1 mbar, the Guinier radii extracted from the scattering curves increase<br />
with increasing annealing times. This was interpreted as coarsening of the amorphous nanodomains.<br />
With our equipment no significant differences in the scattering curves could be detected<br />
for samples annealed under different nitrogen partial pressures.<br />
93
The aim of this project was to study the isothermal transformation of as-thermolyzed ceramics<br />
to multiphase amorphous/crystalline nano-composites at 1500 °C and different nitrogen<br />
partial pressures. Our previous SAXS measurements were carried out within a limited q-<br />
range of 0.7–3 nm -1 using a laboratory machine. With the large q-range facilitated by SANS<br />
and the possibility to calculate absolute cross sections our SAXS results should be confirmed<br />
and additionally differences in the scattering curves of the amorphous samples annealed<br />
under different nitrogen partial pressures should be detected. SANS measurements of partly<br />
crystallized samples should give insight into the development of amorphous and crystalline<br />
precipitations within the amorphous matrix.<br />
Experiment<br />
SANS measurements were performed at the instrument SANS-2 at the <strong>Geesthacht</strong> neutron<br />
facility (GeNF). Unpolarized neutrons with a wavelength of 0.5 nm (/ = 0.1) were used to<br />
minimize the influence of multiple scattering. With three detector distances (1 m, 4 m, 20 m)<br />
a q-range from 0.02 nm -1 to 4 nm -1 was covered. Absolute cross sections were calculated by<br />
comparison with the incoherent scattering of vanadium. The samples were Si-C-N bulk ceramics<br />
with a composition of Si 26 C 41 N 33 . The size of the samples was 6 mm x 6 mm with a<br />
thickness of 1 mm. One sample was in the as-thermolyzed state, 8 samples were annealed at<br />
1500 °C for different time steps and different nitrogen partial pressures ex-situ in a specially<br />
designed furnace system at TU Clausthal. Additionally USANS measurements were cared<br />
out at the DCD instrument.<br />
Achievements and Main Results<br />
1000000<br />
100000<br />
d/d (cm -1 )<br />
10000<br />
1000<br />
100<br />
10<br />
1<br />
1 bar<br />
1 mbar<br />
0.1<br />
0.01<br />
0.01 0.1 1<br />
q (nm -1 )<br />
Figure 1: Scattering curves for a sample annealed for 7 h at a nitrogen partial pressure of 1 bar (blue<br />
curve) and a sample annealed for 2 h at a nitrogen partial pressure of 1 mbar. The red and the<br />
magenta lines are fitting curves (see text).<br />
The green curve in Figure 1 shows the scattering curve for a sample annealed for 7 hours at<br />
a nitrogen partial pressure of 1 bar. After annealing the sample is X-ray amorphous. The blue<br />
curve shows the scattering curve of a sample annealed for 2 hours at a nitrogen partial pressure<br />
of 1 mbar. After annealing small Bragg peaks are found in the diffractogram indicating<br />
that crystallization has taken place. In spite of the shorter annealing time crystallization is<br />
significantly faster at a nitrogen partial pressure of 1 mbar in accordance with our previous<br />
results [6]. There is no significant difference between the two curves for q-values lower than<br />
94
0.1 nm -1 and higher than 2 nm -1 . For q values lower than 0.1 nm -1 both curves can be described<br />
with a straight line in the double logarithmic plot with a slope close to – 4, corresponding<br />
to Porod’s law. We subtracted the Porod lines from the scattering curves and fitted<br />
the resulting curves in the q-range of 0.1 nm -1 to 2 nm -1 assuming distributions of hard<br />
spheres using the SANSfit program provided by GKSS (SANSfitStd0.12). The red and the<br />
magenta line in Figure 1 show the fit curves with the Porod lines added again. The green<br />
scattering curve of the X-ray amorphous sample could be fitted with one distribution of hard<br />
spheres centred at 1.3 0.1 nm with a width of 0.5 0.2 nm (red curve). The blue scattering<br />
curve of the sample where Bragg peaks are visible in the diffractogram could only be fitted<br />
assuming two distributions of hard spheres. One distribution is centred at 1.3 0.2 nm with a<br />
width of 0.5 0.1 nm. The other distribution is centred at 2.4 0.07 nm with a width of 0.24 <br />
0.1 nm. The number density of the second distribution is about 10 -3 of the first one.<br />
The distributions centred at about 1.3 nm correspond to the sizes of the amorphous domains<br />
and confirm our results from the SAXS measurements: the nitrogen partial pressure during<br />
annealing at 1500 °C for some hours does not significantly influence the coarsening of the<br />
amorphous domains. The distribution centred at 2.4 nm was not observed in our SAXS<br />
study. Using Scherrer’s formula from the Bragg peaks of the partially crystallized sample annealed<br />
at a nitrogen partial pressure of 1 mbar the size of the crystallites can be estimated to<br />
be about 25 nm. We therefore attribute the distribution at 2.4 nm to crystalline nuclei or very<br />
small crystallites not detectable by XRD. Crystallites in the range of 20 nm to 100 nm are<br />
expected to contribute to the scattering curves in a q-range reachable by USANS. The scattering<br />
curves obtained with the DCD instrument, however, could not be evaluated satisfactorily<br />
because there was too much multiple scattering. The samples used were too thick. Since the<br />
present measurements were the first SANS and USANS measurement carried out on bulk<br />
samples, as a result, significantly thinner samples have to be used in future experiments.<br />
References<br />
[1] H. Riedel et al., Nature 355 (1992), 714.<br />
[2] E. Kroke et al., Mat. Sci. Eng. Rev. 26 (2000), 97.<br />
[3] J. Dürr et al., J. Non-Cryst. Sol. 232 (1998), 155.<br />
[4] J. Haug et al., Chem. Mater. 16 (2004), 72.<br />
[5] H. Schmidt et al., J. Non-Cryst. Solids 341 (2004), 133.<br />
[6] W. Gruber, H. Schmidt, Verhandlungen der DPG, MM49.3, (2008)<br />
[7] W. Gruber, H. Schmidt et al., Diffusion Fundamentals, 8 (2008) 9.1-9.7.<br />
95
EXPERIMENTAL REPORT<br />
GeNF<br />
SANS-2<br />
Proposer:<br />
Co-Proposer(s):<br />
Dipole-Field-Induced Spin Disorder<br />
in Nanoporous Inert-Gas Condensed Iron<br />
A. Michels 1<br />
1 Technische Physik, Universität des Saarlandes, Saarbrücken<br />
M. Elmas 1 , F. Döbrich 1 , J. Kohlbrecher 2 , R. Birringer 1<br />
2 Paul Scherrer Institute, CH-5232 Villigen PSI, Switzerland<br />
Experimental Team:<br />
Head of Institute:<br />
Instrument Responsible:<br />
Date(s) of Experiment: 31 st March–3 rd April 2008<br />
M. Elmas, F. Döbrich, A. Michels<br />
A. Michels 1<br />
M. Sharp 3 , H. Eckerlebe 3 , 3 GKSS Research Centre, <strong>Geesthacht</strong>,<br />
Germany<br />
Objective<br />
The purpose of the present research was to investigate the existence of the recently discovered<br />
clover-leaf anisotropy (see below) in the magnetic SANS cross section of nanocrystalline (nc)<br />
inert-gas condensed (igc) ferromagnets, in particular, in nc Fe. Related to the synthesis procedure,<br />
igc materials typically contain a certain volume fraction of pores: in the igc process,<br />
the starting material is evaporated into an inert-gas atmosphere, resulting in the formation of<br />
nanoscale particles which are collected and mechanically compacted under high pressure.<br />
The resulting porosity can be controlled within certain limits via the applied pressure<br />
during compaction (typically between 0.5 GPa–2 GPa). In fact, igc samples constitute twophase<br />
systems of non-magnetic “particles” (pores) in a magnetic matrix, which are most<br />
likely to account for dipolar stray fields in the approach-to-saturation regime, similar to nanocomposites<br />
[1]. The jump of the magnetization at the interface between a pore and the ferromagnetic<br />
matrix is maximum in such samples, and we therefore expect to observe strong<br />
dipole-field-induced spin disorder in the magnetic SANS cross section of these materials. It<br />
may therefore be expected to detect the related spin disorder in igc nanoporous magnetic<br />
materials as a clover-leaf shaped anisotropy.<br />
Experiment, Achievements and Main Results<br />
The nuclear and magnetic SANS cross section d/d of a nc ferromagnet can be expressed<br />
as the sum of two contributions [1],<br />
d<br />
dR<br />
dM<br />
( q)<br />
( q)<br />
( q)<br />
d<br />
d<br />
d<br />
3<br />
dR<br />
d<br />
3<br />
8 ~ 2<br />
2 ~ 2<br />
2<br />
q ) N b sin <br />
H<br />
M<br />
(1)<br />
V <br />
<br />
(<br />
z<br />
~ ~ ~ ~<br />
<br />
M<br />
M M M sin<br />
cos<br />
<br />
d<br />
8<br />
~<br />
2<br />
~<br />
2<br />
M<br />
2<br />
2<br />
2 2<br />
( q ) <br />
<br />
bH<br />
Mx<br />
bH<br />
My<br />
cos bH<br />
y z y z<br />
,<br />
d<br />
V <br />
where V denotes the scattering volume, c* denotes a quantity complex-conjugated to c, b H is<br />
a constant, is the angle between the scattering vector q and the external magnetic field H,<br />
and N ~ (q) and M ~ ~ ~ ~<br />
(q) = ( M x,<br />
My,<br />
Mz<br />
) denote, respectively, the Fourier coefficients of the nuclear<br />
and of magnetic scattering-length densities. The residual scattering cross section<br />
d R /d contains the nuclear SANS and the part of the magnetic SANS which originates from<br />
97
the longitudinal magnetization component M z , whereas the spin-misalignment scattering<br />
cross section d M /d depends on the transversal spin components M x and M y . d M /d vanishes<br />
at complete saturation. Important to note in the present context is the fact that Eq. (1)<br />
contains a recently discovered term [1] which varies as sin cos, the so-called clover-leaf<br />
anisotropy, resulting in maxima roughly along the detector diagonals ( = 45°).<br />
Note that Eq. (1) is valid for both single-phase as well as multi-phase materials. However,<br />
contributions proportional to sin cos are expected to be particularly relevant in multi-phase<br />
magnetic nanocomposites (as opposed to homogeneous single-phase materials), where in<br />
addition to nonuniformities in the spin orientation, variations in the magnitude of the magnetization<br />
have to be taken into account [1]. The terms d M /d sin cos are a direct manifestation<br />
of the dipolar character of magnetic neutron scattering, and, as such, they are a priori<br />
unrelated to the details of the magnetic microstructure. These details affect the scattering<br />
~ ~<br />
through the Fourier coefficients M<br />
y(<br />
q)<br />
and M z(<br />
q)<br />
of the magnetization [compare Eq. (1)].<br />
The clover-leaf-shaped anisotropy is by no means a subtle feature that is peculiar only to a<br />
small class of magnetic materials, rather, such an angular anisotropy is expected to be relevant<br />
in almost all nanomagnets, whenever correlations between My(<br />
q)<br />
and M z(<br />
q)<br />
exist. In<br />
~ ~<br />
this context we would also like to note that we have recently observed the dipole-field effect<br />
in steel samples containing nanometer-sized NiAl precipitates [1].<br />
We have measured the magnetic-field-dependent SANS cross section of several nc igc Fe<br />
samples with different volume fractions of porosity. As can be seen in the figure below, the<br />
clover-leaf anisotropy is indeed present in the total unpolarized d/d of nc igc Fe. This observation<br />
is particularly relevant for the interpretation of SANS data and thus for the understanding<br />
of the materials’ magnetic microstructure; it is in contrast to the recent SANS results<br />
obtained by Löffler et al. [2] on igc nc Fe and Co, where this type of angular anisotropy has<br />
not been reported.<br />
(a) B = 0.6 T<br />
Figure 1:<br />
Normalized total nuclear and magnetic<br />
SANS intensity of nanocrystalline inert-gas<br />
condensed Fe annealed for 4 h at 420 °C<br />
as a function of the angle between the<br />
external field B and the scattering vector q<br />
(q = 0.15 nm -1 ); (a) B = 0:6 T; (b) B = 1:83 T.<br />
(b) B = 1.83 T<br />
References<br />
[1] A. Michels, J. Weissmüller, Rep. Prog. Phys. 71, 066501 (2008).<br />
[2] J.F. Löffler, H.B. Braun, W. Wagner, G. Kostorz, A. Wiedenmann, Phys. Rev. B 71, 134410 (2005).<br />
98
EXPERIMENTAL REPORT<br />
GeNF<br />
SANS-2<br />
Magnetic microstructure of nanocrystalline gadolinium<br />
Proposer:<br />
Co-Proposers:<br />
F. Döbrich 1 , 1 Technische Physik, Universität Saarbrücken,<br />
Postfach 151150, 66041 Saarbrücken, Germany<br />
A. Michels 1 , Helmut Eckerlebe 2<br />
2 GKSS Research Centre <strong>Geesthacht</strong>, Germany<br />
Experimental Team:<br />
Head of Institute:<br />
Instrument Scientist:<br />
Date of Experiment: 27 th May – 9 th June 2008<br />
A. Michels 1 , F. Döbrich 1 , A. Ferdinand 1 , J Kohlbrecher 3 ,<br />
H. Eckerlebe 2 , 3 Paul Scherrer Inst., CH-5232 Villigen PSI, Switzerland<br />
R. Birringer 1<br />
H. Eckerlebe 2<br />
Objective<br />
The magnetic microstructure of nanocrystalline magnetic materials can be studied particularly<br />
well by magnetic SANS [1], as this method may provide access to characteristic parameters,<br />
such as the correlation length of spin misalignment L C or the exchange stiffness<br />
constant A, by analysis of the radially averaged SANS data. Additionally, the angular dependency<br />
of the scattering cross-section may give valuable information on the spin structure [2].<br />
In nanocrystalline Gd, magnetic properties like the coercivity or the high-field magnetization<br />
are found to depend strongly on the grain size, in particular in the regime below 50 nm. Since<br />
the position sensitive RKKY interaction mechanism in rare-earth magnets [3] is expected to<br />
render these elements very sensitive to structural imperfections, a special role of the grain<br />
boundaries present to a large amount in nanocrystalline materials may be conjectured. In<br />
fact, the first magnetic SANS measurements on nanocrystalline Gd performed at the GKSS<br />
using the isotope 160 Gd for sample preparation indicate the presence of strong nanoscale<br />
spin disorder originating from the core regions of the grain boundaries [4]. The goal of the<br />
present experiment was to scrutinize the explicit influence of the grain-size on the spin structure<br />
of nanocrystalline Gadolinium via the evolution of the previously observed clover-leafshaped<br />
anisotropy upon annealing, as well as the analysis of the correlation length L C at larger<br />
grain sizes.<br />
Experiment<br />
Measurements were carried out using the 5 T cryomagnet sample environment. At 78 K an<br />
as-prepared nanocrystalline 160 Gd sample with a grain size of 25 nm was measured at 8 m<br />
detector distance and at applied fields of 600 mT and 5 T with particularly good statistics in<br />
order to obtain the 2D spin-misalignment scattering from the difference pattern [4]. After annealing<br />
of the same sample at 155 °C for 1h at GKSS, resulting in a grain-size of 35 nm, the<br />
above-mentioned measurement was repeated. Full scattering curves have been measured<br />
on the annealed sample at applied fields of 0 T, 30 mT, 60 mT, 100 mT, 300 mT, 600 mT,<br />
1 T and 5 T.<br />
Achievements and Main Results<br />
As was found in the first part of the experiment, the presence of the clover-leaf anisotropy in<br />
the spin-misalignment scattering cross-section is strongly correlated with the grain-size (see<br />
Fig. 1). At D = 25 nm the feature is clearly visible, whereas already at D = 35 nm there are<br />
99
only weak local maxima present along the detector diagonals. Fourier transformation of the<br />
radially averaged SANS cross-section after subtraction of the residual scattering yields the<br />
correlation function of spin-misalignment [1], which can then be used to extract a characteristic<br />
length L C , over which perturbations in the spin structure decay. The results for the grainsizes<br />
D = 21 nm and D = 35 nm are shown in Fig. 2. It is seen that, especially at lower fields,<br />
L C shifts to higher values as the grain-size is increased. We interpret these results as a manifestation<br />
of the fact that the volume fraction of grain boundaries (~1/D) is reduced. Accordingly,<br />
the M Z fluctuations required for the clover-leaf anisotropy diminish and the feature<br />
becomes less pronounced. The fact that L C increases at lower fields may indicate that, in<br />
addition to the grain boundary component, there is a second contribution to spin disorder in<br />
nanocrystalline Gd, presumably the magnetocrystalline anisotropy of the crystallites, which<br />
gains more weight at larger grain size.<br />
Figure 1: Grain-size-dependence of the clover-leaf anisotropy; in (a) the spin-misalignment scattering<br />
at 78 K and 600 mT is depicted for the as-prepared nc state with a grain size of 25 nm. The clover-leaf<br />
anisotropy becomes less pronounced upon annealing at 155 °C for 1 h resulting in a grain size<br />
D = 35 nm [see fig. (b)]. Measurements were taken at 8 m detector distance.<br />
Figure 2:<br />
Field-dependence of the correlation<br />
length of spin-misalignment in nc Gd<br />
for two different grain sizes D. In particular<br />
at lower fields, L C increases<br />
with the grain-size.<br />
References<br />
[1] Michels A. and Weissmüller J., Reports on Progress in Physics 71 (2008), 066501<br />
[2] Michels A., Vecchini C., Moze O., Suzuki K., Pranzas P.K., Kohlbrecher J. and Weissmüller J.,<br />
Physical Review B, 74 (2006), 134407.<br />
[3] Legvold S., in Ferromagnetic Materials, edited by Wohlfarth E.P., Vol. 1 (North-Holland Publishing<br />
Company, Amsterdam) 1980 pp. 183-295.<br />
[4] Michels A., Döbrich F., Elmas M., Ferdinand A., Markmann J., Sharp M., Eckerlebe H.,<br />
Kohlbrecher J. and Birringer R., Europhysics Letters, 81 (2008), 66003<br />
100
EXPERIMENTAL REPORT<br />
GeNF<br />
SANS-2<br />
SANS investigation of irradiation-induced phase separation<br />
in binary Fe-Cr-alloys<br />
Proposer:<br />
Co-Proposer(s):<br />
Experimental Team:<br />
User Group Leader:<br />
Instrument Scientist:<br />
Andreas Ulbricht 1<br />
1 Forschungszentrum Dresden-Rossendorf, Germany<br />
Cornelia Heintze 1<br />
Andreas Ulbricht 1 , Cornelia Heintze 1<br />
Frank Bergner 1<br />
Helmut Eckerlebe 2<br />
2 GKSS Research Centre, <strong>Geesthacht</strong>, Germany<br />
Date(s) of Experiment: 22 nd –27 th September 2008<br />
Objectives<br />
Ferritic-martensitic chromium steels are candidate structural materials for future generation<br />
nuclear reactors such as fusion or advanced high temperature reactors (Gen IV) or spallation<br />
sources, because of their adequate mechanical properties. In operation, these materials will<br />
be exposed to high neutron doses up to about 100 dpa (displacements per atom) and high<br />
temperatures. However, the formation of irradiation-induced defects and the possible degradation<br />
of the mechanical properties under these extreme conditions are not yet well understood.<br />
Aim of the SANS experiment is to gather knowledge of the effects of Cr content and<br />
neutron dose on damage evolution and precipitation in binary Fe-Cr alloys under irradiation<br />
at 300 °C.<br />
Experiment<br />
Samples of Fe-Cr alloys with 2.5, 5.0, 9.0 and 12.5 at.% Cr, respectively were investigated in<br />
the neutron irradiated conditions of 0.6 and 1.5 dpa. The corresponding unirradiated reference<br />
conditions together with Fe9.0 at.%Cr (0.6 dpa) were already measured in 2007 [1, 2].<br />
The experiment was carried out at a wavelength of 0.58 nm with 3 sample detector distances<br />
of 1, 4 and 16 m and corresponding collimation length. The samples of 7 mm x 7 mm, thickness<br />
1 mm, were placed in a saturation magnetic field (about 1.7 T). Scattering data were<br />
corrected for sample transmission, detector response and background. Absolute calibration<br />
was done by means of a vanadium measurement. Raw data analysis was performed using<br />
software routines provided by GKSS.<br />
Achievements and Main Results<br />
Fig. 1a shows the magnetic scattering curves of the Fe-2.5 and -12.5 at.%Cr alloys in different<br />
conditions. We have observed a pronounced increase of intensity in the Q-range,<br />
Q > 0.5 nm -1 for each condition. The effect is the stronger, the higher the Cr content of the<br />
bulk material. Differences between the conditions of 0.6 dpa and 1.5 dpa are marginal for the<br />
same Cr content indicating a saturation-like behaviour. The measured curves of Fe-12.5 at.%Cr<br />
exhibit a local maximum at Q = 1.06 nm -1 due to interparticle interference [3]. A multiple scattering<br />
effect can be excluded as was demonstrated by a control measurement at a wavelength<br />
of 1.2 nm. After subtraction of the corresponding unirradiated condition (see Fig. 1b)<br />
the size distributions of irradiation-induced clusters were calculated. The cluster size is<br />
smaller as 2.5 nm in radius. A weak shift of the peak radius was found between the condi-<br />
101
tions of 0.6 and 1.5 dpa (see Fig. 1c, d). The corresponding data fits are plotted as lines in<br />
Fig. 1b. The composition of the clusters can be described by the A-ratio (ratio of scattering<br />
intensity perpendicular and parallel to the magnetic field). The A-ratio as function of Q is<br />
shown in Fig. 1e. A constant value of 2.05 is measured for the Fe-12.5 at.%Cr. This value is<br />
consistent with the Cr-rich ’-phase in -Fe matrix. An increase of the A-ratio with Q is observed<br />
for Fe-2.5 at.%Cr. Values of the A-ratio in excess of about 2.5 indicate a possible<br />
contribution of carbides. In order to investigate the kinetics of irradiation-induced precipitation,<br />
dose levels much less than 0.6 dpa have to be considered.<br />
Figure 1: (a) Magnetic scattering curves of Fe-2.5 and -12.5 at.%Cr alloys in different conditions; (b)<br />
after subtraction of the unirradiated condition with data fits; (c) and (d) size distribution of irradiationinduced<br />
clusters and (e) A-ratio as function of Q.<br />
References<br />
[1] Ulbricht, A.; Bergner, F.; Heintze, C.; Eckerlebe, H.; Nature of defects formed in neutron-irradiated<br />
Fe-Cr model alloys, GeNF – Experimental Report 2007, GKSS 2008/6, pp. 77–78.<br />
[2] Ulbricht, A.; Bergner, F.; Heintze C.; Eckerlebe, H.; SANS investigation of irradiation-induced<br />
phase separation in a binary Fe-Cr alloy, Deutsche Neutronenstreutagung 2008, 15–17.Sept.,<br />
Garching, Poster T-53.<br />
[3] Kostorz, G.; 'Neutron scattering', in "Treatise on materials science and technology"<br />
(ed. H. Herman), Vol. 15, Academic Press, New York, 1979.<br />
102
EXPERIMENTAL REPORT<br />
GeNF<br />
SANS-2<br />
In-situ SANS measurements during self healing in deformed Fe-Cu alloys<br />
Proposer:<br />
Co-Proposer(s):<br />
Experimental Team:<br />
User Group Leader:<br />
Instrument Responsible:<br />
Date(s) of Experiment: 24 th – 28 th November 2008<br />
Niels van Dijk 1 , 1 Delft University of Technology, The Netherlands<br />
Shangming He 1<br />
Niels van Dijk 1 , Shangming He 1 ,<br />
Helmut Eckerlebe 2 , 2 GKSS Research Centre <strong>Geesthacht</strong>, Germany<br />
Niels van Dijk 1<br />
Melissa Sharp 2<br />
Objectives<br />
Steels are among the most widely used construction materials as their mechanical properties<br />
can be tailored to obtain the required combination of strength and formability. However, in<br />
highly demanding applications the lifetime until failure of steels is limited due to the accumulation<br />
of damage. It was recently recognised that in aluminium alloys [1] and steels [2, 3] the<br />
growth of ultrafine cracks can be immobilised in an early stage by the formation of nanoscale<br />
precipitates. This process is known as self healing and can significantly enhance the lifetime<br />
of structural components. In order to study this process in detail we performed SANS measurements<br />
on a Fe-Cu alloy with and without deformation induced defects.<br />
Experiment<br />
In order to study the self-healing mechanism of defects by the formation of nanosized Cu<br />
precipitates, time-resolved SANS measurements on a high-purity Fe-Cu (1.1 wt.% Cu) alloy<br />
were carried out on the instrument SANS-2 using neutron wavelength of λ = 0.58 nm (10 %<br />
spread). Time-resolved SANS experiments were performed on (1) undeformed and (2) plastically<br />
deformed samples with 8 % strain at an aging temperature of 590 o C in a transverse<br />
magnetic field of 1 T for a period of 12 hours to monitor the size distribution of the Cu precipitates.<br />
Four detector distances (1 m, 3 m, 9 m, 21 m) were used together with appropriate<br />
collimation to cover scattering vectors of magnitude Q from 0.02 to 2.5 nm -1 . All the specimens<br />
were solution treated at 850 °C for 1 hour, and subsequently quenched into water before<br />
deformation and the in-situ SANS measurements.<br />
Achievements and Main Results<br />
Fig. 1 shows that both the changes<br />
of magnetic and nuclear scattering<br />
components of the deformed sample<br />
increase in the low Q section, compared<br />
to the undeformed sample.<br />
Figure 1:<br />
Changes of magnetic and nuclear scattering<br />
components of SANS intensity as<br />
a function of scattering vector for the<br />
undeformed sample and the plastically<br />
deformed sample with 8 % strain after<br />
aging at 590 o C for 12 h.<br />
ddcm -1 sr -1 )<br />
1<br />
1E-3<br />
0,1 1<br />
Q (nm -1 )<br />
Magnetic<br />
8% strain<br />
0% strain<br />
Nuclear<br />
8% strain<br />
0% strain<br />
103
Scattering Intensity (a. u.)<br />
1,1<br />
1,0<br />
0,9<br />
0,8<br />
0,7<br />
0,6<br />
0,5<br />
0,4<br />
0,3<br />
Z=1m, 8% strain<br />
Z=3m, 8% strain<br />
Z=9m, 8% strain<br />
Z=1m, 0% strain<br />
Z=3m, 0% strain<br />
Z=9m, 0% strain<br />
HV @ 600 o C<br />
0% strain<br />
150<br />
140<br />
130<br />
120<br />
110<br />
100<br />
HV 0.5<br />
Figure 2:<br />
Aging curves of sum SANS scattering<br />
intensity for the undeformed<br />
sample and the<br />
plastically deformed sample with<br />
8 % strain. For comparison, the<br />
hardness curve of undeformed<br />
sample aged at 600 o C is presented<br />
for comparison.<br />
0,2<br />
0,1<br />
0,01 0,1 1 10 100<br />
90<br />
Aging Time (h)<br />
As seen in Fig. 2, the peak of sum scattering intensity measured at the detector of 1 m is<br />
advanced by ~3 h due to pre-deformation before aging, which indicates that the deformation<br />
accelerated obviously the Cu precipitation in the Fe-Cu alloy.<br />
References<br />
[1] R.N. Lumley, A.J. Morton and I.J. Polmear, Acta Mater. 50 (2002) 3597.<br />
[2] K. Laha, J. Kyono, S. Kishimoto and N. Shinya, Scripta Mater. 52 (2005) 675.<br />
[3] K. Laha, J. Kyono and N. Shinya, Scripta Mater. 56 (2007) 915.<br />
104
EXPERIMENTAL REPORT<br />
GeNF<br />
SANS-2<br />
Test of a new fast furnace for use in a 2 T electromagnet up to 1000 °C<br />
Proposer:<br />
Co-Proposer(s):<br />
Experimental Team:<br />
User Group Leader:<br />
Instrument Responsible:<br />
Date(s) of Experiment: 18 th –20 th March 2008<br />
P. Staron 1 , 1 GKSS Research Centre <strong>Geesthacht</strong>, Germany<br />
E. Eidenberger 2 , M. Schober 2 , 2 Department Metallkunde und<br />
Werkstoffprüfung, Montanuniversität Leoben, Austria<br />
G. Kozik 1 , P. Staron 1<br />
A. Schreyer 1<br />
M. Sharp 1<br />
Objectives<br />
Precipitation reactions in metallic alloys are often studied using SANS on a series of samples<br />
aged for increasing times. However, this yields only a very limited amount of data and details<br />
of such reactions cannot be revealed. On the other hand, in-situ SANS experiments using a<br />
furnace give much better data. Ferromagnetic material like steel requires a magnetic field to<br />
saturate the samples during measurement. This puts severe limits to the dimensions of a<br />
furnace that is operated in a magnet. Moreover, often the furnace has to be fast in order to<br />
enable a study of the early stages of a decomposition reaction.<br />
Experiment<br />
In this experiment, a new furnace was tested that was specially developed for use in the 2 T<br />
electromagnet that is available for the SANS-2 at the GeNF. The furnace fits between the<br />
pole shoes of the magnet. The maximum magnetic field measured at the sample position<br />
was 1.3 T. The furnace has a ceramic heating element in direct contact with the sample and<br />
a water-cooled housing. The housing can be evacuated (and filled with protecting gas). A<br />
heat shield can be used, but is not required. In the current version there are 1 mm thick Al<br />
windows for the neutron beam. In this experiment, no heat shield was used and the furnace<br />
was evacuated, no protecting gas was used.<br />
The samples used for this test were a Fe-25 at.% Co-9 at.% Mo alloy and a Fe-1 at.% Cu<br />
alloy with a thickness of about 2 mm and a diameter of 25 mm. Both alloys form second<br />
phase precipitates upon aging. They have different levels of supersaturation, leading to different<br />
reaction kinetics. In Fe-1 at.% Cu precipitates are known to form via nucleation and<br />
growth, whereas in the Fe-25 at.% Co-9 at.% Mo alloy spinodal decomposition is assumed to be<br />
involved. Therefore, the early stages of these reactions are of special interest. A neutron wavelength<br />
of 5.8 Å (10 % selector) and a detector distance of 1 m were used for the measurements.<br />
The neutron beam had a diameter of 8 mm and all collimating elements were<br />
removed.<br />
Achievements and Main Results<br />
A most important requirement was that the furnace heats the sample fast enough to gain<br />
access to early stages of the reaction. Figure 1 shows that a sample temperature of 500 °C<br />
was reached within about 100 seconds. This is fast enough to study early stages of decomposition<br />
reactions. Another limitation is given by the shortest data acquisition time required<br />
for sufficient statistics. This depends on the source flux, scattering contrast, volume fraction<br />
of scatterers, and background. For the Fe-Co-Mo alloy 30 s were enough to gain valuable<br />
SANS data. The Fe-Cu alloy has a smaller volume fraction of precipitates, thus 60 s were<br />
used.<br />
105
Therefore, the test of the new furnace was a full success, providing users with a new fast<br />
furnace for SANS measurements on ferromagnetic materials in a magnetic field up to about<br />
1.5 T at temperatures up to 1000 °C.<br />
The integrated intensity could be evaluated from the very beginning of the measurements<br />
(Fig. 2). It shows the different reaction kinetics for the two different materials.<br />
Future developments of the furnace will be concerned with faster heaters, different window<br />
materials, and higher magnetic fields.<br />
Figure 1:<br />
Temperature recordings<br />
for the two measurements.<br />
Figure 2:<br />
Magnetic integrated intensity<br />
calculated for the two measurements<br />
within the covered<br />
scattering vector interval.<br />
Reference<br />
[1] E. Eidenberger, E. Stergar, H. Leitner, C. Scheu, P. Staron, H. Clemens, Precipitates in a Fe-Co-Mo<br />
alloy characterized by complementary methods, Berg- und Hüttenmännische Monatshefte (BHM)<br />
153 (2008) 247–252.<br />
106
EXPERIMENTAL REPORT<br />
GeNF<br />
SANS-2<br />
SANS and 3DAP as methods to study precipitates in a Fe-Co-Mo alloy<br />
Proposer:<br />
Co-Proposer(s):<br />
Experimental Team:<br />
User Group Leader:<br />
Instrument Responsible:<br />
E. Eidenberger 1 , M. Schober 1 , E.Stergar 1<br />
1 University of Leoben, Department of Physical Metallurgy and<br />
Materials Testing, Leoben, Austria<br />
P. Staron 2 , 2 GKSS Research Centre <strong>Geesthacht</strong>, Germany<br />
E. Eidenberger 1 , M. Schober 1 , P. Staron 2<br />
H. Clemens 1<br />
M. Sharp 2<br />
Date of Experiment: 25 th –30 th April 2008<br />
Objectives<br />
A possibility to evaluate magnetic and nuclear small angle scattering (SANS) curves is the<br />
calculation of the ratio of magnetic to nuclear scattering contrast. This ratio,<br />
2<br />
2<br />
R Q m<br />
Q n<br />
( mag<br />
) ( nuc<br />
) , depends on the chemical composition of the scattering<br />
particles, where Q m and Q n are the integral intensities of the magnetic and nuclear scattering<br />
curves, respectively, and mag and nuc are the magnetic and nuclear scattering contrast<br />
between matrix and precipitates. A theoretical R-value can also be calculated from the<br />
chemical compositions of matrix and precipitates via the scattering contrast. Therefore,<br />
R-values calculated from the scattering curves can be compared to such obtained from<br />
chemical compositions determined e.g. by 3-dimensional atom probe (3DAP) measurements<br />
(Fig. 1). For this, the magnetism of the precipitates has to be taken into account. The intention<br />
of this study was to investigate the comparability of SANS and 3DAP measurements via<br />
the R-value under the consideration of magnetic particles. First comprehensive studies of the<br />
precipitation behaviour of the -phase (Fe,Co) 7 Mo 6 in a Fe-25 at.% Co-9 at.% Mo alloy have<br />
been conducted by Leitner et al. and Eidenberger et al. [1, 2].<br />
Figure 1: Reconstructed volume of an aged sample. For a better visualization, elemental distributions<br />
for Fe, Co, Si, and Mo are shown separately.<br />
Experiment<br />
Investigations were performed on a sample of Fe-25 at.%Co-9 at.%Mo with minor additions<br />
of Si. 3DAP measurements on an exemplarily aged sample were conducted to visualize the<br />
nm-sized precipitates in the alloy. Statistical information on the precipitates was obtained by<br />
107
small-angle neutron scattering. For SANS investigations, 2 mm thick slices with co-planar<br />
surfaces were cut from solution annealed material. The samples were heated in the neutron<br />
beam to 700 °C with constant heating rates ranging from 7 K/min to 34 K/min using a newly<br />
implicated in-situ furnace. Scattering vectors q from 0.1 to 2.4 nm –1 were covered using an<br />
unpolarized monochromatic neutron beam with a wavelength of = 0.58 nm and a wavelength<br />
spread of / = 10 %. A pinhole with a diameter of 8 mm was used and the sample<br />
was magnetized to saturation in a field of 1.3 T. The data acquisition time was set to 30 s for<br />
the complete measurement. The nuclear and magnetic cross sections were extracted separately<br />
from the detector images and the integrated intensities Q n and Q m were calculated for<br />
all measurement files. Additionally, the ratio of Q m /Q n (R-value) was compared with the<br />
R-value calculated for the equilibrium -phase. The results of ab-initio calculations concerning<br />
the magnetic moment of the precipitates were implicated in the calculation of the theoretical<br />
R-value.<br />
Achievements and Main Results<br />
A representative example of a 3DAP reconstructed sample volume is depicted in Figure 1.<br />
The elemental distributions of Fe, Co, Si, and Mo are separately shown for a better visualization.<br />
Precipitates enriched in Mo and Si are apparent.<br />
The ab-initio calculations showed that the equilibrium -phase carries a considerable magnetic<br />
moment of 6.6 B per unit cell of 13 atoms, hence it was included in the calculations of<br />
the theoretical R-value. The R-value for the equilibrium -phase obtained by these calculations<br />
is 12.<br />
Q n and Q m vs. sample temperature are shown in Figure 2. Additionally, the R-value of the<br />
precipitates is shown in this figure linked to the right hand side axis. The theoretical R-value<br />
of 12 derived from the chemical compositions gained from 3DAP data plus ab-initio investigations<br />
is also visible in Figure 2 as a broken line.<br />
The present study shows that for the investigated material the R-value increases rapidly after<br />
reaching a temperature of about 430 °C. A maximum R-ratio of ca.12 is found at a sample<br />
temperature of about 550 °C which coincides with the theoretical value calculated for the<br />
equilibrium phase.<br />
50<br />
14<br />
Q [10 21 cm –4 ]<br />
40<br />
30<br />
20<br />
10<br />
0<br />
Fe-25at%Co-9at%Mo<br />
Q m<br />
Q n<br />
R-value<br />
200 400 600<br />
Temperature [°C]<br />
12<br />
10<br />
8<br />
6<br />
4<br />
2<br />
0<br />
Figure 2:<br />
R-value (black dots) and nuclear<br />
and magnetic scattering intensities<br />
(blue circles and red triangles,<br />
respectively) vs. sample temperature<br />
for a heating rate of 15 K/min.<br />
The theoretical R-value calculated<br />
for the equilibrium -phase is shown<br />
by as broken line.<br />
References<br />
[1] H. Leitner, M. Schober, H. Clemens, D. Caliskanoglu, F. Danoix, Int. J. Mat. Res. 99 (2008) 4.<br />
[2] E. Eidenberger, E. Stergar, H. Leitner, C. Scheu, P. Staron, H. Clemens. BHM 153 (2008) 247–252.<br />
108
EXPERIMENTAL REPORT<br />
GeNF<br />
SANS-2<br />
In-situ SANS characterisation of the precipitation behaviour of Fe-Cu and<br />
Fe-Ni-Al<br />
Proposer:<br />
Co-Proposer:<br />
Experimental Team:<br />
User Group Leader:<br />
Instrument Scientist:<br />
M. Schober 1 , E. Eidenberger 1 University of Leoben, Department<br />
of Physical Metallurgy and Materials Testing, Leoben, Austria<br />
P. Staron 2 , 2 GKSS Research Centre <strong>Geesthacht</strong>, Germany<br />
E. Eidenberger 1 , M. Schober 1 , C. Lerchbacher 1 , P. Staron 2<br />
H. Clemens 1<br />
Helmut Eckerlebe 2<br />
Date(s) of Experiment: 24 th November – 8 th December 2008<br />
Objectives<br />
Simple model alloys with one or two alloying elements are perfect materials to study the precipitation<br />
evolution in principal. This project deals with the question of Cu and Ni-Al precipitates<br />
in a Fe matrix. Understanding the prevailing precipitation reactions in the investigated<br />
materials is of vital importance for an adequate improvement of simulations. In this project<br />
SANS is the main technique used to determine the size distribution and the precipitated volume<br />
in the model alloys. With in-situ SANS it is possible to study the evolution from a solid<br />
solution over the clustering process to the precipitates. However, a comprehensive characterization<br />
of all stable and metastable phases is still a great challenge and requires the combined<br />
use of high resolution methods. The generated SANS data is compared to results<br />
gained by direct methods like TEM and atom probe data [1]. With the calculated R-values,<br />
derived from the in-situ experiments, the development of the chemical composition of occurring<br />
precipitates should be possible.<br />
Cu<br />
Figure 1a: 3-dimensional reconstruction of a<br />
Fe-1.0 at.% Cu alloy aged for 10000 sec at<br />
500°C (Cu atoms disp.).<br />
Al, Ni<br />
Figure 1b: 3-dimensional reconstruction of a<br />
Fe-6 at.% Ni-6 at.% Al alloy aged for 3600 sec<br />
at 500°C (Al, Ni atoms disp.).<br />
Experiment<br />
The investigated materials are self-produced iron based model alloys with a copper content<br />
0.5 at.% to 1.5 at.% on the one hand and alloyed with nickel and aluminium 4at% to 6at%,<br />
respectively on the other hand. The samples exhibit a disc-shaped form with 24 mm in diameter<br />
and 2 mm thickness.<br />
The disc-shaped samples were mounted between two ceramic heating elements, which hold<br />
the sample in position and heat the sample at the same time. This construction was surrounded<br />
by a water cooled aluminium housing. To prevent the sample from oxidation the<br />
interior space was flooded with helium. This furnace was placed into a 2T electromagnet<br />
available at SANS-2. A neutron wavelength of 5.8 Å and a detector distance of 1 m were<br />
used for the in-situ experiments.<br />
109
The main experiment was an isothermal aging process on solution annealed samples.<br />
Therefore, the samples were heated up to 500 °C in less then 100 s and were held at this<br />
temperature during the experiment. The data acquisition time was set to 30 s during the initial<br />
precipitation reaction and after 1h the acquisition time window was set to 60 s for the rest<br />
of the measurement.<br />
Before the first experiment, the sample temperature was calibrated using additional thermocouples<br />
attached to the sample surface where the neutron beam impinges. Additional experiments<br />
with variations in the aging temperature and the Cu concentration as well as<br />
continuous heating experiments were also performed.<br />
Achievements and Main Results<br />
This kind of in-situ measurements generated a lot of data files, respectively scattering<br />
curves, which have to be analysed. Therefore, some modifications of the analysis routine<br />
had to be done to handle all these files. For the R-value identification the integral intensities<br />
of the nuclear and magnetic scattering curves Q n and Q m , respectively, were calculated [2].<br />
The R-value is defined as R = Q m /Q n and depends on the chemical composition of matrix and<br />
precipitates.<br />
Figure 2a exhibits the R-value over aging time for the Fe-1at.% Cu model alloy. Because of a<br />
classical nucleation and growth process of Cu precipitates in the iron matrix, an incubation<br />
time, in this case of 1000 seconds, is evident. After approximately 3000 seconds the R-value<br />
and hence the chemical composition of the precipitates stays constant. In Figure 2b the<br />
R-value over aging time is shown for Fe-6at.% Ni-6at.% Al, where almost no incubation time<br />
is observed.<br />
Q [10 21 cm -4 ]<br />
2,0<br />
1,8<br />
1,6<br />
1,4<br />
1,2<br />
1,0<br />
0,8<br />
0,6<br />
0,4<br />
0,2<br />
0,0<br />
Fe-1at.% Cu<br />
T = 500 °C<br />
Q m<br />
Q n<br />
R<br />
0<br />
100 1000 10000 100000<br />
Time [s]<br />
Figure 2a: R-value over aging time for the<br />
Fe-1 at.% Cu alloy aged 500°C for 35000 s.<br />
15<br />
10<br />
5<br />
R-value<br />
Q [10 21 cm –4 ]<br />
14<br />
12<br />
10<br />
8<br />
6<br />
4<br />
2<br />
0<br />
Fe-6at.% Ni-6at.%Al<br />
T = 500 °C<br />
Q m<br />
Q n<br />
R<br />
0<br />
100 1000 10000 100000<br />
Time [s]<br />
b: R-value over aging time for the Fe-6 at.%<br />
Ni-6 at.% Al aged at 500°C for 37000 s.<br />
15<br />
10<br />
5<br />
R-value<br />
For a detailed quantitative analysis of the chemical composition by use of the R-value the<br />
exact magnetic and nuclear scattering densities of the matrix are needed. Therefore, the<br />
atom probe measurements have to be analysed first to get the matrix concentrations. The<br />
idea is to cross check the chemical concentrations of SANS and atom probe measurements.<br />
Moreover, particles sizes and volume fractions as a function of aging time can be compared<br />
with model predictions.<br />
References<br />
[1] M.E. Fine, J.Z. Liu, M.D. Asta, Mat. Sci. Eng. A, 463 (2007), 271–274<br />
[2] G. Kostorz, in: G. Kostorz, H. Herman (Eds.), Treatise on Materials Science and Technology,<br />
Vol. 15, Neutron Scattering, Academic Press (1979).<br />
110
EXPERIMENTAL REPORT<br />
GeNF<br />
SANS-2<br />
Proposer:<br />
Co-Proposer(s):<br />
Experimental Team:<br />
User Group Leader:<br />
Instrument Responsible:<br />
In situ investigation on the evolution of nano-sized<br />
precipitates in a tungsten rich Ni-alloy<br />
R. Gilles 1 , 1 TU München, FRM2 Garching, Germany<br />
D. Mukherji 2 , 2 TU Braunschweig, IfW, Germany<br />
P. Strunz 3 , 3 Nuclear Physics Institute, 25068 Rez near Prague,<br />
Czech Republic<br />
R. Gilles 1 , H. Eckerlebe 4 , G. Kozik 4 , W. Hornauer 1 , M. Sharp 4<br />
4 GKSS Research Centre <strong>Geesthacht</strong>, Germany<br />
R. Gilles 1<br />
H. Eckerlebe 4<br />
Date(s) of Experiment: 09 th – 12 th June 2008<br />
Objectives<br />
The synthesis of nano-particles with controlled size and composition is of fundamental and<br />
technological interest. A variety of physical and chemical methods have been employed to<br />
synthesize nanosize powders of semiconductors, metals, oxides and other inorganic<br />
materials. There are different techniques available for the synthesis of nano-particles. The<br />
main methods are sputtering, laser ablation, inert gas condensation, chemical methods such<br />
as reduction reactions solgel and wet chemical processes, etc. Although many of these<br />
processes can successfully synthesize nanosized multi-component crystallites of metals,<br />
difficulties remain in controlling the composition and homogeneity of these nanomaterials [1].<br />
An alternative way has been developed by us to produce nanosized intermetallic particles of<br />
complex chemistry from two phase metallic alloys – for example by extracting the Ni 3 Al-type<br />
intermetallic phase from Ni-superalloys by selectively leaching the matrix phase [2, 3]. For<br />
many applications it is critical to control the particle size and distribution during the nanoparticle<br />
synthesis, preferably to a monodispersive size. This is a challenge for many of the<br />
synthesis processes used today and is also an issue in our method of synthesis.<br />
Figure 1 shows a TEM image of the extracted Ni 3 Al nano-particles. It is obvious that the<br />
particles show a dispersion in size. In the process we adopted for the synthesis of the nanoparticles,<br />
the particle size is actually controlled in the<br />
base alloy prior to their extraction. Suitable heat<br />
treatments are adopted to control the size of the Ni 3 Al<br />
precipitate in Ni-superalloys. These precipitates are<br />
coherent with the matrix and their size, shape and<br />
distribution is a result of a complex interaction of the<br />
lattice mismatch (matrix/precipitate) and the process<br />
of precipitate growth (Ostwald ripening) at the high<br />
temperatures. For the extremely fine sizes desired for<br />
the nano-particles [~20 nm], even nucleation of the<br />
precipitates at the high temperatures is a critical<br />
parameter for the size control. In conventional<br />
microscopic techniques the study of the precipitate<br />
behaviour at high temperatures is not simple,<br />
particularly when the temperatures are high. In-situ<br />
measurements at high temperature by SANS make<br />
111<br />
Figure 1: TEM image of extracted Ni 3 Al<br />
nano-particles.
these observations possible. The aim of the SANS meas-urement is to study the Ni 3 Al<br />
precipitates evolution at high temperatures up to 1000 °C. The results will give us a better<br />
understanding of the nucleation and growth processes, which can be used to control the size<br />
of the nano-particles in the extraction method adopted.<br />
Experiment<br />
Solid samples from a tungsten rich single crystal Ni-base superalloy (designated W3SX) were<br />
measured at the SANS-2 facility. The mean neutron wavelength was = 0.58 nm (/ = 0.2).<br />
The range of the scattering vector (110 -2 nm -1 < q < 2 nm -1 ) was covered by 4 sampledetector<br />
distances (1 m, 3 m, 9 m, 21 m) with appropriate collimations. Discs with a diameter<br />
of 25 mm were mounted in the new fast in-situ furnace at SANS-2 with a ceramic heating<br />
element. Prior to the in-situ measurements the samples were heat treated ex-situ to create a<br />
dispersion of very small precipitates in the samples. In-situ measurements were made at<br />
temperatures of 800 °C, 900 °C and 1000 °C, a data acquisition time of 900 s (for sampledetector<br />
distances 1 m, 3 m, 9 m) and of 1800 s (for sample-detector distances 21 m) was<br />
used. Measured intensity was corrected for sample transmissions, background and detector<br />
efficiency. The absolute cross section was calculated by comparison with the incoherent<br />
scattering of vanadium.<br />
Achievements and Main Results<br />
Depending on the hold temperature and time, different precipitate size distributions were<br />
obtained in the alloy. New precipitation was detected on cooling from 1000 °C (Fig. 2), but<br />
not from 800 °C (Fig. 3) and 900 °C, after the in-situ measurements. A different growth characteristics<br />
of the bigger and the smaller precipitates were also observed, which provided a<br />
clue – on how to obtain a fine and monodisperssive Ni 3 Al precipitates in the alloy. Further<br />
experiments are however, needed to understand the nucleation process at high temperatures.<br />
particle density n [1/cm 3 ]<br />
1E18<br />
1E17<br />
1E16<br />
1E15<br />
1E14<br />
1E13<br />
particles size<br />
distribution n(R)<br />
at T = 1000 °C<br />
particle density n [1/cm 3 ]<br />
1E18<br />
1E17<br />
1E16<br />
1E15<br />
1E14<br />
1E13<br />
particles size<br />
distribution n(R)<br />
at T = 800 °C<br />
1E12<br />
1E12<br />
1E11<br />
1 10 100<br />
Radius R [nm]<br />
1E11<br />
1 10 100<br />
Radius R [nm]<br />
Figure 2: Particle size distribution n(R)<br />
Figure 3: Particle size distribution n(R)<br />
T = 1000 °C for t = 17 h. T = 800 °C for t = 46 h.<br />
References<br />
[1] Pithawalla Y.B., Deevi S.C. and El-Shall M.S., 2002 Mater. Sci. Eng. A 329–331, 92.<br />
[2] Mukherji D., Müller R., Gilles R., Strunz P. and Rösler J., 2004 Nanotechnology 15, 648.<br />
[3] Mukherji D., Pigozzi G., Schmitz F., Näth O., Rösler J. and Kostorz G., 2005 Nanotechnology 16,<br />
2176.<br />
112
EXPERIMENTAL REPORT<br />
GeNF<br />
SANS-2<br />
Small-angle scattering from a creep tested Mg alloy<br />
Proposer:<br />
Su Xu 1 , 1 CANMET-Materials Technology Laboratory, Ottawa,<br />
Ontario, Canada K1A 0G1<br />
Co-Proposer(s):<br />
Experimental Team:<br />
User Group Leader:<br />
Instrument Responsible:<br />
Date of Experiment: September 2008<br />
M. Sharp 2 , P. Staron 2 , 2 GKSS Research Centre, <strong>Geesthacht</strong>,<br />
Germany<br />
Su Xu 1<br />
M. Sharp 2<br />
Objectives<br />
Magnesium alloys have seen a recent increase in interest for their weight reduction potential<br />
for use in the automotive sector [1]. One interesting observation in Mg alloy creep is the<br />
creep asymmetry of randomly-textured cast Mg alloys, which manifests itself as significantly<br />
different creep rates during tensile and compressive loading. As the critical loading mode for<br />
Mg alloys in some high temperature automotive applications is compressive, characterization<br />
of creep under compression and study of the underlying mechanisms of the tensilecompressive<br />
creep asymmetry are of great interest.It has been shown that the hightemperature<br />
deformation behaviour of Mg alloys under tension is sometimes significantly<br />
different from that under compression [2, 3]. The mechanisms underlying the creep asymmetry<br />
are still not clear yet and are under investigation at CANMET-MTL. The objective of the<br />
proposed work is to find out more about changes in the microstructure during creep testing.<br />
Especially the formation of nano-scaled second phase precipitates or creep pores is of interest.<br />
This information may be used to understand the tensile-compressive creep asymmetry.<br />
Figure 1:<br />
The two dog-bone shaped samples mounted in<br />
the diffractometer ARES-2. The same samples<br />
were used for the SANS measurement.<br />
Experiment<br />
The samples for this study were cast<br />
through the high pressure die casting<br />
(HPDC) process. The samples were cast<br />
directly into the final dog-bone shape with a<br />
diameter of 6.3 mm. The HPDC die skin<br />
contains finer grains (~5 µm) than the interior<br />
of the samples (~14 µm). The compositional<br />
variations are expected to be small<br />
due to the rapid cooling. For the HPDC<br />
sample, die skin has a depth of ~300 µm.<br />
113
SANS scattering curves were measured for two dog-bone shaped samples; one sample was<br />
strained to fracture, the other sample was creep tested. Three different detector distances in<br />
combination with appropriate collimations were used. The neutron wavelength was 5.8 Å.<br />
Achievements and Main Results<br />
Significantly higher intensity was observed in the high-q region for the creep tested sample in<br />
comparison to the sample that was strained to fracture (i.e. without thermal effects from<br />
creep testing) (Fig. 2). However, the origin of this scattering intensity is not yet clear. This<br />
first measurement served as a feasibility study to see if significant changes in the microstructure<br />
can be observed at all. The current results seem to be encouraging for further measurements<br />
on a set of samples with systematically varying test parameters.<br />
Figure 2:<br />
SANS scattering curves<br />
of two deformed dog-bone<br />
samples.<br />
References<br />
[1] R.J. Osborne, G.S. Cole, B.M. Cox, D.E. Penrod, USCAR Project on Magnesium Structural Castings,<br />
Proc. IMA 2000 Magnesium Conf., Vancouver, BC, Canada, May 21–23, 2002, IMA, pp. 1–5.<br />
[2] S.R. Agnew, S. Viswanathan, E.A. Payzant, Q. Han, K.C. Liu, E.A. Kenik, Tensile and Compressive<br />
Creep Behaviour of Magnesium Die Casting Alloys Containing Aluminium, Proc. Conf. on<br />
Magnesium Alloys and their Applications, ed. K.U. Kainer, Munich, Germany, Sept. 26–28, 2000,<br />
pp. 687–692.<br />
[3] S. Xu, M.A. Gharghouri, and M. Sahoo, Tensile-Compressive Creep Asymmetry of Recent Die<br />
Cast Magnesium Alloys, Advanced Engineering Materials, Vol. 9, No. 9, 2007, pp. 807–812.<br />
114
EXPERIMENTAL REPORT<br />
GeNF<br />
SANS-2<br />
In-situ study of the formation of nano-precipitates in AA6xxx alloys<br />
Proposer:<br />
Co-Proposer(s):<br />
Experimental Team:<br />
User Group Leader:<br />
Instrument Responsible:<br />
W.V. Vaidya 1 , 1 GKSS Research Centre <strong>Geesthacht</strong>, Germany<br />
H. Eckerlebe 1 , P. Staron 1<br />
H. Eckerlebe 1 , G. Kozik 1<br />
N. Huber 1<br />
H. Eckerlebe 1<br />
Date(s) of Experiment: 13 th – 16 th June 2008<br />
Objectives<br />
The alloy AA6056 is being considered as one of the candidate alloys for airframes [1, 2]. Essentially,<br />
this is a weldable AlMgSiCu alloy which can be precipitation hardened to different<br />
strength levels. The alloy contains Mg and Si to form, e.g., Mg 2 Si precipitates. In the T4 temper<br />
(underaged) the strength is low but can be improved by suitable heat treatments such as<br />
T6 (peak-ageing) or T78 (overageing). The alloy AA6013 has a different Cu content, which<br />
can influence the precipitation kinetics. Although both alloys have been used for a long time<br />
and numerous publications on the characterization of the strengthening precipitates can be<br />
found, some details of the precipitation sequence and kinetics are not yet known very well.<br />
Therefore, the objective of the current study is, first of all, to test the new in-situ furnace for<br />
application to Al alloys, and, secondly, to start studying the influence of temperature and<br />
composition on the formation of the strengthening precipitates.<br />
Experiment<br />
Sheets of the AA6056 and AA6013 alloys with a thickness of 3.2 mm were solution treated<br />
and pre-aged to obtain a defined reference state similar to T4. Discs with a diameter of<br />
25 mm were cut from the sheets. The samples were mounted in the new fast in-situ furnace<br />
at SANS-2 with a ceramic heating element. A temperature of 250 °C was reached after approximately<br />
150 s (Fig. 1). This heating speed can still significantly be improved by optimising<br />
the parameters of the controlling unit of the heater. A neutron wavelength of 5.8 Å (10 %<br />
selector) and a detector distance of 1 m were used for the measurements. The neutron beam<br />
had a diameter of 8 mm and all collimating elements were removed. A data acquisition time<br />
of 30 s was used, providing sufficient intensity on the area detector.<br />
Figure 1:<br />
Temperature curves for two runs<br />
at T = 190 °C and T = 250 °C.<br />
115
Achievements and Main Results<br />
The integral intensity Q was evaluated from the very beginning of the measurements. Figure<br />
2 shows results after subtraction of a background contribution. It can be seen that there are<br />
different reaction kinetics for the two alloys (Fig. 2b and c) and that also the temperature<br />
plays a significant role (Fig. 2a). Further measurements are required to continue this work.<br />
Figure 2:<br />
Integral intensities Q<br />
for three different runs.<br />
a)<br />
b)<br />
c)<br />
References<br />
[1] K.-H. Rendigs, Mater. Sci. Forum 242 (1997) 11–24.<br />
[2] P. Lequeu, P. Lassince, T. Warner, G.M. Raynaud, Aircraft Engineering and Aerospace Technology<br />
73 (2001) 147–159.<br />
116
EXPERIMENTAL REPORT<br />
GeNF<br />
SANS-2<br />
Spin chirality of the helix in Mn 1-y Fe y Si.<br />
Proposer:<br />
Co-Proposers:<br />
Experimental Team:<br />
Sergey Grigoriev 1 , 1 PNPI, Gatchina, St-Petersburg (Russia)<br />
Vadim Dyadkin 1 , Yiry Chetverikov 1 , Daniel Lamago 2 ,<br />
Dirk Menzel 3 , 2 Laboratory Leon Brellouin (France), 3 Technische<br />
Universität Braunschweig (Germany)<br />
Sergey Grigoriev 1 , Vadim Dyadkin 1 , Helmut Eckerlebe 4 ,<br />
4 GKSS Research Centre <strong>Geesthacht</strong>, Germany<br />
User Group Leader:<br />
Instrument scientist:<br />
Sergey Grigoriev 1<br />
Helmut Eckerlebe 4<br />
Date(s) of Experiment: October 2008<br />
Objectives<br />
The cubic B20-type (space group P2 1 3) of mixed crystal Mn 1-y Fe y Si orders below T C in the<br />
helical spin structure [1, 2]. The helicity of the magnetic structure of Mn 1-y Fe y Si is induced by<br />
the exquisite interplay between the isotropic ferromagnetic exchange interaction and the antisymmetric<br />
Dzyaloshinskii-Moriya (DM) interaction caused by the lack of a symmetry centre<br />
in the arrangement of magnetic metal atoms [3-6]. A weak anisotropic exchange interaction<br />
fixes the helix propagation vector k along the cube diagonals. This spiral wave vector is determined<br />
as k = SD/A, where D is the Dzyaloshinskii vector and A is the spin wave stiffness,<br />
and S is the spin [6]. The sign of the Dzyaloshinskii vector is directly connected to the sign of<br />
the wavevector k, which, in turn, determines the handedness (chirality) of the helical structure.<br />
The present experiment was aimed to measure the sign of k, or chirality of the magnetic<br />
system, for different concentration y of the Mn 1-y Fe y Si compound using small-angle polarized<br />
neutron diffraction.<br />
Experiment<br />
1. Sample: The single crystals Mn 1-y Fe y Si with y = 0.06, 0.08, and 0.10 (at.%) grown by the<br />
Bridgmann method were discs with a thickness of 3 mm and a diameter of 30 mm. The single<br />
crystals with y = 0 and 0.09 grown by the Chokhralski method were discs with a thickness<br />
of 2 mm and a diameter of 6 mm.<br />
2. Method: Small-angle neutron scattering (SANS) measurements are carried out with the<br />
instrument SANS-2 at the <strong>Geesthacht</strong> Neutron Facility (GeNF). Polarized neutron beam with<br />
the polarization P 0 = 0.93, with a mean wavelength of = 0.58 nm and a wavelength spread<br />
of / = 10 % were used. Sample - Detector distance of 6 m (for y = 0) and 3 m (for y =<br />
0.06, 0.08, 0.09, 0.10) were used with appropriate collimations to cover scattering vectors q<br />
from 0.1 nm -1 to 0.9 nm -1 . A weak magnetic field (1 mT) guiding the polarization was applied<br />
perpendicularly to the neutron beam.<br />
The polarized neutron diffraction is known as an ideal tool for measuring the spin chirality [8].<br />
As it is known the pure magnetic elastic cross-section of the polarized neutrons consists of<br />
polarization-independent and polarization-dependent parts. The latter part is also asymmetric<br />
with respect to the momentum transfer Q and associated to the average chirality of the<br />
magnetic system. It can be determined by one of the following methods: by measuring the<br />
difference between the scattering intensities taken from the incident neutron beam with the<br />
polarization along (up) and opposite (down) to the guiding magnetic field at the fixed position<br />
117
in the momentum space Q, or, by measuring the difference between the scattering intensities<br />
at two distinct Bragg points Q and -Q with a fixed incident polarization. The difference<br />
between two intensities normalized to their sum is considered as a measure of the chirality of<br />
the system<br />
Achievements and Main Results<br />
Using the position sensitive detector we measured maps of the scattering intensity at different<br />
Q with a fixed incident polarization P 0 (Fig.1) but particularly at two distinct Bragg points<br />
Q = k and Q = -k, providing that k || P 0 . Figure 1 shows maps of the polarized SANS intensities<br />
for four other samples Mn 1-y Fe y Si with y = 0.0; y = 0.06 (b), y = 0.08 (c), and y = 0.1 (d) at<br />
T ≈ 8 K. It is well known [3,4] that MnSi shows always the left-handed helix. This is well illustrated<br />
in Fig.1 a by the presence of the only reflection on the left side of the detector. The<br />
symmetric reflection on the right side is forbidden in accord to [8]. This sample and the corresponding<br />
scattering map is considered an etalon for other measurements.<br />
a<br />
P 0 P 0<br />
c<br />
P 0<br />
b<br />
d<br />
SANS maps of intensity for Mn 1-y Fe y Si with<br />
(a) y = 0; (b) y = 0.06; (c) y = 0.08; (d) y = 0.1.<br />
P 0<br />
Figure 1:<br />
The scattering maps of the samples with y = 0.06, 0.08 (Fig. 1b, c) and y = 0.09 (not shown)<br />
give maximum of intensity at the left side of the detector similar to MnSi. It means that these<br />
four compounds (a, b, c) have the same chirality, i.e. left-handed helices. On contrary, the<br />
sample with y = 0.1 shows scattering at the right side (Fig.1d).<br />
This compound has the opposite to MnSi chirality, i.e. right-handed helices. This observation<br />
shows that there is a flip of chirality near the concentration y = 0.1 similar to that observed in<br />
Fe 1-x Co x Si at x = 0.2 [7]. One concludes that the sign of the Dzyaloshinskii constant D<br />
changes along with the chirality flip at y = 0.1 [5,6].<br />
To clarify the nature of this flip we measured absolute crystallographic structure of all the<br />
samples using the synchrotron radiation at Swiss-Norwegian Beamlines at ESRF. This experiments<br />
showed that all samples with left-handed spin chirality have well known position of<br />
atoms in P2 1 3 structures: (u,u,u), (1/2+u,1/2-u,u), (1/2-u,-u,1/2+u), (-u,1/2+u,1/2+u) with uMn<br />
= 0.138 and uSi = 0.845. Only the sample with y = 0.1 has u shifted in ¼ unit cell parameter<br />
along axes, i.e. uMn = 0.388 and uSi = 0.095. Figure 2 presents the two crystals with<br />
both atomic configurations viewed along [111] axis. As is well seen the configurations for the<br />
red metallic atoms are right handed for y = 0.08 and is left handed for y = 0.1.<br />
118
Mn 0.92 Fe 0.08 Si<br />
Si<br />
Mn/Fe<br />
Mn 0.9 Fe 0.1 Si<br />
Figure 2: The atomic configurations of Mn 0.92 Fe 0.08 Si (left) and Mn 0.9 Fe 0.1 Si (right) along the [111] axis.<br />
Black spirals help to identify the sense of skewing.<br />
Conclusion<br />
We give experimental evidence for the flip of the spin helix chirality which is accompanied<br />
and, probably, caused by the change of the structural chirality at y = 0.1. The handedness of<br />
the crystal is flipped through the shift of atom position u along axes for ¼ of the unit<br />
cell.<br />
References<br />
[1] Y. Nishihara, S. Waki, and S. Ogawa, Phys. Rev. B 30, 32 (1984)<br />
[2] N. Manyala, Y. Sidis, J. F. DiTusa, G. Aeppli, D. P. Young, Z. Fisk, Nature London 404, 581<br />
(2000).<br />
[3] Y. Ishikawa, K. Tajima, D. Bloch and M. Roth, Solid State Commmun. 19 (1976) 525.<br />
[4] Y. Ishikawa, G. Shirane, J.A. Tarvin, M. Kohgi, Phys. Rev. B 16 (1977) 4956.<br />
[5] I.E. Dzyaloshinskii, Zh. Eksp. Teor. Fiz. 46, 1420 (1964).<br />
[6] P.Bak, M.H.Jensen, J.Phys. C13, L881 (1980).<br />
[7] S.V. Grigoriev, E. Moskvin, V. Dyadkin, D. Menzel, GKSS Report 2008/6, 133; S.V. Grigoriev,<br />
D. Chernyshov, V.A. Dyadkin, V. Dmitriev, S.V. Maleyev, E.V. Moskvin, D. Menzel, J. Schoenes,<br />
and H. Eckerlebe, Phys. Rev. Lett. accepted (2008).<br />
[8] S.V. Maleyev, Phys. Rev. Lett. 75, 4682 (1995).<br />
119
120
EXPERIMENTAL REPORT<br />
GeNF<br />
SANS-2<br />
Thickness and wavelength dependence of the SANS intensity<br />
from highly-ordered Al 2 O 3 matrix<br />
Proposer:<br />
Co-Proposers:<br />
Experimental Team:<br />
Sergey V. Grigoriev 1 , 1 PNPI, Gatchina, St-Petersburg, Russia<br />
Natalia Grigoryeva 2 , 2 SPSU, St-Petersburg, 198504, Russia<br />
Kirill Napolskii 3 , 3 MSU, Moscow, Russia<br />
Arseny V. Syromyatnikov 1 ,<br />
Sergey V. Grigoriev 1 , Natalia Grigoryeva 2 , Kirill Napolskii 3 ,<br />
Andrey Chumakov 1 , Melissa Sharp 4 , Helmut Eckerlebe 4 ,<br />
4 GKSS Research Centre <strong>Geesthacht</strong>, Germany<br />
User Group Leader:<br />
Instrument scientist:<br />
Sergey V. Grigoriev 1<br />
Melissa Sharp 4 , Helmut Eckerlebe 4<br />
Date(s) of Experiment: 2 nd July – 9 th July 2008<br />
Objectives<br />
The explosive growth of the production of periodic nanostructures requires both development<br />
of new characterization tools and re-commissioning of established ones. Until recently, the<br />
small angle neutron (SANS) and x-ray (SAXS) scattering were mostly applied to disordered<br />
state of matter at the nanoscale. Structure periodicity transforms diffuse scattering into diffraction<br />
with its characteristic Bragg peaks. The naive expectation that the small angle diffraction<br />
on nanostructures should be similar to that on the atomic structure is sometimes<br />
unjustified. The origin is that the size of the building blocks is much larger and they scatter<br />
incident waves much stronger. One can therefore expect that in case of nanostructures diffraction<br />
can easier deviate from the weak scattering regime, which can be described within<br />
the Rayleigh-Gans theory based on the Born approximation.<br />
Diffraction on the two-dimensional periodic structures with a non-periodic ultimately large<br />
third dimension is of special interest. As an example of such system we take the anodic aluminum<br />
oxide (AAO) that has recently attracted attention in view of the discovery of the production<br />
AAO films with a self-ordered porous structure [1]. At present AAO films are most<br />
widely used as matrices for synthesizing the nanostructures of ordered arrays of various<br />
compositions [2, 3]. SANS and SAXS methods can provide extremely valuable information<br />
on pore structure (interpore distance, diameter and length) and their organization (positional<br />
correlation length, domain size) [4].<br />
Experiment<br />
1. Samples preparation. Anodic Aluminum Oxide (AAO) membrane was prepared by the<br />
two-step anodization technique [1]. This method allows producing porous films with well ordered<br />
hexagonal arrays of cylindrical channels. High purity aluminum foil was annealed at<br />
550 °C in air in order to remove the mechanical stress and enhance the grain size in the<br />
metal. The anodization was carried out in the two-electrode cell. After the first anodization for<br />
24 h the film of AAO was selectively etched away. The second anodization with the different<br />
oxidation time produces porous layer of the desired thickness. The present study is performed<br />
using 6 samples of AAO films of the same interpore distance of 105 nm, with the<br />
same pore radius of 20 nm but different thickness of 6, 12, 24, 50, 105, and 163 m.<br />
121
2. Small-angle neutron scattering. SANS measurements were carried out with the instrument<br />
SANS-2 at the <strong>Geesthacht</strong> Neutron Facility (GeNF). A neutron beam with a wavelength<br />
ranging from = 0.5 nm to = 1.2 nm and a wavelength spread of / = 20 % was used. A<br />
films with an area 0.5–2 cm 2 were oriented perpendicularly to the neutron beam and was<br />
uniformly irradiated over the entire area. Such an orientation of the sample corresponds to<br />
the pore arrangement, as well as the long axis of the magnetic nanowires, in parallel to the<br />
incident neutron beam. The Sample - Detector distances of 15 and 11 m for the neutron<br />
wavelength of 0.5, 0.6, 0.7, 0.8 nm and of 0.8, 0.9, 1.0, 1.1, 1.2 nm, respectively, were used<br />
with appropriate collimations to cover scattering vectors q from 0.025 to 0.2 nm -1 .<br />
Achievements and Main Results<br />
The chosen geometry of the experiment allows observation of a diffraction pattern in the<br />
small-angle scattering range. The obtained many-order reflection patterns suggest the presence<br />
of strong correlations in the pores positions over significant distances. The hexagonally<br />
arranged set of reflections demonstrates the 6-fold symmetry along the direction normal to<br />
the film surface with the distance of 105 nm between pores. Figure 1 shows the transmission<br />
through the membrane T = I tr /I 0 , where I 0 and I tr are the intensities of the incident and transmitted<br />
(non-scattered) beam, respectively. The transmission decays quickly with thickness<br />
showing that the samples of 10–20 m thick scatter off the beam a half of the incident intensity.<br />
This clearly indicates that our result cannot be described within usual Born approximation,<br />
which assumes weak interaction of the incident wave with the sample.<br />
1.0<br />
0.8<br />
= 0.6 nm<br />
= 0.9 nm<br />
= 1.2 nm<br />
Figure 1:<br />
Transmission T as a function of the<br />
AAO film thickness for = 0.6, 0.9 and 1.2 nm.<br />
tr<br />
/ 0<br />
0.6<br />
0.4<br />
0.2<br />
0.0<br />
0 25 50 75 100 125 150 175<br />
L (m)<br />
Thin AAO films (L = 6 and 12 m thick) the Born approximation is more-less applicable. In<br />
this case the power of the diffracted waves grows quadratically so that the transmission<br />
T = 1- 2 L 2 falls off quadratically, where -1 ~ 12–18 m for different neutron wavelengths<br />
(see Fig. 1). For thicker samples the Born approximation is no more valid and one can expect<br />
oscillations in the T(L) dependence predicted in [5]. We do not observe the oscillation,<br />
which can be related to the finite beam coherence in the longitudinal direction and can also<br />
indicate that the pores are not sufficiently straight over the distances larger than 10–20 m.<br />
Instead, the T(L) decay changes to a slow power-law dependence (~L -x with x ~ 1) at large L.<br />
This can be attributed to the incoherent multiple scattering regime [6, 7].<br />
The momentum-transfer dependence of the scattering intensity normalized to the incident<br />
intensity I(q)/I 0 with the wavevector q parallel to the (10) axis for two samples (L = 6 m and<br />
24 m) is shown in Fig. 2. As is seen the scattering intensity taken for three different wavelengths<br />
appeared to be independent on the wavelength for the thin sample (L = 6 m,<br />
122
Fig. 2a). On contrary, the amplitude of the scattering decreases strongly with increase of <br />
for the thick sample (L = 24 m, Fig. 2b). The dependence I(q) is satisfactorily reproduced by<br />
the sum of the Gaussians with the centres at q 10 = 0.069 ± 0.004 nm –1 , q 11 = 0.119 ± 0.004<br />
nm –1 , q 20 = 0.138 ± 0.004 nm –1 , which are well classified in the hexagonal lattice with the parameter<br />
a = 105 ± 2 nm. The width of the reflections is described by HWHM = 0.0100<br />
±0.0005 nm -1 attributed to the resolution limit of the setup. The whole set of the experimental<br />
data for different and different thickness L was fitted by the described above combinations<br />
of Gaussians with the only changing parameter: the amplitude of the scattering.<br />
The dependence of the peak (10) intensity is<br />
shown in Fig. 3 for all samples under study. As is<br />
well seen the amplitude is small and independent<br />
on for L = 6 m. Upon increase of the sample’s<br />
thickness L, the peak intensity decreases with<br />
increase of the wavelength. The -dependence of<br />
the intensity for the thick samples is close to the<br />
power law ~ -2 that is shown in Fig. 3 by the<br />
dashed line. This demonstrates the transition<br />
from the scattering within the Born approximation<br />
for the thin sample to the regime of the scattering<br />
beyond its applicability in accord to [9]. On the<br />
other hand, the expected sinus-square dependence<br />
on the argument L was not observed. It is<br />
attributed to the limited coherency of the AAO<br />
films in the direction along the pore estimated as<br />
15 m. Thus, one concludes that the example of<br />
scattering in AAO films has demonstrated the<br />
validity of the theoretical consideration [9] and<br />
importance of the coherency in the both used<br />
radiation and the investigated object.<br />
Finally, we would like to thank our local contacts<br />
(Helmut Eckerlebe and Melissa Sharp) for their<br />
excellent support.<br />
Intensity (10 4 1/sr)<br />
Intensity (10 4 1/sr)<br />
1.2<br />
1.0<br />
0.8<br />
0.6<br />
0.4<br />
0.2<br />
a<br />
= 0.6 nm<br />
= 0.9 nm<br />
= 1.2 nm<br />
0.0<br />
5 = 0.6 nm<br />
b<br />
= 0.9 nm<br />
4<br />
= 1.2 nm<br />
3<br />
2<br />
1<br />
0<br />
0.04 0.06 0.08 0.10 0.12 0.14<br />
q ( nm -1 )<br />
Figure 2:<br />
The q-dependence of the neutron scattering<br />
(a) for the sample with L = 6 m and<br />
(b) for the sample with L = 24 m for different<br />
neutron wavelengths.<br />
References<br />
[1] H. Pan, B. Liu, J. Yi et al., J. Phys. Chem. B 109, 3094 (2005).<br />
[2] K. Nielsch, F. Muller, A.P. Li, Advanced Materials 12, 582 (2000).<br />
[3] K.S. Napolskii, P.J. Barczuk, S.Y. Vasiliev, et al., Electrochimica Acta 52, 7910 (2007).<br />
[4] O. Jessensky, F. Muller, U. Gosele, J. Electrochem. Soc. 145, 3735 (1998).<br />
[5] S.V. Grigoriev, N.A. Grigorieva, A.V. Syromyatnikov, K.S. Napolskii, A.A. Eliseev, A.V. Lukashin,<br />
Yu.D. Tretyakov, H. Eckerlebe, JETP Letters, Vol. 85 (2007) pp. 549–554<br />
[6] S.V. Maleyev, Phys. Rev. B 52 ( 1995) 13163.<br />
[7] G.P. Kopitsa, S.V. Grigoriev, V.V. Runov, V.M. Garamus, D. Bellmann, JETP 101 (2005) 427.<br />
123
124
EXPERIMENTAL REPORT<br />
GeNF<br />
SANS-2<br />
Mn 0.95 Fe 0.05 Si in high pressure cell<br />
Proposer:<br />
Co-Proposers:<br />
Sergey Grigoriev 1 , 1 PNPI, Gatchina, St-Petersburg, Russia<br />
Vadim Dyadkin 2 , Ravil Sadykov 2 ,<br />
2 INR, Troitsk, Moscow Reg., Russia<br />
Experimental Team:<br />
User Group Leader:<br />
Intrument Scientist:<br />
Sergey Grigoriev 1 , Vadim Dyadkin 1 , Ravil Sadykov 2 ,<br />
Helmut Eckerlebe 3 , 3 GKSS Research Centre <strong>Geesthacht</strong>, Germany<br />
Sergey Grigoriev 1<br />
Helmut Eckerlebe 3<br />
Date of Experiment: December 2007<br />
Objectives<br />
The weak itinerant ferromagnet MnSi with the space group P2 1 3 and the lattice constant<br />
a = 0.4558 nm has ordered below T C = 29 K in a left-handed ferromagnetic spiral along the<br />
‹1 1 1› directions with a propagation vector k = (2π/a) (, , ) where = 0.017 [1, 2]. It is well<br />
known that the doping MnSi by Fe leads to the decrease of the average magnetic moment in<br />
these compounds [3] and T C of these compounds decreases as well. The system MnSi is<br />
known to suffer the quantum phase transition under the hydrostatic pressure P as the magnetic<br />
order disappears upon increase of P (T C → 0 at P → P C ≈ 15 kbar) [5, 6]. Thus, the<br />
general aim of the experiments was (i) to test the high pressure cell (HPC) and its interaction<br />
with neutron beam in the small angle scattering range; (ii) to test the ability of the closed circle<br />
refrigerator to reach the temperature as low as 7 K with the massive HPC inside the refrigerator;<br />
(iii) to follow the evolution of the spin helices of the Mn 0.95 Fe 0.05 Si compound under<br />
applied magnetic field located in the HPC at low pressure.<br />
Experiment<br />
1. Sample. The single crystal Mn 0.95 Fe 0.05 Si having some crystallographic grains was chosen<br />
for the study. The sample was grown by Czokhralski method in the form of disc with a thickness<br />
of 5 mm and a diameter of 7 mm. The critical temperature T c of the sample was 14 K.<br />
2. Small-angle neutron scattering. Small-angle neutron scattering (SANS) measurements<br />
are carried out with the instrument SANS-2 at the <strong>Geesthacht</strong> Neutron Facility (GeNF). Neutrons<br />
with a mean wavelength of = 0.58 nm and a wavelength spread of / = 10 % were<br />
used. The Sample-Detector distance of 3 meter was used with an appropriate collimations.<br />
The sample was situated in the HPC filled with FC-77 liquid to create a hydrostatic pressure<br />
of 1 kbar. The HPC together with the sample was cooled in the closed circle refrigerator in<br />
zero field from the room temperature to T = 7 K. The cooling took 3 hours. Then the magnetic<br />
field was applied and rose up from H = 0 to 120 mT.<br />
125
Figure 1: SANS map for the sample<br />
under study at T = 7 K.<br />
Achievements and Main Results<br />
Figure 1 shows a map of the SANS intensities for the<br />
sample Mn 0.95 Fe 0.05 Si at T = 7 K without the HPC. One<br />
can see few Bragg peaks, or, the ring of intensity, which<br />
correspond to the scattering from different spiral domains<br />
belonging to different grains in the sample. This picture of<br />
the scattering is typical for the sample MnSi doped by Fe.<br />
In case when the sample was placed into the HPC filled<br />
with FC-77 liquid and cooled down to T = 7K the ring of<br />
the scattering becomes invisible because of the large<br />
background scattering from the HPC. Figure 2 shows the<br />
corresponding map of scattering intensity from HPC located<br />
in the closed circle refrigerator with the sample inside<br />
at the magnetic field H = 0. The beam catcher was<br />
removed from its standard position and the neutron beam<br />
strongly scattered by the HPC can be seen in the center<br />
of the detector. No scattering from the spin helices were<br />
observed in zero field. The magnetic field H = 120 mT<br />
was applied that caused different domains to be oriented<br />
along the field. As a result sample transforms from multidomain<br />
to the single-domain state and the spot of intensity<br />
appears on the right side of the detector (Fig. 3).<br />
Figure 2: SANS map for the sample<br />
inside the HPC cooled to T = 7 K<br />
at H = 0 mT.<br />
Conclusion<br />
Although the test of the HPC and the close circle refrigerator<br />
was successful, the HPC gives extremely high background<br />
scattering. Therefore, the material of the wall of<br />
HPC should be replaced by the one with less scattering<br />
ability or the thickness of the walls of HPC should be reduced.<br />
Figure 3: SANS map for the sample<br />
inside the HPC cooled to T = 7 K<br />
at H = 120 mT.<br />
References<br />
[1] Y. Ishikawa, K Tajima, D. Bloch and M.Roth, Soild State Commmun. 19 (1976) 525.<br />
[2] Y. Ishikawa, G. Shirane, J.A. Tarvin, M. Kohgi, Phys. Rev. B 16 (1977) 4956.<br />
[3] N. Manyala, Y. Sidis, J.F. DiTusa, G. Aeppli, D.P. Young, Z. Fisk, Nature 404 (2000) 581–584.<br />
[4] S.V. Grigoriev, S.V. Maleyev, A.I. Okorokov, Yu. O. Chetverikov, P. Böni, R. Georgii, D. Lamago,<br />
H. Eckerlebe, and P.K. Pranzas, Phys. Rev. B 74 (2006) 214414.<br />
[5] C. Pfleiderer, S.R. Julian, and G. G. Lonzarich, Nature London 414 (2001) 427.<br />
[6] C. Pfleiderer et al., Nature London 427 (2004) 227.<br />
126
EXPERIMENTAL REPORT<br />
GeNF<br />
SANS-2<br />
Proposer:<br />
Co-Proposers:<br />
Experimental Team:<br />
K-flop transition in Fe 0.65 Co 0.35 Si<br />
Sergey Grigoriev 1 ,<br />
1 PNPI, Gatchina, St-Petersburg, Russia<br />
Vadim Dyadkin 1 , Dirk Menzel 2<br />
2 Technische Universitat Braunschweig, Germany<br />
Sergey Grigoriev 1 , Vadim Dyadkin 1 , Helmut Eckerlebe 3 ,<br />
3 GKSS Research Centre <strong>Geesthacht</strong>, Germany<br />
User Group Leader:<br />
Instrument Scientist:<br />
Sergey Grigoriev 1<br />
Helmut Eckerlebe 3<br />
Date of Experiment: October 2008<br />
Objectives<br />
The cubic B20-type of mixed crystal Fe 1-x Co x Si orders below T C in the one-handed helical<br />
spin structure with a small propagation vector k [1–4]. In analogy to the magnetic structure of<br />
MnSi [5, 6] and FeGe [7], the helicity is widely recognized to be induced by the antisymmetric<br />
Dzyaloshinskii-Moriya (DM) exchange interaction caused by the lack of a symmetry centre in<br />
the arrangement of magnetic atoms Fe and Co [9–11]. The system was also shown to remain<br />
unstable with respect to a weak perpendicular to k magnetic field if a small gap in the<br />
spin wave spectrum is not taken into account [11]. Thus, this gap caused by the DM interaction<br />
is essential if such systems are considered in an applied magnetic field at the quantum<br />
level. An indirect experimental confirmation of the existence of the spin wave gap can be the<br />
k-flop transition (so-called A-phase). Detailed description of the relationship between k-flop<br />
phase and spin wave gap is given in Ref. [12].<br />
Briefly, all cubic helical magnets with noncentrosymmetric space group P2 1 3 (Fe 1-x Co x Si,<br />
Mn 1-y Fe y Si) in an applied magnetic field H have a 90 0 rotation of the helix wave vector k from<br />
the direction parallel to the field axis to the direction perpendicular to it in a small pocket of<br />
the H-T phase diagram near T C in the narrow range of the fields near Hin<br />
2 / gB<br />
,<br />
where g is the Landè factor, μ B is the Bohr magneton, Δ is the gap value.<br />
The aim of the present experiment was to study a space distribution of the helix wave vector<br />
inside the k-flop pocket in the H-T phase diagram and the polarization of residual Bragg<br />
peaks at q || H in the sample Fe 0.65 Co 0.35 Si.<br />
Experiment<br />
1. Sample. The single crystal Fe 0.65 Co 0.35 Si with the critical temperature T C = 51 K and<br />
k = 0.20 nm -1 was chosen for the study. The choice was dictated by the fact that the spin<br />
chirality of the crystal was determined to be 80 % left-handed and 20 % right-handed that is<br />
very unusual for this sort of samples. Normally, the samples are 100 % single handed. The<br />
sample grown by the Chokhralskii method was a disc with a thickness of 1 mm and a diameter<br />
of 8 mm.<br />
2. Small-angle neutron scattering. Small-angle neutron scattering (SANS) measurements<br />
are carried out with the instrument SANS-2 at the <strong>Geesthacht</strong> Neutron Facility (GeNF). Polarized<br />
neutron beam with the polarization P 0 = 0.93, with a mean wavelength of = 0.58 nm<br />
and a wavelength spread of / = 10 % were used. The Sample - Detector distance of 7 m<br />
were used with an appropriate collimation of the incident beam. The magnetic field was ap-<br />
127
plied horizontally: either perpendicular to the incident neutron beam (Fig. 1, C1), or parallel to<br />
it (Fig. 1, C2).<br />
C1<br />
[100] ||q 1 || H<br />
q 2 H<br />
q 2<br />
Position sensitive<br />
detector<br />
C2<br />
ω<br />
q 1<br />
ω<br />
single<br />
crystal<br />
[100]<br />
H<br />
H<br />
Incident beam, k 0<br />
Incident beam, k 0<br />
Figure 1: Experimental configurations with the field applied perpendicular (C1) and parallel (C2) to<br />
incident neutron beam.<br />
Achievements and Main Results<br />
The picture of the magnetic transformations well below T C is typical for all the cubic helical<br />
magnets with space group P2 1 3. The small angle diffraction measurements show that in absence<br />
of the magnetic field the magnetic structure consists of spiral domains with different<br />
orientation of the spiral wave vector k. An external magnetic field provides the process of<br />
reorientation of spiral domain along the field axis. This process starts from the threshold field<br />
H C1 defined as a field which dominates over the local anisotropy and forms in the sample the<br />
single domain state with conical spirals oriented along the field. In the scattering picture, it is<br />
seen as an accumulation of the different Bragg spots to the single one with k collinear to the<br />
magnetic field axis. Further increase of the magnetic field destroys the spiral order and forms<br />
the ferromagnetic state at H = H C2 , where the Bragg spot vanishes. The system remains a<br />
stable conical structure in the range H C1 < H < H C2 .<br />
a<br />
b<br />
c<br />
H<br />
H<br />
Figure 2: SANS maps of the k-flop transition at the C1 configuration with the polarization along (a) and<br />
opposite (b) the magnetic field axis, and at the C2 configuration (c). H = 20 mT, T = 50 K<br />
128
The k-flop is seen in the diffraction experiment slightly below T C as a 90 0 jump of the wave<br />
vector from k || H to k H in a narrow range of the fields. Within the k-flop phase, the intensity<br />
of the Bragg reflection at q = k || H decreases, while a new Bragg spot appears at k H.<br />
As shown in Fig. 2(a, b) the additional Bragg spots with k perpendicular to the magnetic field<br />
H are well seen. The remaining two Bragg spots with k || H are significantly weakened.<br />
Fig. 3(a) shows the field dependence of the intensity for the Bragg spot on the right side of<br />
the detector for two state of the polarization (along I + and opposite I - to the magnetic field).<br />
The decreasing values of two spots at k || H are compensated by the increasing values of the<br />
two spots at k H. In fact these two spots are the cross sections of the ring of intensity in the<br />
Fourier space. This can be visualized in the experimental configuration C2 (Fig. 1). The<br />
SANS map for Fe 0.65 Co 0.35 Si at configuration C2 is shown in Fig. 2(c). One can see that the<br />
intensity is uniformly distributed along the ring with the radius of |k| = 0.20 nm -1 . Thus in k-flop<br />
phase the distribution of the k vector is randomly spread in the plane perpendicular to the field<br />
axis as it can be expected. The field range where the k-flop in Fe 0.65 Co 0.35 Si observed is 15–<br />
25 mT. According to [12] this corresponds to the value of the spin wave gap 2 eV.<br />
Intensity ( arb.units)<br />
10 4<br />
10 3<br />
q = k<br />
I +<br />
I -<br />
a<br />
P S<br />
1.0<br />
0.5<br />
0.0<br />
-0.5<br />
q = k<br />
q = -k<br />
b<br />
10 2<br />
0 10 20 30 40<br />
-1.0<br />
0 10 20 30 40<br />
H ( mT)<br />
H ( mT)<br />
Figure 3: The magnetic field dependencies of the Bragg peak (a) intensity and (b) polarization<br />
at q || H at T = 50 K.<br />
<br />
I<br />
I<br />
We also measured the polarization of the residual Bragg peaks at q = k || H as P S<br />
= ,<br />
<br />
I + I<br />
where I + and I - are the scattering intensities for the incident neutron beam with the polarization<br />
along (up) and opposite (down) to the guiding magnetic field at the fixed position in the<br />
momentum space q = k and q = - k. As the polarized neutron diffraction is known as an ideal<br />
tool for measuring the spin chirality [13], then we can determine how this measure of the<br />
chirality changes in k-flop area for the sample Fe 0.65 Co 0.35 Si (Fig. 3 (b)). One can see that the<br />
polarization (and consequently, the magnetic chirality of the system) changes its sign exactly<br />
in k-flop field range. This feature is seen only at 50 K that is very close to T C = 51 K, and it is<br />
not visible at T = 49 K. The flip of the chirality in the k-flop phase is related to the fact that the<br />
k-flop for the left-handed helices, those dominate in the sample, is energetically more favourable<br />
than for the right-handed helices. In other words, the ground state energy for the<br />
left-handed helices is slightly higher than that for the right-handed helices in the Fe 0.65 Co 0.35 Si<br />
compound.<br />
Finally, we would like to thank our local contacts (Helmut Eckerlebe and Melissa Sharp) for<br />
their excellent support.<br />
129
References<br />
[1] J. Beille, J. Voiron, M. Roth, Solid State Commmun. 47 (1983) 399.<br />
[2] J. Beille, J. Voiron, F. Towfiq, M. Roth, Z.Y. Zhang, J.Phys.F: Met.Phys. 11 (1981) 2153.<br />
[3] K. Ishimoto, H. Yamaguchi, Y. Yamaguchi, J. Suzuki, M. Arai, M. Furusaka, Y. Endoh,<br />
J.Magn.Magn.Mat. 90&91 (1990) 163.<br />
[4] K. Ishimoto, Y. Yamaguchi, J. Suzuki, M. Arai, M. Furusaka, Y. Endoh, Physica B 213&214<br />
(1995) 381.<br />
[5] Y. Ishikawa, K. Tajima, D. Bloch and M. Roth, Solid State Commmun. 19 (1976) 525.<br />
[6] Y. Ishikawa, G. Shirane, J.A. Tarvin, M. Kohgi, Phys. Rev. B 16 (1977) 4956.<br />
[7] B. Lebech, J. Bernhard, T. Freltoft, J. Phys. Condens. Matter 1, 6105 (1989).<br />
[8] I.E. Dzyaloshinskii, Zh. Eksp. Teor. Fiz. 46 (1964) 1420.<br />
[9] P.Bak, M.H.Jensen, J.Phys. C13, L881 (1980).<br />
[10] D. Nakamishi, A. Janase, A. Hasejawa, M. Kitaoka, Solid State Commun. 35 (1980) 995.<br />
[11] S.V. Maleyev, Phys. Rev. B 76 (2006) .<br />
[12] S.V. Grigoriev, S.V. Maleyev, A.I. Okorokov, Yu. O. Chetverikov, and H. Eckerlebe, Phys. Rev. B<br />
73 (2006) 224440.<br />
[13] S.V. Maleyev, Phys. Rev. Lett. 75 (1995) 4682.<br />
130
EXPERIMENTAL REPORT<br />
GeNF<br />
SANS-2<br />
The study of the three-spin correlations in the single crystal Ni by small angle<br />
scattering of polarized neutrons<br />
Proposer:<br />
Co-Proposers:<br />
Experimental Team:<br />
User Group Leader:<br />
Instrument Scientist:<br />
Sergey V. Grigoriev 1 ,<br />
1 PNPI, Gatchina, St-Petersburg, Russia<br />
Vasily V. Piyadov 1<br />
Date of Experiment: June 2008<br />
Objectives<br />
Sergey V. Grigoriev 1 , Vasily V. Piyadov 1 ,<br />
Helmut Eckerlebe 3 , 3 GKSS Research Centre <strong>Geesthacht</strong>, Germany<br />
Sergey V. Grigoriev 1<br />
Helmut Eckerlebe 3<br />
The experiment aimed to investigate the spin dynamics and three-particle correlation in the<br />
single crystal of Ni in a magnetic field in the temperature range near the magnetic phase<br />
transition by means of polarized Small Angle Polarized Neutron Scattering (SANS). It is well<br />
known that the presence of the high-order correlations is generally strongly enhanced in the<br />
critical region near T C . The even order correlations, involving four spins etc., change the critical<br />
exponent of the pair correlation function from the mean-field approximation = 1/2 to that<br />
of the critical scaling = 2/3. The odd-order correlation functions do not contribute to the<br />
static part of the magnetic susceptibility because this would contradict to the energy conservation<br />
law with respect to the time inversion. Nevertheless the odd correlation functions may<br />
contribute to the dynamic part of the susceptibility. The lowest of them, triple vertex and the<br />
triple spin fluctuation associated with it, were introduced by Maleyev [1] and then were studied<br />
in details in [2]. As was shown in [1] and experimentally confirmed in [3] the triple vertex<br />
([ S x S y ] S z ) is a new entity, which is lacking in the static theory of the phase transitions.<br />
The triple vertex and the three spin correlation (TSC) function are the objects of a chiral nature,<br />
which may be successfully studied by polarized neutrons. The TSC were detected for<br />
the first time by Okorokov [3, 4] in the scattering of the polarized neutrons in iron. Recently<br />
we studied the triple vertex and the TSC function along with the pair correlation function in<br />
the localized ferromagnet EuS near Tc. EuS is of interest for its large magnetic moment and<br />
for the effect, which the dipole forces may have on the critical behavior of the system. The Ni<br />
single crystal was chosen as an object for the study for its relatively low magnetic moment<br />
(µ Ni = 0.604 µ B ). The triple correlation function and the triple vertex are purely quantum objects<br />
and, therefore, we expect that the effects connected to the quantum properties of the<br />
system will be better exhibited for the systems with small moments.<br />
Sample and Experiment<br />
The object for the study was a sample of the Ni single crystal, which is an example of the<br />
ferromagnet with an unfinished 3d shell (3d8-4s2), small spin and a magnetic moment being<br />
equal to 0.6 µ B . The sample used in the experiments was cylinder-shaped with a diameter of<br />
10 mm and a height of 5 mm. The Curie temperature of the sample was Т С = 631 К. The<br />
polarized SANS experiments were carried out at the SANS-2 setup at the <strong>Geesthacht</strong><br />
Neutron Facility (GeNF). A polarized beam of neutrons with an initial polarization of<br />
P 0 = 0.95, the neutron wavelength λ = 5.8 Å (Δλ/λ = 0.1) and a divergence of 4 mrad was<br />
used. The scattered neutrons were detected by a 256256 position sensitive detector. The<br />
131
detector-to-sample distance of 4000 mm was used with an appropriate collimation to cover<br />
an angular range up to 100 mrad. The scattering intensity was measured in the temperature<br />
range from T = 625 K to T = 650 K. The external magnetic field H from 1 to 325 mT was<br />
applied at the angle = 45 o , with respect to the incident beam k, providing, so-called,<br />
"inclined" geometry. This geometry allows one to observe the left-right asymmetry in SAPNS<br />
pattern that originate from the interaction of the neutron spin with the chiral dynamical<br />
excitations. According to Ref. [2] in a magnetized sample the magnetic cross section has the<br />
form:<br />
(q, ) = 0 (q,) +(q, P 0 )(q, H) ch (q,)/q 2 ,<br />
where the second term is determined by chiral dynamical spin fluctuations and P 0 and H are<br />
the neutron polarization and the magnetic field, respectively. In the case of small-angle<br />
scattering integrated chiral contribution to the cross section changes sign with and may<br />
be easily extracted from the total scattering intensity. These two contributions to the critical<br />
magnetic scattering were studied in the temperature range around T С = 631 K. First, the<br />
intensity of the magnetic scattering, I m (q) = I(q,T) – I(q,T>>T C ), is attributed to the pair spin<br />
correlation function. Another contribution caused by the three-spin chiral fluctuations. It is<br />
separated from other contributions as the asymmetric part of the polarization dependent<br />
scattering [1–4]: I() = [I + ()+I - (-)-I + (-)-I - ()] where I + () and I - () are integrated<br />
intensities with the polarization directed along and opposite to the field.<br />
Achievements and Main Results<br />
The inset in Fig. 1 shows the temperature dependence of the intensity integrated over the<br />
whole detector. The total magnetic intensity shows its maximum at T C = 631 K and decreases<br />
for Т < Т С and for Т С < Т. As shown in Fig. 1 at Т С < Т, upon decrease of the temperature,<br />
the scattering intensity increases strongly for a small momentum transfer (q=0.15 nm -1 ) and it<br />
has a weak increase for a relatively large momentum transfer values (q=0.4 nm -1 ). This scattering<br />
behavior is attributed to enhancement of critical fluctuations and to increase of their<br />
correlation length as T approaches Т С . The q-dependence of SANS intensity is described by<br />
the Ornstein-Zernike expression: I(q) = A/(q 2 + 2 ), where A and are the scattering amplitude<br />
and the inverse correlation length, respectively.<br />
I (arb. units)<br />
8<br />
6<br />
4<br />
2<br />
0<br />
Itot<br />
13<br />
12<br />
11<br />
10<br />
9<br />
8<br />
7<br />
6<br />
5<br />
630 635 640 645 650<br />
T (K)<br />
Figure 1:<br />
Temperature dependence of magnetic<br />
scattering intensity in a weak guiding field<br />
H = 1 mT at different q-values. The inset<br />
shows the temperature dependence of<br />
the intensity integrated over the whole<br />
detector.<br />
630 635 640 645 650<br />
T (K)<br />
q=0.41 nm -1<br />
q=0.30 nm -1<br />
q=0.20 nm -1<br />
q=0.15 nm -1<br />
Figures 2–4 show typical examples of the asymmetric scattering I A (q) at the magnetic field of<br />
H = 50 and 270 mT and at temperatures T = 326 K ( below T С ), T = T С = 631 K, and T = 334 K<br />
( above T С ), respectively. At T < T C the asymmetric scattering is attributed to the spin waves.<br />
132
The “shoulders” visible in Fig. 2 are very typical for the spin-wave scattering. The characteristic<br />
q-value, corresponding to these shoulders, is related to the spin-wave stiffness D through<br />
the following expression: q/k = h 2 /(2 D m n ), where k is the neutron wavevector and m n is the<br />
neutron mass. As is seen in Fig. 2, both the characteristic q-value and the intensity of the<br />
scattering decrease with increase of the magnetic field. This is also a fingerprint of the scattering<br />
on the spinwaves [6]. The asymmetric part of the scattering I A (q) was averaged at<br />
different values of the q-values: q = 0.15, 0.20, 0.30 and 0.40 nm -1 . These averaged values<br />
are shown as a function of the magnetic field at T = 626 К in the inset in Fig. 2.<br />
Figure 2:<br />
q-dependence of the asymmetric part of the scattering<br />
ΔI at T = 626 K. The inset: magnetic field dependence<br />
of the intensity ΔI for different q values.<br />
I (arb.units)<br />
4<br />
3<br />
2<br />
1<br />
0<br />
-1<br />
-2<br />
-3<br />
2.4 I (arb. units)<br />
2.0<br />
1.6<br />
1.2<br />
0.8<br />
0.4<br />
0.0<br />
H (mT)<br />
-4<br />
-0.6<br />
50 100<br />
-0.4<br />
200<br />
-0.2<br />
300<br />
0.0 0.2 0.4 0.6<br />
0 150 250<br />
q (nm -1 )<br />
T=626 K<br />
H=50 mT<br />
H=270 mT<br />
At T = T C and above the asymmetric scattering is attributed to the three-spin correlations<br />
(Fig. 3 and Fig. 4). No shoulders-like features are observed above T C . The asymmetric intensity<br />
I A (q) depends on the momentum transfer as 1/q 2 . It is worthwhile to note that the<br />
asymmetric part exceeds of 20–25 % of the symmetric one in the whole q range. The averaged<br />
values are shown as a function of the magnetic field at T C = 631 К in the inset in<br />
Fig. 3. As seen from the inset (Fig. 3), the intensity increases linearly in the range of<br />
small fields from 0 to 50 mT and then it saturates in the field range [50–270] mT. At T = 634 K<br />
the asymmetric scattering is smaller than at T C but still it posses the same features (Fig. 4).<br />
The magnetic field dependence of , given in the inset (Fig. 4), shows that the weak<br />
magnetic fields range exceeds the value of 150 mT for the temperature T = 634 K, i.e. 3 degrees<br />
above T C .<br />
I (arb. units)<br />
2.0<br />
1.5<br />
1.0<br />
0.5<br />
0.0<br />
-0.5<br />
-1.0<br />
-1.5<br />
1.4<br />
1.2<br />
1.0<br />
0.8<br />
0.6<br />
0.4<br />
0.2<br />
0.0<br />
I (arb. units)<br />
H (mT)<br />
0 50 100 150 200 250 300<br />
-2.0<br />
-0.6 -0.4 -0.2 0.0 0.2 0.4 0.6<br />
q (nm -1 )<br />
T=631 K<br />
H=50 mT<br />
H=270 mT<br />
Figure 3: q-dependence of the asymmetric part<br />
of the scattering ΔI at T = 631 K.<br />
The inset shows the magnetic field dependence<br />
of the intensity ΔI for different q values.<br />
I (arb. units)<br />
1.2<br />
0.9<br />
0.6<br />
0.3<br />
0.0<br />
-0.3<br />
-0.6<br />
-0.9<br />
1.0<br />
0.8<br />
0.6<br />
0.4<br />
0.2<br />
0.0<br />
I (arb. units)<br />
H (mT)<br />
0 50 100 150 200 250 300<br />
T=634 K<br />
H=50 mT<br />
H=270 mT<br />
-1.2<br />
-0.6 -0.4 -0.2 0.0 0.2 0.4 0.6<br />
q (nm -1 )<br />
Figure 4: q-dependence of the asymmetric part<br />
of the scattering ΔI at T = 634 K.<br />
The inset shows the magnetic field dependence<br />
of the intensity ΔI for different q values.<br />
133
In general, the remarkable features of this asymmetric scattering are following. (i) It appears<br />
only when the inclination angle between the magnetic field H and the incident beam direction<br />
k is not equal to 0 or /2. Its appearance in this inclined geometry implies the dynamical<br />
nature of the scattering. (ii) The function changes its sign for the positive and negative value<br />
of q. (iii) The scattering depends on the scattering angle as q -2 . (iv) It increases with the applied<br />
magnetic field H. (v) It vanishes for the non-polarized neutrons (P 0 = 0). All these features<br />
allow one inevitably identify this scattering as that arisen from the triple vertex.<br />
Finally, we would like to thank our local contacts (Helmut Eckerlebe and Melissa Sharp) for<br />
their excellent support.<br />
References<br />
[1] S.V. Maleyev, Sov.Phys. JETP 42 (1976) 713.<br />
[2] A.V. Lazuta, S.V. Maleyev, B.P. Toperverg, Sov.Phys. JETP 48 (1978) 386.<br />
[3] A.I. Okorokov, A.G. Gukasov, Ya.M. Otchik, V.V. Runov, Phys. Lett. A 65 (1978) 60.<br />
[4] A.I. Okorokov, A.G. Gukasov, V.V. Runov, M. Roth, Sol.St.Comm. 38 (1981) 583<br />
[5] S.V. Grigoriev, S.V. Metelev, S.V. Maleyev, A.I. Okorokov, P. Böni, R. Georgii, D. Lamago,<br />
H. Eckerlebe, and K. Pranzas, Phys. Rev. B 72, 214423 (2005)<br />
[6] S.V. Maleyev, Zh.Eksp.Teor.Fiz. 48 (1965) 1448.<br />
134
EXPERIMENTAL REPORT<br />
GeNF<br />
SANS-2<br />
Polarized SANS study of highly-ordered massives of the magnetic<br />
Ni nanowires embedded into Al 2 O 3 matrix.<br />
Proposer:<br />
Co-Proposers:<br />
Experimental Team:<br />
User Group Leader:<br />
Instrument scientist:<br />
Sergey V. Grigoriev 1 , 1 PNPI, Gatchina, St-Petersburg, Russia<br />
Natalia Grigoryeva 2 , 2 SPSU, St-Petersburg, 198504, Russia<br />
Kirill Napolskii 3 , 3 MSU, Moscow, Russia<br />
Andrey Chumakov 1<br />
Sergey V. Grigoriev 1 , Natalia Grigoryeva 2 , Andrey<br />
Chumakov 1 , Helmut Eckerlebe 4 , 4 GKSS Research Centre<br />
<strong>Geesthacht</strong>, Germany<br />
Sergey V. Grigoriev<br />
Helmut Eckerlebe 4<br />
Date(s) of Experiment: 25 th October – 3 rd November 2008<br />
Objectives<br />
We continue the investigations of the magnetic properties of two-dimensional spatially ordered<br />
system of ferromagnetic nickel nanowires embedded into Al 2 O 3 matrix under applied<br />
magnetic field. As was shown in our previous experiments [1], the small-angle scattering<br />
pattern exhibits many diffraction peaks (up to the third-fourth reflection orders), which corresponds<br />
to the scattering from highly correlated hexagonal structure of pores and magnetic<br />
nanowires. Different contributions to the scattering, that have been analyzed, are the nonmagnetic<br />
(nuclear) contribution, the magnetic contribution depending on the magnetic field,<br />
and the nuclear-magnetic interference indicating the correlation between the magnetic and<br />
nuclear structures. The magnetic field applied along the (10) crystallographic axis of the<br />
nanowire’s structure had shown unusual azimuth dependent magnetic and interference scattering.<br />
It appears that the regular structure of the magnetic fields noncollinear to the external<br />
field enhances even in the completely saturated sample. We concluded that this noncollinear<br />
component must come from the demagnetized field of the individual nanowire upon magnetization<br />
process [2]. The present experiment was aimed to study the magnetic scattering with<br />
the magnetic field applied along (11) crystallographic axis of the nanowire structure and to<br />
compare results with the experiment described in [2].<br />
Experiment<br />
1. Samples preparation. Anodic Aluminum Oxide (AAO) membrane was prepared by the<br />
two-step anodization technique [1]. The resulting films with a thickness of 60 μm and the<br />
pore radius of 20 nm are used as templates to synthesize wire nanoparticles. For the controlled<br />
growth of Ni nanoparticles in the porous Al 2 O 3 matrix, electrostatic precipitation is performed<br />
in a three-electrode cell in a controlled potential regime. The duration of the Ni<br />
electrostatic precipitation is equal to 48 h, which corresponds, according to scanning electron<br />
microscopy, to the formation of wire nanoparticles with a length of 60 μm and a diameter of<br />
40 nm.<br />
2. Small-angle neutron scattering. SANS measurements were carried out with the instrument<br />
SANS-2 at the <strong>Geesthacht</strong> Neutron Facility (GeNF). Polarized neutron beam with the<br />
polarization P 0 = 0.95, with a wavelength = 0.5 nm and a wavelength spread of / = 10 %<br />
was used. A film with an area of ~0.5 cm 2 was oriented perpendicularly to the neutron beam<br />
135
and was uniformly irradiated over the entire area. Such an orientation of the sample corresponds<br />
to the pore arrangement, as well as the long axis of the magnetic nanowires, in parallel<br />
to the incident neutron beam. The chosen geometry of the experiment allows the<br />
observation of the diffraction reflection system from the ordered structure in the small-angle<br />
scattering range. The Sample - Detector distance of 15 m was used with appropriate collimations<br />
to cover scattering vectors q from 0.025 to 0.2 nm -1 . An external magnetic field (up<br />
to 800 mT) was applied in the horizontal plane and perpendicular to the incident beam (perpendicular<br />
to the long axis of the nanowires and along the [11] axis of the structure). We determine<br />
the total (nuclear and magnetic) scattering (I(q) =I + (q) + I - (q)) and the polarization<br />
dependent part of the scattering (ΔI(q) = I + (q) - I - (q)) where I + (q) and I - (q) are the intensities<br />
for neutrons polarized parallel (+P 0 ) and anti-parallel (-P 0 ) to the magnetic field. The fielddependent<br />
scattering intensity is extracted as I H (q) = I(q,H) - I(q,0).<br />
Achievements and Main Results<br />
A diffraction patterns measured from AAO membrane with the embedded Ni nanowires for<br />
the neutrons with (+P 0 ) and (-P 0 ) are shown in Fig. 1a. and b, respectively. The hexagonal<br />
sets of reflections demonstrate the 6-fold symmetry along the direction normal to the film<br />
surface.<br />
(1-1)<br />
(01)<br />
a)<br />
b)<br />
(01)<br />
(1-1)<br />
(10)<br />
H<br />
H<br />
P 0<br />
(10)<br />
P 0<br />
Figure 1: The 2D diffraction pattern from Al 2 O 3 membrane with Ni nanowires at external magnetic field<br />
H = 800 mT and with +P 0 (a), and -P 0 (b).<br />
The momentum-transfer dependence of the radially-averaged total neutron scattering intensity<br />
I(q) is shown in Fig. 2a. The dependence I(q) is satisfactorily reproduced by the sum of<br />
the Gaussians with the centres at q 10 = 0.069± 0.004 nm –1 , q 11 = 0.119 ± 0.004 nm –1 , q 20 =<br />
0.138 ± 0.004 nm –1 , and a half-width w = 0.0100 ± 0.0005 nm –1 ; and the diffuse small-angle<br />
scattering, which is represented by the Gaussian centred at q = 0. The observed diffraction<br />
maxima are classified in the hexagonal lattice with the parameter a = 106 ± 2 nm.<br />
The magnetic-field dependent component the radially-averaged neutron scattering intensity<br />
I H (q) is shown in Fig. 2b. This component is the difference between the magnetic cross sections<br />
of the sample in two significantly different states: a state close to the saturation magnetization<br />
(in the field H = 800 mT) and a completely demagnetized state, i.e. without<br />
magnetic prehistory at H = 0. The main component of the magnetic cross-section at H = 800 mT<br />
is the ensemble of the magnetic reflections described by the sum of the Gaussians, whose<br />
positions correspond to maxima of the nuclear scattering pattern. On contrary, the main<br />
component of the cross section in zero magnetic field is scattering on domains; i.e. diffuse<br />
scattering which is described by the Gaussian at q = 0, in a complete absence of any contributions<br />
to the diffraction peaks. The approximation of the experimental data in the framework<br />
of this model is shown in Fig. 2b. The dependence I H (q) is satisfactorily reproduced by the<br />
same sum of the Gaussians as in case of the total intensity.<br />
136
Total Intensity ( arb. units)<br />
150<br />
125<br />
100<br />
75<br />
50<br />
25<br />
Experimental points<br />
Fitt of Sum of Gausses<br />
a)<br />
0<br />
0.00 0.05 0.10 0.15 0.20<br />
q (nm -1 )<br />
Figure 2:<br />
Momentum-transfer dependence of the total<br />
neutron scattering intensity I(q) (a), the magnetic<br />
intensity I H (q) – (b) and the interference<br />
intensity I(q) – (c).<br />
I H<br />
(arb.units)<br />
Interference (arb.units)<br />
3<br />
2<br />
1<br />
0<br />
-1<br />
-2<br />
-3<br />
0.00 0.05 0.10 0.15 0.20<br />
3<br />
2<br />
1<br />
0<br />
-1<br />
-2<br />
Experimental points<br />
Fitt of Sum of Gausses<br />
q (nm -1 )<br />
-3<br />
0.00 0.05 0.10 0.15 0.20<br />
q (nm -1 )<br />
Experimental points<br />
b)<br />
Fitt of Sum of Gausses<br />
c)<br />
However, the azimuthal dependence of the magnetic scattering intensity is not trivial. Figure<br />
3 shows the intensity of the magnetic scattering normalized by the total scattering intensity<br />
denoted as R() = I H ()/I() at |q| = q (10) , where is the azimuthal angle between the field<br />
direction H and the scattering vector q. As is well seen from Fig. 3, the magnetic scattering I H<br />
is maximal for = 30, 150, 210 and 330 degrees and it is minimal at = 90 and 270 degrees.<br />
Thus, the magnetic scattering is preferable at q || H and is suppressed at q H.<br />
Figure 3:<br />
Azimuthal dependence of the normalized magnetic<br />
scattering intensity R() = I H ()/I() at |q| = q (10) .<br />
R = IH /I<br />
0.06<br />
0.04<br />
0.02<br />
0.00<br />
The interference scattering contribution the radially-averaged neutron scattering intensity<br />
I(q) is shown in Fig. 2c. In a high magnetic field, the polarization-dependent scattering consists<br />
of two contributions: interference maxima at q values coinciding with the positions of<br />
reflections and interference in diffuse small-angle scattering. These two contributions have<br />
opposite signs in good agreement with [1]. The interference scattering intensity curve are<br />
approximated by the sum of the Gaussians with the centers at zero (diffuse scattering) and at<br />
q = q ht (coherent scattering). The q-dependence of the interference contribution I(q) is<br />
shown in Fig. 4a for different directions of the scattering vector = 0, 30, 60, 90 degrees at<br />
H = 800 mT. As is well seen the interference scattering at q = q (10) is maximal at q || H i.e. at<br />
137<br />
0 60 120 180 240 300 360<br />
deg)
= 0 degrees. With increase of it decreases and changes its sign at ~ 60 degrees while<br />
it is negative at q H, i.e. at = 90 degrees. The situation is different at q ~ q (11) . No second<br />
order reflections are observed in the interference at = 0 and 30 degrees, i.e. for q || H.<br />
They become significant for = 60 (reflection (11)) and for 90 degrees (reflection (20)). To<br />
further illustrate a complex behavior of the interference patterns we plot the azimuthal dependence<br />
of the interference scattering intensity normalized by the total scattering intensity<br />
denoted as P() = I ()/I() at |q| = q (10) (Fig. 4b). As is well seen from, the interference<br />
scattering I is maximal for = 0 and 180 degrees and it is minimal and negative at = 90<br />
and 270 degrees.<br />
arb.units)<br />
12<br />
8<br />
4<br />
0<br />
-4<br />
-8<br />
-12<br />
= 360 deg<br />
= 330 deg<br />
=300 deg<br />
= 270 deg<br />
0.05 0.10 0.15 0.20<br />
q( nm -1 )<br />
a)<br />
P = I / I<br />
0.10<br />
0.05<br />
0.00<br />
-0.05<br />
-0.10<br />
0 60 120 180 240 300 360<br />
(deg)<br />
b)<br />
Figure 4: Azimuthal dependence of the normalized interference scattering intensity P() = I()/I()<br />
at |q| = q (10) and neutron wavelength = 0.5 nm (a).<br />
The -dependence of the magnetic and interference scattering can be understood if one<br />
takes into account the system of demagnetizing fields enhancing around the nanowires<br />
(Fig. 5). The magnetic moment of an individual nanowire is aligned along the field but the<br />
demagnetizing fields have the perpendicular to the field components. These demagnetized<br />
fields are regularly placed in space and build a periodic structure with the same period as the<br />
nanowire’s system.<br />
Figure 5:<br />
The real space picture of the hexagonally ordered massive of<br />
the nanowires with demagnetizing fields under the external<br />
magnetic field the magnetic distribution of the field.<br />
H = 800 mT<br />
Finally, we would like to thank our local contacts (Helmut<br />
Eckerlebe and Melissa Sharp) for their excellent support.<br />
References<br />
[1] S.V. Grigoriev, N.A. Grigorieva, A.V. Syromyatnikov, K.S. Napolskii, A.A. Eliseev, A.V. Lukashin,<br />
Yu.D. Tretyakov, H. Eckerlebe, JETP Letters, Vol. 85 (2007) pp. 605–610. (Translated from<br />
Pis’ma v Zhurnal Éksperimental’noi i Teoreticheskoi Fiziki, Vol. 85, 2007, pp. 738–743 – Spatially<br />
ordered arrays of magnetic nanowires: polarized neutron scattering investigation.)<br />
[2] S.V. Grigoriev, A.P. Chumakov, N.A. Grigorieva, K.S. Napolskii, H. Eckerlebe, GKSS Report<br />
2008/6, pp. 121–124. – Polarized SANS study of highly-ordered massives of the magnetic Ni<br />
nanowires embedded into Al 2 O 3 matrix.<br />
138
EXPERIMENTAL REPORT<br />
GeNF<br />
SANS-2<br />
Polarized SANS study of massives of the Ni nanowires in Al 2 O 3 matrix<br />
in the field parallel to long wire axis<br />
Proposer:<br />
Co-Proposers:<br />
Experimental Team:<br />
Sergey V. Grigoriev 1 , 1 PNPI, Gatchina, Russia<br />
Natalia Grigoryeva 2 , 2 SPSU, St-Petersburg, Russia<br />
Kirill Napolskii 3 , 3 MSU, Moscow, Russia<br />
Andrey Chumakov 1 , 1 PNPI, Gatchina, Russia<br />
Sergey V. Grigoriev 1 , Natalia Grigoryeva 2 ,<br />
Andrey Chumakov 1 , Helmut Eckerlebe 4 ,<br />
4 GKSS Research Centre <strong>Geesthacht</strong>, Germany<br />
User Group Leader:<br />
Instrument Responsible:<br />
Sergey V. Grigoriev 1<br />
Helmut Eckerlebe 4<br />
Date(s) of Experiment: 25 th October – 3 rd November 2008<br />
Objectives<br />
We continue investigations of the magnetic properties of two-dimensional spatially ordered<br />
system of ferromagnetic Ni nanowires embedded into Al 2 O 3 matrix under applied magnetic<br />
field. As was shown in our previous experiments [1], the small-angle scattering pattern exhibits<br />
many diffraction peaks (up to the third-fourth reflection orders), which corresponds to the<br />
scattering from highly correlated hexagonal structure of pores and magnetic nanowires. The<br />
magnetic field applied along the (10) crystallographic axis of the nanowire’s structure (perpendicular<br />
to the long nanowire axis) had shown unusual azimuth dependent magnetic and<br />
interference scattering. This is caused by the regular structure of the magnetic fields noncollinear<br />
to the external field existing even in the completely saturated sample. We concluded<br />
that these noncollinear components must come from the demagnetized field of an individual<br />
nanowire upon magnetization process [2]. The present experiment was aimed to study the<br />
magnetic scattering with the magnetic field applied along long axis of the nanowire.<br />
Experiment<br />
1. Samples preparation. Anodic Aluminum Oxide (AAO) membrane was prepared by the<br />
two-step anodization technique [1]. The resulting films with a thickness of 60 μm and the<br />
pore radius of 20 nm are used as templates to synthesize wire nanoparticles. For the controlled<br />
growth of Ni nanoparticles in the porous Al 2 O 3 matrix, electrostatic precipitation is performed<br />
in a three-electrode cell in a controlled potential regime. The duration of the Ni<br />
electrostatic precipitation is equal to 48 h, which corresponds, according to scanning electron<br />
microscopy, to the formation of wire nanoparticles with a length of 60 μm and a diameter of<br />
40 nm.<br />
2. Small-angle neutron scattering. SANS measurements were carried out with the instrument<br />
SANS-2 at the <strong>Geesthacht</strong> Neutron Facility (GeNF). Polarized neutron beam with the<br />
polarization P 0 = 0.95, with a wavelength = 0.5 nm and a wavelength spread of = 10 %<br />
was used. A film surface with an area of ~0.5 cm 2 was oriented parallel to the neutron beam.<br />
Such an orientation of the sample corresponds to the pore arrangement, as well as the long<br />
axis of the magnetic nanowires, be perpendicular to the incident neutron beam (Fig.1a). The<br />
chosen geometry of the experiment allows one to observe two diffraction reflections with the<br />
139
momentum transfer perpendicular to the nanowires long axis. The Sample-Detector distance<br />
of 21 m was used with appropriate collimations to cover scattering vectors q from 0.02<br />
to 0.12 nm -1 . An external magnetic field (up to 210 mT) was applied in the horizontal plane<br />
and perpendicular to the incident beam (parallel to the long axis of the nanowires). We determine<br />
the total (nuclear and magnetic) scattering (I(q) =I + (q) + I - (q)) and the polarization<br />
dependent part of the scattering (ΔI(q) = I + (q) - I - (q)) where I + (q) and I - (q) are the intensities<br />
for neutrons polarized parallel (+P 0 ) and anti-parallel (-P 0 ) to the magnetic field. The fielddependent<br />
scattering intensity is extracted as I H (q) = I(q,H) - I(q,0).<br />
Achievements and Main Results<br />
A diffraction patterns measured from AAO membrane with the embedded Ni nanowires for<br />
the neutrons with (+P 0 ) and (-P 0 ) are shown in Fig. 1b and c, respectively. The reflections<br />
visible on the top and bottom parts of the detector demonstrate the presence of the reflecting<br />
planes of nanowires with their normal being parallel to the scattering vector q.<br />
q y (nm -1 )<br />
0.069<br />
b)<br />
P 0<br />
0<br />
Z<br />
H<br />
Polarized<br />
neutrons<br />
Sample<br />
-0.069<br />
H<br />
0<br />
Position<br />
Sensitive<br />
Detector<br />
q x (nm -1 )<br />
c)<br />
P 0<br />
H<br />
Spin flipper<br />
Polarizer<br />
a)<br />
Figure 1: Scheme of the experiment (a). The 2D diffraction patterns from the sample with the incident<br />
polarization along +P 0 (b) and opposite -P 0 (c) to the field H = 800 mT.<br />
The momentum-transfer dependence of the total neutron scattering intensity I(q) is shown in<br />
Fig. 2a. The dependence I(q) is satisfactorily reproduced by the Gaussian with the centre at<br />
q 10 = 0.064± 0.004 nm –1 and a half-width w = 0.0100 ± 0.0005 nm –1 ; and the diffuse smallangle<br />
scattering, which is represented by the Gaussian centered at q = 0. The observed diffraction<br />
maxima are classified in the hexagonal lattice with the parameter a = 106 ± 2 nm.<br />
The magnetic-field dependent component the neutron scattering intensity I H (q) is shown in<br />
Fig. 2b. This component is the difference between the magnetic cross sections of the sample<br />
140
in two significantly different states: a state close to the saturation magnetization (in the field<br />
H = 210 mT) and a completely demagnetized state, i.e. without magnetic prehistory at H = 0.<br />
The main component of the magnetic cross-section at H = 210 mT is the ensemble of the<br />
magnetic reflections described by the Gaussian, whose position correspond to maxima of the<br />
nuclear scattering pattern. On contrary, the main component of the cross section in zero<br />
magnetic field is scattering on domains, individual nanowires and their clusters; i.e. diffuse<br />
scattering which is described by the Gaussian at q = 0, in a complete absence of any contributions<br />
to the diffraction peaks. The interference scattering contribution I(q) is shown in<br />
Fig. 2c. In high magnetic fields the polarization-dependent scattering consists of two contributions:<br />
interference maxima at q values coinciding with the positions of reflection and interference<br />
in diffuse small-angle scattering. These two contributions have the same signs.<br />
Total Intensity ( arb. units)<br />
12<br />
10<br />
8<br />
6<br />
4<br />
2<br />
a)<br />
0<br />
0.02 0.04 0.06 0.08 0.10 0.12<br />
q (nm -1 )<br />
Experimental points<br />
Fitt of Sum of Gausses<br />
I H (arb.units)<br />
80<br />
60<br />
Experimental points<br />
Fitt of Sum of Gausses<br />
40<br />
20<br />
0<br />
-20<br />
-40<br />
-60<br />
-80<br />
-100<br />
0.02 0.04 0.06 0.08 0.10 0.12<br />
q ( nm -1 )<br />
b)<br />
50<br />
0<br />
Experimental points<br />
Fitt of Sum of Gausses<br />
Figure 2:<br />
Momentum-transfer dependence of the<br />
total neutron scattering intensity I(q) (a),<br />
the magnetic intensity I H (q) (b) and the<br />
interference intensity I(q) (c).<br />
I ( arb. units)<br />
-50<br />
-100<br />
-150<br />
c)<br />
-200<br />
0.02 0.04 0.06 0.08 0.10 0.12<br />
q ( nm -1 )<br />
It is convenient sometimes to introduce the normalized magnetic scattering intensity R= I H /I<br />
and the normalized interference scattering intensity P = I/I. The magnetic field dependence<br />
of the normalized intensity R(H) = I H (H)/I(H) is shown in Fig. 3 at |q| = q (10) = 0.064 nm -1<br />
(a) for the Bragg reflection and at |q|= 0.033 nm -1 (b) for the diffuse scattering. The magnetic<br />
scattering at the Bragg reflection (Fig. 3a) is low and does not change with the magnetic<br />
field. The diffuse magnetic scattering (Fig. 3b) decreases with increase of the field and<br />
shows a large hysteresis. The magnetic field dependence of the normalized intensity P(H) =<br />
I(H)/I(H) is shown in Fig. 4 at |q| = q (10) = 0.064 nm -1 (a) for the Bragg reflection and at |q|=<br />
0.033 nm -1 (b) for the diffuse scattering. The interference scattering at the Bragg reflection<br />
(Fig. 4a) shows the hysteresis as well as for the diffuse interference scattering (Fig. 4b).<br />
141
0.08<br />
q= 0.064 nm -1<br />
0.04<br />
0.04<br />
0.00<br />
q= 0.033 nm -1<br />
R= (H)<br />
/ <br />
0.00<br />
-0.04<br />
R= (H) / <br />
-0.04<br />
-0.08<br />
-0.08<br />
0 50 100 150 200<br />
H (mT)<br />
a)<br />
-0.12<br />
0 50 100 150 200<br />
H (mT)<br />
b)<br />
Figure 3: Magnetic field dependence of the normalized magnetic scattering intensity<br />
R(H) = I H (H)/I(H) at |q| = q (10) = 0.064 nm -1 (a) and at |q|= 0.033 nm -1 (b).<br />
0.1 q = 0.064 nm -1<br />
a)<br />
0.10<br />
0.05<br />
q = 0.033 nm -1<br />
b)<br />
P = / <br />
0.0<br />
-0.1<br />
P = / <br />
0.00<br />
-0.05<br />
-0.10<br />
-0.2<br />
-0.15<br />
-0.3<br />
0 50 100 150 200<br />
H, mT<br />
-0.20<br />
-0.25<br />
0 50 100 150 200<br />
H, mT<br />
Figure 4: Magnetic field dependence of the normalized interference scattering intensity<br />
P(H) = I(H)/I(H) at |q| = q (10) = 0.064 nm -1 (a) and at |q|= 0.033 nm -1 (b).<br />
From one hand the interference shows that the nuclear and magnetic scattering potentials<br />
are strongly correlated both in the coherent and diffuse scattering. On the other hand, the<br />
interference scattering is proportional to the average magnetization of the sample. It is well<br />
seen from Fig. 4 that the sample is magnetized at H > 150 mT. The simple estimation shows<br />
that if P = 2 A m A n / A n 2 = 0.3, then the ratio of the magnetic to nuclear contributions<br />
I m /I n = (A m / A n ) 2 = 0.15 2 = 0.0225. This means that the magnetic scattering should be hardly<br />
distinguishable within error bars on the background of the nuclear scattering, as it is shown in<br />
Fig. 3a.<br />
Finally, we would like to thank our local contacts (Helmut Eckerlebe and Melissa Sharp) for<br />
their excellent support.<br />
Reference<br />
[1] S.V. Grigoriev, N.A. Grigorieva, A.V. Syromyatnikov, K.S. Napolskii, A.A. Eliseev, A.V. Lukashin,<br />
Yu.D. Tretyakov, H. Eckerlebe, JETP Letters, Vol. 85 (2007) pp. 605–610. (Translated from<br />
Pis’ma v Zhurnal Éksperimental’noi i Teoreticheskoi Fiziki, Vol. 85, 2007, pp. 738–743 – Spatially<br />
ordered arrays of magnetic nanowires: polarized neutron scattering investigation.)<br />
[2] S.V. Grigoriev, A.P. Chumakov, N.A. Grigorieva, K.S. Napolskii, H. Eckerlebe, GKSS Report<br />
2008/6, pp. 121–124. – Polarized SANS study of highly-ordered massives of the magnetic Ni<br />
nanowires embedded into Al 2 O 3 matrix.<br />
142
EXPERIMENTAL REPORT<br />
GeNF<br />
SANS-2<br />
Static properties of the spin-glass like system (Pd 0.984 Fe 0.016 ) 0.95 Mn 0.05<br />
from small angle scattering of polarized neutrons.<br />
Principal Proposer:<br />
Co-proposers:<br />
Experimental Team:<br />
G.P. Gordeev 1 , 1 Petersburg Nuclear Physics Institute (PNPI), Russia<br />
V.N. Zabenkin 1 , S.V. Grigoriev 1 , L.A. Axelrod 1 ,<br />
I.M. Lazebnik 1<br />
G.P. Gordeev 1 , V.N. Zabenkin 1 , V.A. Dyadkin 1 ,<br />
V.V. Piyadov 1 , H. Eckerlebe 2<br />
2 GKSS Research Centre <strong>Geesthacht</strong>, Germany<br />
Instrument scientist:<br />
H. Eckerlebe 2<br />
Date of Experiment: October 2008<br />
Objectives<br />
Our experiment deals with a search of chiral magnetic fluctuations in a alloy<br />
(Pd 0.984 Fe 0.016 ) 0.95 Mn 0.05 being in the reentrant spin-glass like state. According to Kawamura’s<br />
idea [1], spins of a magnet in spin-glass state are frozen in a define way, but not in random<br />
directions. Therefore, the three-particle (and more higher orders) correlations of spins are<br />
possible. He had proposed a chiral mechanism to explain the spin-glass phase transition in<br />
Heisenberg’s magnets with а small magnetic anisotropy. By other words, the spin-glass transition<br />
must be accompanied by chiral fluctuations.<br />
Experiment<br />
These fluctuations in a small magnetic field would be observed if the experiment with polarized<br />
neutrons is made in the special geometry. The latter follows from the expression of the<br />
chiral contribution to the magnetic scattering cross-section for polarized neutrons [2]:<br />
where <br />
ch<br />
0<br />
<br />
<br />
P Q P C ,<br />
0 0<br />
C S 1<br />
S 2<br />
is chirality ( S 1 , S 2 are the spins in points 1 and 2, respectively), Q is a<br />
scattering vector, P 0 is an initial polarization of a neutron beam. As seen from the expression<br />
the cross-section depends on the polarization direction relative to the vector Q and is characterized<br />
by the right-left asymmetry of scattering. If the magnetic field direction is normal to the<br />
neutron wavevector k then the magnetic scattering must be different for the cases: either P 0<br />
is directed along (intensity I + ) or opposite (intensity I - ) to the scattering vector Q. So, it is possible<br />
to measure the difference I + − I - both at Q < 0 and Q > 0.<br />
Due to competition of different sign in the exchange interactions, the given alloy undergoes<br />
the transition in the spin-glass like state from a ferromagnetic state below temperature T = 30 K.<br />
In the previous measurements we had carried out the SANS experiment to measure the<br />
magnetic scattering of polarized neutron at small magnetic field (≈ 4 Oe) under the temperature<br />
corresponding to the spin-glass state. Тhat time an essential difference in scattering for<br />
both Q < 0 and Q > 0 was not observed.<br />
Тhis time the experiment has been carried out at higher magnetic fields and at different<br />
ranges of Q. Small angle scattering of polarized neutrons was measured at the SANS-2<br />
setup (the neutron wave length λ = 0.57 nm, the beam polarization P 0 = 0.97) at the temperature<br />
143
T = 26 K mainly. This temperature is in the T-range where the drop of scattering intensity is<br />
observed upon temperature decrease (Fig. 1). (This drop indicates a transition of the alloy to<br />
the spin-glass like state ). The magnetic field was normal to neutron velocity.<br />
2,6x10 5<br />
2,4x10 5<br />
Figure 1:<br />
Intensity of SANS as a function of temperature (H = 10 Oe).<br />
2,2x10 5<br />
2,0x10 5<br />
Intensity<br />
1,8x10 5<br />
1,6x10 5<br />
1,4x10 5<br />
1,2x10 5<br />
1,0x10 5<br />
20 30 40 50 60 70<br />
T, K<br />
Achievements and Main Results<br />
The search for the spin-dependent neutron scattering (difference I + − I - ) was conducted for<br />
two scattering regimes (Q < 0 and Q > 0) at different ranges of Q (see Table 1). These results<br />
were obtained by integration of left (Q< 0) and right (Q > 0) quarter of 2D-detector ( Fig. 2).<br />
Table 1. Difference I + − I -<br />
T, К Q0 Parameters<br />
25 –690 ± 230 ± 360 H =10 Oe<br />
300<br />
26 –221 ± 645 ± 340 L = 3 м<br />
330<br />
28 14 ± 300 –330 ± 340<br />
26 –153 ± 5 –94 ± 4<br />
H =25 Oe<br />
L = 8 м<br />
The scattering from the PdFeMn alloy was concentrated in a small angle region near the<br />
beam-stop. It makes difficult the analysis of the results. Nevertheless it is seen that mean<br />
value of the difference I + − I - is bigger at higher field and for the large-scale structures (at larger<br />
sample-detector distance L). It must be noted that no full left-right asymmetry was observed<br />
in the experiment.<br />
The possible reasons an be the following: (1) a misalignment of the beam and/or the detector,<br />
(2) a misalignment the beam-stop with respect to the detector and/or the location of the<br />
beam-stop itself, (4) the contribution of the magnetic-nuclear interference scattering which is<br />
symmetric with respect to Q = 0. The latter is a very important because the magnetic system<br />
of PdFeMn is an asperomagnetic state, i.e. there is a collinear (ferromagnetic) component of<br />
a magnetic moment on the top of the disordered spin glass state. In this case the symmetrical<br />
interference scattering will add up to a possible asymmetrical static chiral scattering. As a<br />
result it could be no full asymmetry in the summed up pattern of the scattering. Perhaps it is<br />
this situation that we have observed in the experiment (Table 1).<br />
144
Figure 2:<br />
2D image of SANS by a PdFeMn sample<br />
and the Q-ranges (left and right) over which<br />
the scattering intensity is averaged out.<br />
Reference<br />
[1] H. Kawamura, M. Suan Li, Phys. Rev. Lett. 87 (2001) 187204 ( 1-4 ).<br />
S.V. Maleyev, Usp. Fiz. Nauk, 172 (2002 ) 617.<br />
145
146
EXPERIMENTAL REPORT<br />
GeNF<br />
DCD<br />
Double crystal diffractometer DCD<br />
Short Instrument Description:<br />
The double crystal diffractometer for ultra small angle neutron scattering (USANS) uses nonpolarised<br />
cold neutrons to characterise in materials large creep pores, fatigue and sintering<br />
cavities, precipitates, voids, bubbles, etc. with particle sizes in the range between 100 nm<br />
and 24 m in diameter.<br />
Local Contact:<br />
Dr. Melissa Sharp<br />
Phone/Fax : +49 4152 87-1209 / +49 4152 87-1338<br />
e-mail: melissa.sharp@gkss.de<br />
Schematic View of DCD:<br />
Instrument Details:<br />
Beamline:<br />
beamline 8 – cold neutron guide NG-1,<br />
max. beam cross section 30 x 40 mm 2<br />
Deflecting crystal:<br />
Si(111), mosaic spread 0.1 mrad<br />
Monochromator / analyser: channel-cut perfect Si crystals<br />
Wavelength resolution<br />
/ = 1·10 -5 ( = 0.443 nm)<br />
Max. flux at deflecting crystal = 2.5 x 10 8 cm -2 s -1<br />
Flux at sample position: 550 cm -2 s -1 (Si(111), = 0.443 nm)<br />
Range of momentum transfer: 1·10 -4 nm -1 Q 5·10 -2 nm -1<br />
Detectors:<br />
three 3 He-detectors<br />
Control of crystal alignment: electronic autocollimator,<br />
angular resolution < 0.05 rad<br />
Sample environment:<br />
thermostat (5 °C to +80 °C)<br />
electro magnet with field up to > 0.9 T<br />
automatic sample change<br />
147
148
EXPERIMENTAL REPORT<br />
GeNF<br />
DCD<br />
Characterization of particle-strengthened Molybdenum alloys<br />
Proposer:<br />
Co-Proposer(s):<br />
Experimental Team:<br />
User Group Leader:<br />
Instrument Responsible:<br />
P. Staron 1 , 1 GKSS Research Centre <strong>Geesthacht</strong>, Germany<br />
W. Knabl 2 , 2 PLANSEE Metall GmbH, 6600 Reutte, Austria<br />
M. Sharp 1<br />
A. Schreyer 1<br />
M. Sharp 1<br />
Date(s) of Experiment: 8 th – 12 th December 2008<br />
Objectives<br />
Molybdenum-Lanthanum oxide (ML) alloys contain a small amount of La 2 O 3 particles for<br />
increasing the recrystallisation temperature. This makes their high temperature properties<br />
superior to that of other Molybdenum alloys. Furthermore, the ductility, especially after high<br />
temperature application, and the creep resistance can be improved. Typical applications for<br />
such alloys are fixing or current feed-through<br />
wires for lamps as well as heating elements for<br />
high-temperature furnaces.<br />
The La 2 O 3 particles are most effective when they<br />
have sizes in the nanometre range. Therefore, it is<br />
important to know the particle sizes in a finished<br />
product.<br />
Experiment<br />
Three different ML samples with varying production parameters were measured in the DCD,<br />
together with the empty beam. The sample thickness was 1 mm. The DCD works with channel-cut<br />
crystals with triple reflections ensuring a low instrument background. The neutron<br />
wavelength was 4.4 Å. The number of points and data acquisition time was adapted to the<br />
available beam time.<br />
Achievements and Main Results<br />
Fig. 1 shows the scattering curves of the three samples and the instrumental curve. Fits have<br />
been calculated on the basis of a lognormal particle size distribution taking into account the<br />
slit height smearing of the DCD. Multiple scattering is negligible. It can be seen that two<br />
samples have nearly the same particle size and volume fraction. The mean value of the<br />
rather broad size distribution is about 4 µm. The third sample has a significantly lower mean<br />
particle size (0.3 µm).<br />
The results show that significant differences exist in the particle size distribution, depending<br />
on the production parameters. This knowledge could serve as a basis for an improvement of<br />
the product. A systematic study of a field of production parameters could probably be required,<br />
also using conventional SANS in addition.<br />
149
Figure 1: Scattering curves of the three ML samples and empty beam. Symbols are data; solid lines<br />
are fits on the basis of a lognormal particle size distribution.<br />
Reference<br />
The picture on page 149 was taken from the PLANSEE brochure 'Molybdenum – Material properties<br />
and applications' available at www.plansee.com.<br />
150
EXPERIMENTAL REPORT<br />
GeNF<br />
DCD<br />
Investigation of swollen Pluronic micelles at ultra-small angles<br />
Proposer:<br />
Co-Proposer:<br />
Experimental Team:<br />
User Group Leader:<br />
Instrument Responsible:<br />
Melissa Sharp 1 , 1 GKSS Research Centre <strong>Geesthacht</strong>, Germany<br />
Melissa Sharp 1<br />
Andreas Schreyer 1<br />
Melissa Sharp 1<br />
Date of Experiment: 15 th –18 th July 2008<br />
Objectives<br />
The study of the solubilisation of low-molecular weight organic compounds by Pluronic block<br />
copolymer micelles is of interest in the pharmaceutical industry, since such compounds may<br />
be used as adjuvants. Adjuvants are compounds used by the pharmaceutical industry to aid<br />
the drug delivery process [1] . A model system comprising Pluronic block copolymer micelles<br />
has been studied. These polymers are triblock copolymers, with structure poly(ethylene oxide)-<br />
poly(propylene oxide)-poly(ethylene oxide). The model adjuvants studied are benzyl benzoate<br />
and benzyl alcohol; the former is insoluble in water while the latter is slightly water soluble.<br />
The aim of the measurements is to gain a better understanding of how the structure of the<br />
polymeric micelles is affected by the incorporation of these model adjuvants, both at room<br />
temperature (25 ºC) and as the temperature is increased to body temperature (37 ºC).<br />
Previously small-angle neutron scattering (SANS) measurements have been carried out.<br />
These measurements show that for the samples with the highest concentration of benzyl<br />
alcohol that can be solubilised, there is an upturn of the scattering curves at lowest Q as the<br />
temperature is increased, as can be seen in Figure 1 for Pluronic P105 with 7 % benzyl alcohol<br />
solubilised [2] .<br />
Figure 1:<br />
Pluronic P105 with benzyl alcohol<br />
added. SANS data obtained on<br />
the LOQ instrument at ISIS, UK.<br />
The aim of the measurements on the DCD instrument, which is used for ultra-small-angle<br />
neutron scattering measurements, was to gain a better understanding of the changes that<br />
are causing the upturn at the lowest Q values in the SANS measurements. Two reasonable<br />
scenarios are first of all a change in the intermicellar interaction potential, secondly a change<br />
in the shape of the micelles from spherical to rod-like micelles.<br />
151
Experiment<br />
The measurements were carried out on the double crystal diffractometer DCD, which is used<br />
for ultra-small-angle neutron scattering measurements. The setup comprises two triplebounce<br />
channel cut perfect Si(111) crystals. The wavelength used was 4.43 Å; the wavelength<br />
resolution Δλ/λ was 1 x 10 -5 . The Q-range covered during the measurement was<br />
1.45 × 10 -5 nm -1 – 1.94 × 10 -2 nm -1 .<br />
An automatic sample changer connected to a Julabo was used for the measurement, which<br />
was carried out at 37 ºC.<br />
The sample studied consisted of Pluronic P105 with deuterated benzyl alcohol in aqueous<br />
solution. The aqueous solution was contrast matched to the benzyl alcohol, leaving only the<br />
scattering from the polymer.<br />
Achievements and Main Results<br />
The data obtained from the DCD instrument is slit smeared and affected by multiple scattering.<br />
In the data reduction procedure this is corrected for using the procedure described by<br />
Staron et al. [3] . The scattering curved obtained from the USANS measurement is shown together<br />
with the scattering curve obtained during the original SANS measurement in Figure 2.<br />
Figure 2:<br />
Pluronic P105 with benzyl alcohol added.<br />
Combined SANS and USANS data.<br />
Three distinct scattering regions are observed. At high Q a Q -4 dependence is observed, in the<br />
intermediate region a Q-dependence of approximately Q -2 is observed, while at low-Q another<br />
region with a Q -4 dependence is observed. This seems to suggest that there is a change in the<br />
intermicellar interaction potential, rather than a change in the shape of the micelles [4] .<br />
References<br />
[1] Wang, L.; Venkatraman, S.; Kleiner, L. J. Controlled Release 2004, 99, 207.<br />
[2] Sharp, M. PhD Thesis, University of Bristol, 2007<br />
[3] Staron, P.; Bellmann, D. J. Appl. Crystallogr. 2002, 35, 75<br />
[4] Sharp, M.; Pranzas, K.; Schreyer, A. Adv. Eng. Mater. 2008 (accepted for publication)<br />
152
EXPERIMENTAL REPORT<br />
GeNF<br />
PNR<br />
Reflectometer for polarised neutrons PNR<br />
Short Instrument Description:<br />
The polarised neutron reflectometer is used to study magnetic and non-magnetic surfaces,<br />
layers, thin films and membranes using cold non-polarised or polarised neutrons with high flux.<br />
Local Contact:<br />
Dr. Dieter Lott<br />
Phone/Fax : +49 4152 87-1372 / +49 4152 87-1338<br />
e-mail: dieter.lott@gkss.de<br />
Schematic View of PNR:<br />
l = 4 m z max = 4<br />
Instrument Details:<br />
Beamline: beamline 8 (NG-2l), cross section 30 x 40 mm 2<br />
Monochromator:<br />
helical slot selector<br />
Wavelength:<br />
0.635 nm<br />
Wavelength resolution: / = 0.05<br />
TOF equipment: 2 choppers, to be used if a resolution better than 0.05<br />
is required<br />
Polariser:<br />
transmission polariser<br />
Analyser<br />
set of bent supermirrors<br />
Spin flipper:<br />
hf-flipper<br />
Collimation lengths:<br />
4 m<br />
Flux at sample position:<br />
(beamsize: 0.5 x 40 mm 2 )<br />
nonpol = 1·10 5 cm -2 s -1 (unpolarised)<br />
pol = 3·10 4 cm -2 s -1 (polarised neutrons)<br />
distance sample-detector:<br />
3 m to 4 m<br />
angular range: 0° ≤ 2 ≤ 8°<br />
Detector:<br />
2-dim position-sensitive 3 He-counter<br />
Ancillary equipment:<br />
– refrigerator cryostats – temp.-range: 4 – 475 K<br />
– electro magnet up to 0.9 T with closed cycle<br />
refrigerator (8–300 K) suitable for polarised neutrons<br />
153
154
EXPERIMENTAL REPORT<br />
GeNF<br />
PNR<br />
Polarized neutron reflectometry on the interface<br />
of the heterostructure SiO 2 (Co)/Si<br />
Proposer:<br />
Co-Proposers:<br />
Experimental Team:<br />
N.A. Grigoryeva 1<br />
1 St-Petersburg State University, St-Petersburg, Russia<br />
S.V. Grigoriev 2 , 2 PNPI, Gatchina, St-Petersburg, Russia<br />
N.A. Grigoryeva 1 , E.A. Dyadkina 2 , L.V. Lutsev 3 ,<br />
D. Lott 4 , A.A.Vorobiev 5<br />
3 Research Institute «Ferrite-Domen», St-Petersburg, Russia<br />
4 GKSS Research Centre <strong>Geesthacht</strong>, Germany<br />
5 ESRF, Grenoble Cedex, France<br />
User Group Leader:<br />
S.V. Grigoriev 2<br />
Date(s) of Experiment: July 2008<br />
Objective<br />
The interest in ferromagnet/semiconductor (FM/SC) interfaces is increasing last years due to<br />
the possibility of employing these structures as spin injectors of polarized electrons in SC [1–3].<br />
Transfer of spin-polarized electrons (spin injection) from a magnetic contact into a nonmagnetic<br />
SC is intended for use in spintronic devices such as spin transistors, sensors, and<br />
magnetic memory cells [4, 5]. The spin injection is noticed to depend on a potential barrier<br />
formed at the interface. Electrons in the SC layer adjacent to the interface became polarized<br />
due to the RKKY-like exchange interaction with d-electrons in metal nanoparticles. Accordingly<br />
this interaction forms a potential barrier for spin-polarized electrons injected from the<br />
FM layer and enables their accumulation at the interface.<br />
Recently, the giant injection magnetoresistance (IMR) in the heterostructure SiO 2<br />
(Co 60 at.%)/GaAs was observed at room temperature [6, 7]. The IMR effect is presumably<br />
caused by the suppression of the electron injection from the granular film into the GaAs substrate<br />
induced by the magnetic field and is explained as surmounting of injected electrons<br />
over the potential barrier in the accumulation electron layer near the interface. The magnetic<br />
properties of the heterostructure<br />
SiO 2 (Co 60 at.%)/GaAs are supposed to be determined<br />
by the magnetic granular film (GF)<br />
SiO 2 (Co) and by the spin-polarized accumulation<br />
electron layer in the SC.<br />
Figure 1 shows the concentration dependence of<br />
the IMR effect observed at room temperature in<br />
the heterostructures on the GaAs and Si substrates.<br />
As one can see the IMR effect depends<br />
strongly on the material of the substrate – for<br />
SiO 2 (Co)/GaAs heterostructures the magnetoresistance<br />
is two orders of magnitude higher than the<br />
magnetoresistance for SiO 2 (Co)/Si heterostructures.<br />
Therefore, the IMR effect has clearly of the<br />
interfacial origin.<br />
155<br />
IMR<br />
4<br />
2<br />
0,05<br />
0,00<br />
GaAs<br />
Si<br />
40 50 60 70 80<br />
x Co<br />
, at.%<br />
Figure 1:<br />
IMR effect at 300 K and H = 2 T and<br />
U = 60 V in the heterostructures SiO 2<br />
(Co x at.%) on the GaAs and Si substrates.
In the present study we used polarized neutron reflectometry (PNR) for the investigation of<br />
the magnetic properties of a GF of SiO 2 containing 60 at.% of Co nanoparticles on Si substrate.<br />
The study is focused on the evolution of magnetic states of the GF as function of the<br />
magnetic field at three temperatures of interest: T = 120, 300, and 420 K. These temperatures<br />
were chosen to provide different magnetic states of the film SiO 2 (Co) which is, supposedly,<br />
ferromagnetic at T = 120 K, and 300 K and superparamagnetic at T = 420 K. Because,<br />
the IMR effect depends strongly on the temperature and is maximal at T = 300 K while it vanishes<br />
at low temperatures (smaller than 220 K) and at high temperatures (larger than 360 K).<br />
Samples<br />
GFs Au/SiO 2 (Co 60 %)/Si were prepared by the ion beam co sputtering of composite cobalt<br />
and quartz targets on the Si substrates. In resulting products ferromagnetic Co nanoparticles<br />
are embedded into dielectric SiO 2 matrix. The average size of the Co particles was estimated<br />
by means of small-angle X-ray scattering and equal 3.9 nm. The thickness of the GF is about<br />
68 ± 2 nm, the thickness of the Si substrate is 0.4 mm.<br />
Experimental Technique<br />
The PNR experiments were carried out at the reflectometer PNR (FRG-research reactor,<br />
GKSS Research Centre <strong>Geesthacht</strong>, Germany) that exploits a polarized neutron beam with<br />
initial polarization of P 0 = 0.95 and a neutron wavelength of = 6.35 Å (/ = 0.05). The<br />
polarization of the incident beam followed the direction of the external magnetic field (from 0<br />
to 320 mT at the sample position), which was applied perpendicular to the beam propagation<br />
vector and parallel to the film surface. The reflected intensity was measured for two incident<br />
polarizations I(+P 0 ) and I(-P 0 ) directed along and opposite to the guiding magnetic field. The<br />
PNR method was used because it offers the possibility to resolve both magnetic and nuclear<br />
density depth profiles of thin films deposited on a solid substrate [8].<br />
Reflectivity<br />
1<br />
0,1<br />
0,01<br />
1E-3<br />
SDL*10 -6 , -2<br />
T = 120K<br />
H = 0 mT<br />
H = 240 mT<br />
H = 240 mT<br />
0 20 40 60 80<br />
D, nm<br />
0,01 0,02 0,03 0,04<br />
Figure 2: Polarized neutron reflectivity data<br />
for the heterostructure Au/SiO 2 (Co 60 %)/Si<br />
are shown by filled (I + ) and open (I - ) circles.<br />
The insert shows a 3-layer model SLD profile<br />
used for the fitting of experimental data – solid<br />
line for I + and dashed line for I - .<br />
5<br />
4<br />
3<br />
2<br />
1<br />
0<br />
L 1<br />
q, nm -1<br />
L 2<br />
2N m<br />
(L 2<br />
)<br />
Sub<br />
Achievements and Main Results<br />
The PNR data for every temperature point<br />
were taken after the demagnetization process<br />
i.e. after application of the opposite<br />
magnetic field up to 900 mT. No difference<br />
between I + and I - components was observed<br />
for the sample Au/SiO 2 (Co 60%)/Si at H = 0<br />
indicating zero net magnetization of the film<br />
(Fig. 2). However, when an external field<br />
was applied, the GF SiO 2 (Co) is magnetized<br />
that results in splitting of the I + and I - reflectivity<br />
curves. Each reflectivity component<br />
was fitted separately with a two layer model<br />
with the scattering length density (SLD) profile<br />
of every layer has four parameters –<br />
thickness, roughness, nuclear SLD N n and<br />
magnetic SLD N m . The latter has the opposite<br />
signs for I(+P 0 ) and I(-P 0 ) reflectivity<br />
components and value is directly proportional<br />
to the in-plane magnetization of an<br />
appropriate layer<br />
156
1<br />
nn<br />
Nm<br />
8<br />
3.44 10<br />
2<br />
m<br />
M <br />
2<br />
4<br />
Here m n is the neutron mass, μ n is the neutron magnetic moment, N m is the magnetic SLD in<br />
Å -2 , M is the magnetization in GFs.<br />
Figure 3 illustrates the field dependences of<br />
the SLD of the middle part of the sample<br />
Au/SiO 2 (Co 60 %)/Si at different temperatures.<br />
From Fig. 3 it follows that the middle<br />
part of GF is in the ferromagnetic state at all<br />
three temperatures. Its magnetization decreases<br />
with increasing temperature: At the<br />
maximum applied field H = 320 mT, we found<br />
that N m = 0.88 0.02 · 10 -6 Å -2 at T = 120 K,<br />
while it decreases to 0.72 0.02 · 10 -6 Å -2 at<br />
T = 300 K and to 0.6 0.02 · 10 -6 Å -2 at<br />
T = 420 K what corresponds to the magnetization<br />
of M = 302 ± 7 Gs, 248 ± 7 Gs, and<br />
206 ± 7 Gs, respectively.<br />
No influence of the external fields was seen<br />
on the magnetic state of the GF in the heterostructure Au/SiO 2 (Co 60 %)/Si at all temperatures<br />
under study – it is always ferromagnetic. The absence of changes in the magnetic<br />
states correlates with the negligibly weak IMR effect observed in the GFs on the given Si<br />
substrates.<br />
SLD*10 -6 , Å -2<br />
4,0<br />
3,6<br />
3,2<br />
2,8<br />
2,4<br />
N<br />
m<br />
.<br />
SLD on<br />
SLD off<br />
T=120K<br />
T=300K<br />
T=420K<br />
0 50 100 150 200 250 300 350<br />
H, mT<br />
Figure 3:<br />
Magnetic field dependence of fitted SLD value<br />
for the ferromagnetic film Au/SiO 2 (Co 60 %)/Si.<br />
Finally, we would like to thank our local contacts Dr. Dieter Lott and Ursula Tietze for their<br />
excellent support.<br />
References<br />
[1] I. Zutic, J. Fabian and S. Das Sarma, Rev. Mod. Phys. 76, 323 (2004).<br />
[2] B.P. Zakharchenya and V.L. Korenev, Phys. Usp. 175, 603 (2005).<br />
[3] R. Bertacco, M. Riva, M. Cantoni, F. Ciccacci, M. Portalupi, A. Brambilla, L. Duo, P. Vavassori,<br />
F. Gustavsson, J.-M. George, M. Marangolo, M. Eddrief and V.H. Etgens, Phys. Rev. B 69,<br />
054421 (2004).<br />
[4] S.A. Wolf, D.D. Awschalom, R.A. Buhrman, J.M. Daughton, S. von Molnar, M.L. Roukes,<br />
A.Y. Chtchelkanova and D.M. Treger, Science 294, 1488 (2001).<br />
[5] G. Schmidt, J. Phys. D: Appl. Phys. 38, R107 (2005).<br />
[6] L.V. Lutsev, A.I. Stognij, and N.N. Novitskii, JETP Lett. 81, 514 (2005).<br />
[7] L.V. Lutsev, A.I. Stognij, N.N. Novitskii, A.A. Stashkevich, J. Magn. Magn. Mater. 300, E12 (2006).<br />
[8] M.R. Fitzsimmons and C.F. Majkrzak, in Modern Techniques for Characterizing Magnetic Materials,<br />
edited by Y. Zhu (Springer, New York, 2005), Chap. 3, pp. 107–155.<br />
157
158
EXPERIMENTAL REPORT<br />
GeNF<br />
PNR<br />
Self-diffusion in Single Crystalline Germanium<br />
Proposer:<br />
Co-Proposer(s):<br />
Harald Schmidt 1<br />
Erwin Hüger 1<br />
1 Clausthal University of Technology, Clausthal-Zellerfeld, Germany<br />
Experimental Team:<br />
User Group Leader:<br />
Instrument Responsible:<br />
Date(s) of Experiment: April 2008<br />
Erwin Hüger 1 , Sujoy Chakravarty 1 , Ursula Tietze 2<br />
Harald Schmidt 1<br />
Dieter Lott 2<br />
2 GKSS Research Centre <strong>Geesthacht</strong>, Germany<br />
Objectives<br />
Diffusion processes play an important role in many aspects of modern semiconductor science<br />
and technology, especially by generating ultra shallow junctions during fabrication of<br />
electronic devices. A very fundamental quantity is the self-diffusivity of the host atom in the<br />
crystalline matrix, which is governed by point defects (vacancies and self-interstitials). At<br />
present, a renewed interest in germanium exists for future commercial fabrication of field<br />
effect transistors [1]. For device engineering it is necessary to obtain fundamental information<br />
on the properties of native point defects in Ge since nearly all technological important dopant<br />
atoms utilize these as diffusion vehicle.<br />
For germanium a large number of diffusion measurements were realized in past within the<br />
temperature range from the melting point down to 550 °C using radioactive and stable tracers<br />
in combination with ion beam sputtering techniques [2, 3]. However, for these measurements<br />
minimum diffusivities of 2 x 10 -22 m 2 /s could be obtained only. In this study we applied<br />
a method based on neutron reflectometry which is able to determine self-diffusivities down to<br />
10 -25 m 2 /s and extremely short diffusion lengths down to 0.6 nm [5]. Using this method, the<br />
experimentally accessible data range is expanded significantly to lower temperatures and<br />
lower diffusion lengths. This allows a better data analysis and forms an improved data base<br />
for process simulations of nanosized semiconductor components. A detailed analysis of the<br />
experiments is given in Ref [4].<br />
Experiment<br />
The NR experiments were performed at the <strong>Geesthacht</strong> Neutron Facility at the reflectometer<br />
for polarizd neutrons PNR using cold neutrons at incoming wavelength of 0.64 nm. The<br />
measurements were carried out on single crystalline isotope multilayers containing 10 bilayers<br />
of the form nat Ge/ 70 Ge, which were deposited on a (001) oriented nat Ge substrate by molecular<br />
beam epitaxy at 250 °C. The samples were annealed inside a vacuum chamber at a<br />
pressure below 10 −6 mbar at temperatures between 596 and 429 °C for times between 20 min<br />
and 39 days.<br />
Achievements and Main Results<br />
The reflectivity of a [ 70 Ge/ nat Ge] 10 isotope multilayer is given in Fig 1(a), where Bragg peaks<br />
of first and third order are visible due to the isotope modulation. Diffusion annealing leads to<br />
a decrease of the Bragg peak intensity (Fig. 1(b)).<br />
159
Neutron reflectivity<br />
10 -1<br />
10 -2<br />
10 -3<br />
1 st order<br />
Bragg-peak<br />
10 0 o<br />
(a)<br />
3 rd order<br />
Bragg-peak<br />
0,08<br />
0,06<br />
0,04<br />
0,02<br />
as-deposited<br />
20min, 596°C<br />
68min, 596°C<br />
3 h, 572°C<br />
(b)<br />
Figure 1:<br />
(a) NR of an as-deposited<br />
Ge isotope multilayer.<br />
(b) Decrease in first order<br />
Bragg peak after annealing<br />
the Ge isotope multilayer.<br />
0,02 0,04 0,06 0,08<br />
o<br />
q z<br />
(A -1 )<br />
0,024 0,026 0,028 0,030<br />
q z<br />
(A -1 )<br />
The diffusivities (D) and diffusion lengths (L D ) were calculated from the decay of the Braggpeak<br />
intensity due to isotope intermixing [5]:<br />
2<br />
I(0)<br />
<br />
l ln<br />
<br />
I(<br />
t)<br />
D <br />
<br />
2 2<br />
8<br />
n t<br />
(1)<br />
L D<br />
2D<br />
t<br />
(2)<br />
where I(t) is the intensity of the n’th order Bragg peak after an annealing time t, I(0)) is the<br />
intensity of the n’th order Bragg peak of as-deposited, non-annealed sample, and l is the<br />
bilayer thickness.<br />
The obtained diffusivities are presented in Fig. 2 in comparison to literature data. As obvious,<br />
at high temperatures between 525 and 600 °C the diffusivities are in excellent agreement<br />
with literature data as measured by the radiotracer technique [2] or SIMS [3]. These results<br />
impressively demonstrate that our method gives diffusivities identical to those obtained by<br />
established methods. However, significantly smaller diffusion lengths are measured (0.6–<br />
4.1 nm instead of 15–400 nm [2,3]), meaning that also diffusion lengths in the order of 1 nm<br />
characterize long range diffusion processes in a correct way. At temperatures below 525 °C,<br />
additional diffusivities were measured by NR, expanding the range of experimental data by<br />
three orders of magnitude compared to sputtering techniques, forming an improved data<br />
base. Note that also the determination of ultra-slow diffusivities of D = (9.7 3.7) x 10 -26 m 2 /s<br />
becomes possible.<br />
At 596 °C diffusion anneals for 20 min [D = (1.50 ± 0.32) x 10 −21 m 2 s −1 ] and<br />
68 min [D = (1.63 ± 0.35) x 10 −21 m 2 s −1 ] were performed. The corresponding diffusion values<br />
agree within experimental accuracy (see Figure 2) indicating that the diffusion is not time<br />
dependent. A possible time dependence might be expected as a result of frozen in defects.<br />
Depending on the nature of these defects, i.e., vacancy or interstitial-like, they could give rise<br />
to transient enhanced or retarded self-diffusion. As shown in Fig. 2 the diffusivities obtained by<br />
NR can be very well described by an Arrhenius equation D = D 0 exp[−Q/ (kT)] with a single<br />
diffusion activation enthalpy Q = 3.13 ± 0.12 eV and a pre-exponential factor<br />
D 0 = 2.35 x 10 −3 m 2 s −1 (relative error of ln(D 0 ): 29 %). Taking into account all data between<br />
429 and 904 °C, the Arrhenius parameters Q = 3.13 ± 0.03 eV and D 0 = 2.54 x 10 −3 m 2 s −1<br />
are obtained. The strict Arrhenius behavior demonstrates that the vacancy mechanism,<br />
where the diffusing atom and a vacancy exchange sites during atomic motion, controls selfdiffusion<br />
over the whole temperature range. As obvious from equations (1) and (2) Bragg<br />
160
peaks of higher order have to be measured in order to detect diffusion lengths in the order of<br />
atomic distances.<br />
Figure 2:<br />
Arrhenius plots of Ge self-diffusivities<br />
obtained by NR (marked with red filled<br />
(circles) in comparison to literature data<br />
from secondary ion mass spectroscopy<br />
(SIMS) [2] and radiotracer sputter sectioning<br />
[3]. The continuous line represents<br />
a fit to the Arrhenius equation of all diffusivities<br />
displayed.<br />
Ge self-difussivity (m 2 /s)<br />
Temperature (°C)<br />
900 800 700 600 500 400<br />
10 -16 Neutron reflectometry [this work]<br />
10 -17<br />
10 -18<br />
Radiotracer [Werner et al. 1985]<br />
SIMS [Fuchs et al. 1995]<br />
10 -19<br />
10 -20<br />
10 -21<br />
10 -22<br />
10 -23<br />
10 -24<br />
10 -25<br />
10 -26<br />
9 10 11 12 13 14 15<br />
10000 / T (1/K)<br />
References<br />
[1] J. Vanhellemont, E. Simoen; Brother Silicon, Sister Germanium, J. Electrochem. Soc. 154 (2007),<br />
H572.<br />
[2] M. Werner, H. Mehrer, H.D. Hochheimer; Effect of hydrostatic-pressure, temperature and dopping<br />
on self-diffusion in germanium, Phys. Rev. B 32 (1985), 3939.<br />
[3] H.D. Fuchs, W. Walukiewicz, E.E. Haller, W. Dondl, R. Schorer, G. Abstreiter, A.I. Rudnev,<br />
A.V. Tikhomirov, V. I. Ozhogin; Germanium isotope heterostructures: An approach to self-diffusion<br />
studies, Phys. Rev. B 51 (1995), 16817.<br />
[4] E. Hüger, U. Tietze, D. Lott, H. Bracht, E. E. Haller, D. Bougeard, H. Schmidt; Self-diffusion in<br />
germanium isotope multilayers at low temperatures, Appl. Phys. Lett., 93 (2008), 162104.<br />
[5] H. Schmidt, M. Gupta, T. Gutberlet, J. Stahn, M. Bruns; How to measure atomic diffusion processes<br />
in the subnanometer range, Acta Materialia 56 (2008), 464.<br />
161
162
EXPERIMENTAL REPORT<br />
GeNF<br />
PNR<br />
Self-Diffusion in Nano-crystalline Fe<br />
Proposer:<br />
Co-Proposer(s):<br />
Experimental Team:<br />
User Group Leader:<br />
Instrument Responsible:<br />
Harald Schmidt 1<br />
Sujoy Chakravarty 1<br />
1 Clausthal University of Technology, Clausthal, Germany<br />
Sujoy Chakravarty 1 , Erwin Hüger 1 , Ursula Tietze 2<br />
Harald Schmidt 1<br />
Dieter Lott 2 , 2 GKSS Research Centre <strong>Geesthacht</strong>, Germany<br />
Date(s) of Experiment: April – October 2008<br />
Objectives<br />
Nano-crystalline metals with a grain diameter below 100 nm show in comparison to their<br />
coarse grained counterparts improved mechanical properties like high hardness and fracture<br />
toughness, which is attributed to the small grain size and the increased volume fraction of<br />
grain boundary interfaces [1–3]. For an understanding and accurate modelling of mechanical<br />
deformation [1], thermal stability, grain growth [4], and structural relaxation [5] the knowledge<br />
of atomic diffusivities close to room temperature is necessary. Despite its importance, reliable<br />
experimental data on diffusivities in nano-crystalline metals and alloys are limited and<br />
often very contradictory [5]. In pure metals reliable self-diffusivities close to room temperature<br />
are nearly completely lacking because of two reasons (1) extremely small diffusivities below<br />
10 -21 m 2 /s are expected and (2) grain growth takes place simultaneously during the diffusion<br />
measurements. Due to these facts conventional methods of diffusivity determination (e.g. the<br />
radiotracer method or SIMS) are not suited to obtain proper results, because extremely small<br />
diffusion lengths < 1 nm have to be measured. This is possible with neutron reflectivity and<br />
isotope multilayers [6]. This method also allows to measure diffusivities in nanometre sized<br />
thin films, which can be easily prepared by appropriate deposition methods.<br />
Experiment<br />
Nano-crystalline isotope multilayers of the form [ nat Fe/ 57 Fe] 20 were deposited on silicon substrates<br />
by magnetron and ion beam sputtering. Due to the difference in the neutron scattering<br />
lengths between 57 Fe (2.3 fm) and nat Fe (9.45 fm) strong Bragg peaks due to isotopic<br />
periodicity are formed in the neutron reflectivity pattern, which are measured by polarized<br />
neutron reflectometry at PNR. The samples were annealed in the temperature range between<br />
310 and 510 °C for various times between 20 min and 48 h in vacuum (~ 10 -7 mbar)<br />
and measured again. From the difference in the reflectivity patterns of the as-deposited and<br />
annealed samples the self-diffusivities of nanocrystalline Fe were determined.<br />
Achievements and Main Results<br />
The deposited Fe isotope multilayers have nano-columnar grains with approximate dimensions<br />
of about 30 nm (in-plane) and about 250 nm (out-of-plane) as determined by TEM. The<br />
grain size does not significantly change during the diffusion anneals. A neutron reflectivity<br />
pattern of a [ nat Fe(10 nm)/ 57 Fe(5 nm)] 20 isotope multilayer in the as-deposited state is given in<br />
Fig. 1(a). As obvious, a Bragg peak with an excellent peak to background ratio of about 30 is<br />
163
observed giving significant contrast for the experiment. Annealing leads to interdiffusion of<br />
the Fe-isotopes and thus to a decrease in the height of the Bragg peak. This decrease can<br />
be used for calculating the diffusivity, D, according to the equation<br />
2<br />
I(<br />
t)<br />
8<br />
ln<br />
<br />
Dt<br />
(1)<br />
I<br />
<br />
2<br />
0 d<br />
where I is the intensity of the first order Bragg peak and d is the bilayer periodicity. In Fig.<br />
1(b) the decrease of the first order Bragg peak as a function of annealing time is shown for<br />
anneals at 360 °C.<br />
Reflectivity<br />
10 0 (a)<br />
10 -1<br />
10 -2<br />
R q z<br />
4<br />
(a. u.)<br />
5<br />
4<br />
3<br />
2<br />
(b)<br />
360 °C<br />
as-deposited<br />
20 min<br />
2 h<br />
6 h<br />
30 h<br />
10 -3<br />
1<br />
10 -4<br />
0.00 0.02 0.04 0.06 0.08<br />
q z<br />
(Ang. -1 )<br />
0.060 0.065 0.070 0.075<br />
Figure 1: (a) Neutron reflectivity pattern of a [ nat Fe(10 nm)/ 57 Fe(5 nm)] 20 isotope multilayer probed with<br />
polarized neutrons (R + ) at a field of 300 G;<br />
(b) Decrease of the first order Bragg peak of a [ nat Fe(7 nm)/ 57 Fe(3 nm) x20 isotope multilayer as a function<br />
of annealing time for anneals at 360 °C.<br />
0<br />
q z<br />
(Ang. -1 )<br />
In Fig. 2(a) the diffusivities resulting from the data in Fig. 1(b) are shown. As obvious, the<br />
diffusivities are not constant, but decrease drastically as a function of annealing time. This<br />
behaviour is due to the fact that point defects (vacancies or interstitials) frozen in during the<br />
preparation by sputter deposition were annihilated during annealing. Consequently, the number<br />
of diffusion defects decreases, leading also to a decrease of the diffusivities. This behaviour<br />
can be described by a structural relaxation model, where the diffusivity<br />
is given by<br />
<br />
, D D D D exp t / <br />
(2)<br />
R 0<br />
and where D 0 is the diffusivity in the initial state and D R in the relaxed state respectively, and<br />
is a time constant. The instantaneous diffusivities, D, can be calculated from the measured<br />
average diffusivities by<br />
t<br />
1<br />
. Dav(t)<br />
D(t') dt'<br />
(3)<br />
t<br />
In Fig. 2(b) the diffusivities in the relaxed state, D R , and the initial diffusivities after 20 min of<br />
annealing are displayed in an Arrhenius plot in comparison to literature data on grain boundary<br />
and volume diffusion in coarse grained and nanocrystalline Fe. Note that the literature<br />
data for nano-crystalline Fe measured by the radiotracer technique [7] were not obtained in a<br />
stable nanostructure because considerable grain growth occurred during diffusion.<br />
The initial diffusivities are about two orders of magnitude higher than the diffusivities in the<br />
relaxed state, representing diffusion in a highly non-equilibrium state, which is dominated by<br />
a high and nearly constant concentration of structural defects, which are annihilated during<br />
annealing.<br />
0<br />
R<br />
164
D (m 2 /s)<br />
10 -21 (a)<br />
D av<br />
D<br />
10 -22<br />
10 -23<br />
360°C<br />
10 100 1000<br />
t (min)<br />
1.2 1.6 2.0 2.4<br />
Figure 2: (a) Self-diffusivities in nano-crystalline Fe as a function of annealing time at 360 °C. Shown<br />
are average diffusivities (D av ) and instantaneous diffusivities (D). Dots are experimental data and lines<br />
simulations according to Eqs. (2) and (3); (b) Self-diffusivities in nano-crystalline Fe as a function of<br />
reciprocal temperature.<br />
The diffusion behaviour of D R can be subdivided into two regions. At temperatures above<br />
400 °C the relaxed diffusivities are in good agreement with the volume diffusivities obtained<br />
for Fe single crystals [8]. At lower temperatures the diffusivities remain roughly constant at a<br />
value of 5 x 10 -24 m 2 /s. This means that in the relaxed state still structural defects inherent to<br />
the nanocrystalline structure are present in addition to thermal defects. Note that the diffusion<br />
lengths measured in this study are between 0.8 and 2 nm, not detectable by conventional<br />
methods of diffusivity determination. This means that the observed structural relaxation effects<br />
can also not be measured by conventional methods.<br />
As also shown in Fig. 2(b), the measured diffusivities are lower than the (extrapolated) literature<br />
data on grain boundary diffusion. That is due to the fact that all diffusivities measured in<br />
this study are in the type B region of Harrison’s classification scheme [11], which is defined<br />
by /20 < (D V t) 0.5 d/20, where = 0.5 nm is the grain boundary diameter and d = 30 nm is<br />
the grain diameter, respectively. In this regime grain boundary diffusion and volume diffusion<br />
both contribute to the decrease of the Bragg peak, however, volume diffusion dominates. At<br />
present, it is not possible to separate grain boundary and volume diffusion in our experiments<br />
due to the strong relaxation effects. In order to measure pure grain boundary diffusion in type<br />
C regime, where volume diffusion is frozen-in ((D V t) 0.5 < /20), experiments at considerably<br />
lower temperatures and shorter annealing times have to be carried out. These are planned<br />
for the next beam time period. Identical measurements as for ion beam sputtered samples<br />
were carried out for magnetron sputtered samples in order to test the influence of the deposition<br />
method on the results. The obtained diffusivities are lower by a factor of only 1.5 to 2,<br />
meaning they are nearly identical within error limits.<br />
D(m 2 /s)<br />
T (°C)<br />
600 400 200<br />
10 -12<br />
10 -14<br />
10 -16<br />
10 -18<br />
10 -20<br />
10 -22<br />
10 -24<br />
10 -26<br />
10 -28<br />
10 -30<br />
Grain boundaries (type B)<br />
d = 200 m [10]<br />
Volume [8]<br />
Grain boundaries (type C)<br />
d = 2.5 mm [9]<br />
D R<br />
10 3 /T (K -1 )<br />
Grain boundaries (type C)<br />
d = 30 - 70 nm [7]<br />
20 min<br />
this work<br />
(b)<br />
References<br />
[1] J. Weissmueller et al., Adv. Eng. Mater. 7 (2005), 203.<br />
[2] K. S. Kumar et al., Acta Mater. 51 (2003), 5743.<br />
[3] E. Arzt, Acta Mater. 46 (1998), 5611.<br />
[4] H. Natter et al., J. Phys. Chem. 104 (2000), 2467.<br />
[5] R. Wuerschum et al., Adv. Eng. Mater. 5 (2003), 365.<br />
[6] H. Schmidt et al., Phys. Rev. Lett. 96 (2006), 055901.<br />
[7] H. Tanimoto et al., Nanostr. Mater. 12 (1999), 681.<br />
[8] M. Lübbehusen et al. Acta Metall. Mater. 38 (1990), 283.<br />
[9] A. Inoue et al., Acta Mater. 55 (2007), 5910.<br />
[10] S. V. Divinski, et al., Zeitschr. Metallkd. 95 (2004), 945.<br />
[11] L. G. Harrison, Trans. Faraday Soc. 57 (1961), 1191.<br />
165
166
EXPERIMENTAL REPORT<br />
GeNF<br />
PNR<br />
Neutron Reflectometry on Si x C y N z isotope multilayers<br />
Proposer:<br />
Co-Proposer(s):<br />
Experimental Team:<br />
User Group Leader:<br />
Instrument Responsible:<br />
Harald Schmidt 1<br />
Erwin Hüger 1<br />
1 Clausthal University of Technology, Clausthal-Zellerfeld, Germany<br />
Erwin Hüger 1 , Ursula Tietze 2<br />
Harald Schmidt 1<br />
Ursula Tietze 2 , Dieter Lott 2<br />
2 GKSS Research Centre <strong>Geesthacht</strong>, Germany<br />
Date(s) of Experiment: September 2008<br />
Objectives<br />
The objective of the present test measurements was to clarify whether it is possible to determine<br />
diffusivities in magnetron sputtered amorphous Si x C y N z films by neutron reflectometry<br />
(NR). Si x C y N z materials are a interesting new class of multifunctional high temperature<br />
materials with potential applications various branches of technology [1–7]. They exhibit a<br />
useful combination of materials properties, such as: high temperature oxidation resistance<br />
[2], high hardness [3], wide band gap characteristics [4], a wide optical transparency window<br />
[5], low cost and high temperature ultraviolet sensors [6]; and promising field emission characteristics<br />
[7].<br />
The thermal stability of these materials and the transformation behaviour to nano-crystalline<br />
solids is essentially determined by self-diffusion of the constituting elements. NR allows the<br />
detection of extremely short diffusion lengths below 1 nm at corresponding low selfdiffusivities<br />
down to 10 -25 m 2 s -1 [8] Such a combination of values cannot be achieved by<br />
conventional methods of diffusivity determination. Using NR, the extensive characterization<br />
of materials which are in a non-equilibrium state, like amorphous solids becomes possible.<br />
Experiment<br />
The measurements were carried out at the neutron reflectometer PNR on amorphous Si x C y N z<br />
isotope multilayers containing 10 bilayers of the form Si x C y 15 N z /Si x C y 14 N z , which were deposited<br />
on a silicon wafer by reactive magnetron sputtering.<br />
Achievements and Main Results<br />
The background corrected reflectivity (Rq 4 ) of [Si 2 C 15 N 4 /Si 2 C 14 N 4 ] 10 isotope multilayers is<br />
given in Fig. 1, where Bragg peaks of first and third order are visible due to the isotope<br />
modulation. Such samples are suitable for diffusion studies with NR.<br />
167
R(q)*q 4<br />
1,0x10 -7<br />
8,0x10 -8<br />
6,0x10 -8<br />
4,0x10 -8<br />
2,0x10 -8<br />
0,0<br />
Small Sample<br />
R(q)*q 4<br />
2,5x10 -4<br />
2,0x10 -4<br />
1,5x10 -4<br />
1,0x10 -4<br />
5,0x10 -5<br />
0,0<br />
Large Sample<br />
0,0 0,1 0,2 0,3 0,4 0,5 0,6 0,7 0,8 0,9 1,0<br />
q (nm -1 )<br />
Figure 1: NR of an as-deposited [Si 2 C 15 N 4 /Si 2 C 14 N 4 ] 10 isotope multilayer of a small (1 cm x 1 cm) and<br />
a large (2 cm x 2 cm) sample.<br />
References<br />
[1] R. Riedel, G. Passing, H. Schönfleder, R.J. Brook; Synthesis of dense silicon-based ceramics at<br />
low temperatures, Nature 355 (1992), 714.<br />
[2] R. Riedel, H.-J. Kleebe, H. Schönfelder, F. Aldinger; A covalent micro/nano-composite resistant to<br />
high-temperature oxidation, Nature 374 (1995) 526.<br />
[3] A. M. Wrobel, I. Blaszczyk-Lezak, A. Walkiewicz-Pietrzykowska, T. Aoki, J. Kulpinski; Hard and<br />
high-temperature-resistant silicon carbonitride coatings based on N-silyl-substituted cyclodisilizane<br />
rings, Journal of the Electrochemical Society 155 (2008), K66.<br />
[4] F. G. Della Corte, S. Rao, M.A. Nigro, F. Suriano, C. Summonte; Electro-optically induced absorption<br />
in amorphous SiH/SiCN waveguiding multistacks; Optics Express 16 (2008), 7540.<br />
[5] Chul Huh, K.-H. Kim, J. Hong, H. Ko, W. Kim, G.Y. Sung; Influence of a Transparent SiCN doping<br />
layer on performance of silicon nanocrystal LEDs, Electrochemical and Solid-State Letters 11<br />
(2008), H296.<br />
[6] Tse-Heng Chou, Yean-Kuen Fang, Yen-Ting Chinag, Cheng-I Lin, Che-Yun Yang; A low cost n-<br />
SiCN / p-SiCN homojunction for high temperature and high gain ultraviolet detecting applications,<br />
Sensors and Actuators A 147 (2008), 60.<br />
[7] L. Liao, Z. Xu, H. Liu, W.L. Wang, S. Liu, X.D. Bai, E.G. Wang, J.C. Li, C. Liu; Large-scale aligned<br />
silicon carbonitride nanotube arrays : Synthesis, characterization, and field emission property, J.<br />
Appl. Phys. 101 (2007), 114306.<br />
[8] E. Hüger, U. Tietze, D. Lott, H. Bracht, E. E. Haller, D. Bougeard, H. Schmidt; Self-diffusion in<br />
germanium isotope multilayers at low temperatures, Appl. Phys. Lett., 93 (2008), 162104.<br />
168
EXPERIMENTAL REPORT<br />
GeNF<br />
NeRo<br />
Neutron reflectometer NeRo<br />
Short Instrument Description<br />
The Neutron Reflectometer NeRo is designed for measurements of thin film sytems including<br />
polymer and magnetic systems using cold non-polarised / polarised neutrons with high resolution.<br />
Local Contact:<br />
Dr. Dieter Lott<br />
Phone/Fax : +49 4152 87-1372 / +49 4152 87-1338<br />
e-mail: dieter.lott@gkss.de<br />
Schematic View of NERO:<br />
169
Instrument Details:<br />
Beamline:<br />
beamline 8 (NG-1)<br />
Wavelength:<br />
= 0.433 nm;<br />
Wavelength resolution / = 0.02<br />
Angular range -20° ≤ ≤ 100°<br />
Flux at sample position: = 7 · 10 4 cm -2 s -1 (unpolarised, standard collimation)<br />
Detectors:<br />
2-dim position-sensitive 3 He-counter<br />
3 He pencil counter<br />
Polarisation equipment: Transmission polariser/analyser<br />
2D-analyser: super-mirror stack for measurements of<br />
magnetic diffuse reflectivity<br />
2 Mezei-flippers<br />
Ancillary equipment:<br />
Several refrigerator cryostats – temp.-range: 4–475 K<br />
electro magnet with field up to 0.9 T<br />
cryo-magnet with field up to 5 T<br />
170
EXPERIMENTAL REPORT<br />
GeNF<br />
NeRo<br />
Influence of Spin-Glass ordering on the Giant Magneto-Resistance in<br />
Co/CuMn Multilayers<br />
Proposer:<br />
Co-Proposer(s):<br />
Experimental Team:<br />
User Group Leader:<br />
Instrument Responsible:<br />
Frank Klose 1 , 1 Bragg Institute, Australian Nuclear Science and<br />
Technology Organisation (ANSTO)<br />
Nicholas Loh 1,2 , Anton Stampfl 1<br />
2 School of Physics, The University of Western Australia<br />
Robert Stamps 2<br />
Frank Klose 1 , Nicholas Loh 1,2 , Thomas Saerbeck 1,2<br />
Robert Robinson 1<br />
Dieter Lott 3 , 3 GKSS Research Centre <strong>Geesthacht</strong>, Germany<br />
Date(s) of Experiment: 23 rd June – 8 th July 2008<br />
Objectives<br />
Multilayer structures consisting of ferromagnetic films separated by a non-magnetic spacer<br />
layer lead to large changes in resistance depending on the relative orientation of magnetisation<br />
in adjacent ferromagnetic layers. This is known as the giant magneto-resistance effect<br />
and it has massive technological applications in data storage and readout.<br />
A Japanese group has investigated the Co/Cu manifestation of this phenomenon and in particular<br />
the effect that doping the Copper spacer layer with 4 % at. Mn has on the RKKY coupling<br />
[1]. They discovered an interesting effect that for antiferromagnetically coupled multilayers<br />
(Co15Å/CuMn15Å) below a critical temperature, T b , of around 70 K there is a significant<br />
increase in the measured magneto-resistance. The increased resistance suggests that<br />
some kind of antiferromagnetic (AFM) arrangement of the Co layer magnetisations arises<br />
upon cooling leading to greater conduction electron scattering at the interfaces. As this result<br />
is only seen at low temperatures it is posited in [1] that a phase transition involving the freezing<br />
of Mn spins within the spacer layer into a spin-glass like state occurs at T b and is responsible<br />
for the changes in interlayer ordering.<br />
The aim of our study was to confirm the existence of temperature dependent Co misalignment<br />
by observing a half-order peak in the Polarised Neutron Reflectivity (PNR) profile. Furthermore,<br />
it is possible the misalignment takes the form of classic collinear AFM order, a<br />
more exotic arrangement where adjacent Co layers align at 90º due to biquadratic coupling<br />
or even a multi-domain state and we aimed to distinguish between these cases.<br />
Experiment<br />
Samples with three different CuMn spacer layer thicknesses 15 Å, 19 Å and 36 Å were investigated.<br />
Full polarised reflectivity profiles were obtained from each sample at room temperature<br />
in zero field, at 27 K in zero field and at 27 K in a saturating field resulting in nine data<br />
sets. In addition the ½ order peak was measured as a function of field and temperature.<br />
Achievements and Main Results<br />
In Figure 1 the appearance of a ½ order peak upon cooling of the 19 Å spacer layer sample<br />
to 27K can be seen confirming the existence of temperature dependent antiferromagnetic<br />
171
ordering amongst the Co layers. Interestingly, neither the ferromagnetic peak nor the critical<br />
edge splitting are reduced at 27K indicating that the AFM peak may be due to only a small<br />
proportion of the moments. A more detailed temperature dependence of the peak is shown in<br />
Figure 2 and indicates a value of 105 (± 6) K for the onset of AFM correlations.<br />
10 0<br />
Reflected Neuron Intensity<br />
10 -1<br />
10 -2<br />
10 -3<br />
10 -4<br />
Temperature: 300K<br />
Field: 1.3mT<br />
Cross Sections<br />
R ++<br />
R + -<br />
R - -<br />
FM / Structural<br />
Peak<br />
10 -5<br />
0.05<br />
0.10<br />
Q z<br />
(Å -1 )<br />
0.15<br />
0.20<br />
10 0<br />
Reflected Neuron Intensity<br />
10 -1<br />
10 -2<br />
10 -3<br />
10 -4<br />
Temperature: 27K<br />
Field: 1.3mT<br />
AFM<br />
Peak<br />
Cross Sections<br />
R ++<br />
R + -<br />
R - -<br />
FM / Structural<br />
Peak<br />
10 -5<br />
0.05<br />
0.10<br />
Q z<br />
(Å -1 )<br />
0.15<br />
0.20<br />
Figure 1: Polarised Neutron Reflectivity profiles from a Co(21Å)/CuMn(19Å)x30 sample at room temperature<br />
and 27 K showing the onset of antiferromagnetic correlations.<br />
AF Peak Intensity (Arb. Units)<br />
120<br />
100<br />
80<br />
60<br />
40<br />
20<br />
Antiferromagnetic Bragg Peak Intensity<br />
for the Co(21Å)/CuMn(19Å)x30<br />
GMR multilayer structure<br />
0<br />
70<br />
80<br />
90<br />
100<br />
110<br />
Temperature (K)<br />
Figure 2: Temperature dependence of the ½ order antiferromagnetic peak.<br />
172
Furthermore, analysis of the full 2D reflectivity (Figure 3) shows there is a strong off-specular<br />
diffuse scattering component to the AFM peaks suggesting the formation of lateral magnetic<br />
structures such as domains. Detailed analysis is ongoing but indications are that the ½ order<br />
peaks can be explained in terms of antiferromagnetic or biquadratic domains that are smaller<br />
than the neutron coherence length. Fitting of this peak will lead to more information about the<br />
distribution domain sizes.<br />
In conclusion, this was a very successful beamtime where we confirmed the existence of<br />
a change in the Co interlayer ordering below a certain temperature, which was found to be<br />
105 (± 6) K. Further analysis will allow for the detailed determination of the low temperature<br />
magnetic state.<br />
Figure 3: 2D reflectivity maps for all three polarised cross-sections measured showing the diffuse<br />
scattering component of the ½ order peaks.<br />
Reference<br />
[1] Y. Kobayashi et al., Phys. Rev. B 59, 3734 (1999)<br />
173
174
EXPERIMENTAL REPORT<br />
GeNF<br />
NeRo<br />
Polarized Neutron Reflectivity Studies on a FM/AF FePt 3 multilayer grown<br />
on Al 2 O 3<br />
Proposer:<br />
Co-Proposers:<br />
Experimental Team:<br />
User Group Leader:<br />
Instrument Scientist:<br />
Dieter Lott 1 , 1 GKSS Research Centre <strong>Geesthacht</strong>, Germany<br />
Gary J. Mankey 2 , 2 MINT Center, University of Alabama, USA<br />
Frank Klose 3 , 3 Bragg Institute, ANSTO, Australia<br />
Dieter Lott 1 , Ursula Tietze 1<br />
Andreas Schreyer 1<br />
Dieter Lott 1<br />
Date(s) of Experiment: 25 th October – 5 th November 2008<br />
Objectives<br />
In recent years, significant research efforts were aimed at exploring the exchange bias effect<br />
in thin film structures because of its implementation in devices such as spin valves in<br />
magnetoresistive sensors and non-volatile magnetic random access memory cells (MRAM).<br />
While the basic mechanisms leading to exchange bias are qualitatively well understood, a<br />
quantitative understanding of the effect is challenging, in view of the frequently used complex<br />
chemical structures and electronic interactions at actual ferromagnetic (FM) / antiferromagnetic<br />
(AF) thin film interfaces. In order to test the applicability of theoretical models it<br />
would be highly desirable to investigate FM/AF interfaces that are structurally as perfect as<br />
possible. In this regard, FePt 3 is a remarkable exception because, depending on the degree<br />
of chemical order, it can, at the same temperature and composition, develop either FM or AF<br />
magnetic order [1, 2]. The crystal structure of FePt 3 is similar to Cu 3 Au which is a prototype<br />
for a chemical order-disorder transition. Stoichiometric FePt 3 in perfectly chemically ordered<br />
face-centered cubic (fcc) L1 2 structure shows antiferromagnetic order below TN = 170 K<br />
(bulk). In this structure, the chemical order corresponds to the Fe atoms occupying the<br />
corners and Pt atoms located at the faces of the cubic cell. The Fe moments (m Fe = 3.3 μ B<br />
extrapolated to T = 0 K) order on (110) alternating ferromagnetic subsheets, while the Pt<br />
atoms carry a small moment (m Pt < 0.2 μB).<br />
Completely disordered FePt 3 , has a fcc structure in which each lattice site is occupied by, on<br />
average, ¼ Fe and ¾ Pt atoms, where the atomic fractions represent probabilities. Chemically<br />
disordered bulk FePt 3 orders FM at temperatures below about 425 K (m Fe = 4.0 μ B and<br />
m Pt < 0.2 μ B ).<br />
In the experiment we examined a multilayer of five bilayers with subsequent chemically<br />
ordered and disordered FePt 3 layers of 40 nm and 10nm thicknesses grown on an Al 2 O 3<br />
substrate. The design of this experiment was stimulated by a prior result where we studied a<br />
superlattice of CoPt 3 /FePt 3 . It was expected such a superlattice would constitute a FM/AF<br />
system since the perfectly ordered films are FM for CoPt 3 and AF for FePt 3 . But a detailed<br />
analysis of the data showed that a portion of the FePt 3 contributed to the ferromagnetism of<br />
the sample [3]. These results show the tantalizing result that a properly designed sample<br />
may exhibit a new result, namely a material which is exchange biased with itself. The goal of<br />
the present experiment was to determine the FM contribution of the disordered FePt 3 layers<br />
of a FePt 3 (ordered)/FePt 3 (disordered) multilayer grown on Al 2 O 3 in dependence on the<br />
temperature and magnetic field. Unpolarized neutron diffraction studies carried out at IN12 at<br />
the ILL in Grenoble confirmed the AF ordering along the (½ ½ 0) direction. Fig. 1 shows the<br />
175
integrated intensities around the (½½0) reflection confirming clearly an AF contribution from<br />
the ordered FePt 3 layers with a Néel temperature of about 150K only little below the bulk<br />
value.<br />
integrated intensity [260 sec]<br />
2000<br />
1500<br />
1000<br />
500<br />
Intensity [arb.units]<br />
400<br />
300<br />
200<br />
100<br />
T=10K<br />
T=100K<br />
T=137K<br />
T=150K<br />
(1/2 1/2 0)<br />
Figure 1:<br />
Integrated intensity along the (½ ½0)<br />
Bragg peak position for the 5x[FePt 3<br />
(disordered,10nm)/FePt 3 (ordered, 40 nm)<br />
on Al 2 O 3 (1120) substrate. Insets show<br />
Bragg peak for selected intensities.<br />
Measurements carried out at IN12 at the<br />
ILL in Grenoble.<br />
0<br />
0<br />
0.48 0.49 0.50 0.51 0.52 0.53<br />
Q h<br />
,Q k<br />
[r.l.u.]<br />
0 20 40 60 80 100 120 140 160 180<br />
Temperature [K]<br />
Sample<br />
The sample consists of five bilayers of ordered and disordered FePt 3 of 40 nm and 10 nm<br />
thicknesses, respectively. The chemical order was controlled by the growth temperature<br />
(600 o C for the ordered and 500 o C for the disordered phase). The multilayer was grown on<br />
an Al 2 O 3 substrate with an Cr (5 nm) and Pt(12 nm) buffer layer to allow epitaxial growth of<br />
the layers. To avoid oxidation the multilayer was capped by a Pt layer of 8 nm thickness.<br />
Experimental Technique<br />
In order to determine ferromagnetic contribution of the disordered FePt 3 layers polarized neutron<br />
reflectivity studies were carried out at the NeRo reflectometer at GKSS. The wavelength<br />
used at the experiment was 4.34 Å with a wavelength resolution of Δλ/λ = 0.02 and an initial<br />
polarization of P o = 0.975. The sample was cooled down to T = 27 K at a cooling field of<br />
H = 920 mT to establish the exchange bias effect. In general no polarization analysis was<br />
applied to increase the signal on the small sample. The absence of any coherent spin rotation<br />
was confirmed for selected temperatures and magnetic fields by applying full polarization<br />
analysis showing that no significant Spin Flip intensity could be observed.<br />
Achievements and Main Results<br />
The polarized neutron reflectivity scans were taken at different temperatures and magnetic<br />
fields. In Fig. 2 shows the temperature dependence of polarized reflectivity spectra of the<br />
multilayer sample taken at a magnetic field of H = 550 mT which was sufficient to saturate<br />
the sample even at T = 27 K. For low temperatures a splitting between both spin channels<br />
due to the ferromagnetic (FM) contribution from the disordered FePt 3 layers can be clearly<br />
observed. Moreover, the small but clearly visible oscillations can be attributed to the multilayer<br />
structure, where the FM contributions of disordered (FM) FePt 3 layers delivers enough<br />
contrast in the scattering length densities between the layers of different chemical order. As<br />
the temperature is increased the splitting between the reflectivities of the spin up and down<br />
channel decreases indicating that the FM moments also decreases. By fitting the reflectivity<br />
curves using the PARRATT program only the magnetic scattering length density of the disordered<br />
FePt 3 was varied for the different polarization channels and temperatures allowing<br />
to extract the FM magnetic contribution of these layers. For reasonable fits it turns out that<br />
176
the interfacial roughnesses between the layers has to be assumed quite large of the order of<br />
50–80 Å. This is probably owed to the fabrication process and the in-situ cooling and heating<br />
process. Fig. 3 shows the extracted FM magnetic moment of the disordered FePt 3 layers<br />
assuming that the magnetization is homogeneous distributed throughout the layer. It clearly<br />
indicates the steady increase of the magnetic moment with decreasing temperature. In comparison<br />
to earlier results on the FePt 3 /CoPt 3 multilayer in [3] and the bulk values, the T c of the<br />
disordered FePt 3 is significant lower.<br />
intensity [arb. units]<br />
10 0 Spin up<br />
10<br />
Spin down<br />
-2<br />
10 -4<br />
T=27K<br />
T=75K<br />
10 -6<br />
10 -8<br />
10 -10<br />
10 -12<br />
10 -14<br />
10 -16<br />
T=125K<br />
T=175K<br />
T=225K<br />
T=275K<br />
0.01 0.02 0.03 0.04 0.05 0.06 0.07<br />
Q z<br />
[Å -1 ]<br />
Figure 2: Polarized neutron reflectivity taken at an<br />
applied magnetic field of H = 550 mT along the<br />
sample plane. Circles indicate the experimental<br />
data, lines are fits to the data by PARRATT.<br />
Magnetization [emu/cm 3 ]<br />
450<br />
400<br />
350<br />
300<br />
250<br />
200<br />
150<br />
100<br />
50<br />
0<br />
0 50 100 150 200 250 300<br />
Temperature [K]<br />
Figure 3: Magnetization of the disordered<br />
FePt 3 layers extracted from the PARRATT<br />
simulation and the differences in the scattering<br />
length densities for both polarization<br />
channels assuming an homogenous magnetization<br />
throughout the layers.<br />
Magnetization measurements confirms an exchange bias effect of the FePt 3 multilayer studied<br />
here, but it is with H E = 5.8 mT at T = 5 K quite weak. In a next step FePt 3 multilayers<br />
grown on MgO will examined in the same way as this multilayer here on Al 2 O 3 . Very recently<br />
carried out SQUID measurements showed an exchange bias effect of about eight times larger<br />
as for the sample on Al 2 O 3. It indicates that the substrate has an important influence on<br />
the magnetization properties of this system and will be studied in more detail in the future.<br />
References<br />
[1] G.E. Bacon and J. Crangle, Proc. R. Soc. London, Ser. A 272, 387 (1963).<br />
[2] D. Palaith et al., Phys. Rev. 178, 795 (1969).<br />
[3] D. Lott et al. PRB 77 (2008), 132404<br />
177
178
EXPERIMENTAL REPORT<br />
GeNF<br />
NeRo<br />
Coupling of the Fe and Cr layers in Fe/Cr multilayer examined by polarized<br />
neutron reflectivity studies<br />
Proposer:<br />
Co-Proposer(s):<br />
Experimental Team:<br />
User Group Leader:<br />
Instrument Scientist:<br />
Dieter Lott 1 , 1 GKSS Research Centre <strong>Geesthacht</strong>, Germany<br />
Dieter Lott 1 , Ursula Tietze 1<br />
Andreas Schreyer 1<br />
Dieter Lott 1<br />
Date(s) of Experiment: 13 th – 23 rd September 2008<br />
Objectives<br />
Magnetic thin film research has been one of the most exciting and innovative fields in<br />
magnetism over the last 20 years. Fe/Cr multilayers have played an important role in the field<br />
as many of the important effects, like antiferromagnetic exchange coupling between the<br />
ferromagnetic layers [1], the giant magnetoresistance effect [2], and non-collinear coupling<br />
[3], were discovered using this system. Recently, the influence of the insertion of a<br />
monolayer Sn in Cr on the Spin Density Wave (SDW) of Cr in Fe/Cr multilayers was<br />
examined by neutron diffraction measurement showing drastic changes in the diffraction<br />
pattern for the sample with and without Sn [4]. Further analysis of the data reveals that the<br />
insertion of Sn not only pins the antinodes of the SDW in the Cr layers but also increases its<br />
coherence length throughout the multilayer. Here, additional polarized neutron reflectivity<br />
studies were proposed to examine the magnetization of the Fe layers in respect to the<br />
configuration of the SDW of the Cr layers. In a first step, the multilayer without Sn insertion<br />
was examined.<br />
Sample<br />
The Fe(10 Å)/Cr(80 Å) multilayer with 60 repeats were grown on MgO(001) at 200 C using<br />
electron beam epitaxy. The sample was characterized by x-ray reflectivity and diffraction at<br />
GKSS. The sample show good epitaxy of Cr in the (001) direction and interface r.m.s. roughnesses<br />
between 6 Å and 8 Å. The neutron diffraction scans indicate clearly a transition from<br />
the incommensurate SDW (ISDW) at low temperature to a commensurate phase (CSDW) at<br />
around room temperature. However, the onset of the commensurate phase is already<br />
detected between 200 K and 250 K suggesting a coexistence of both phases around this<br />
temperature range. Polarized neutron diffraction studies show a reorientation of the Cr spins<br />
perpendicular to the applied magnetic field occurring at around the same temperature<br />
regime.<br />
Experimental Technique<br />
The polarized reflectivity studies with polarization analysis were carried out at the NeRo<br />
reflectometer at GKSS at a wavelength of = 4.34 Å with / = 0.02 and an incident<br />
polarization of P o = 0.97.5. Four cross section were measured, R ++ , R -- , R +- and R -+ . Here, the<br />
first sign represents the incident polarization and the second the polarization of the detected<br />
signal, where + and – denoted the spin up and spin down state of the neutrons. In the Non-<br />
Spin-Flip (NSF) channels (R ++ , R -- ) the magnetization along and opposite to the applied guide<br />
179
field (in the sample plane and perpendicular to the momentum transfer vector Q z ) can be<br />
analyzed. The difference in both channels indicates a non-zero net magnetization along that<br />
direction. The Spin Flip (SF) channels (R +- , R -+ ) are sensitive to the magnetic moments<br />
perpendicular to the guide field direction but still perpendicular to Q z . The scans were made<br />
for several temperatures and magnetic field. At each temperature the sample was saturated<br />
at high negative magnetic fields before the measurements. The reflectivity scans were then<br />
taken subsequently from lower to higher a magnetic field that was applied along the sample<br />
plane and perpendicular to Q z .<br />
10 6 H = 6.9 mT<br />
T = 150 K<br />
10 5<br />
10 4<br />
10 6 - +<br />
- -<br />
10 5<br />
+ +<br />
+ -<br />
10 4<br />
H = 70 mT<br />
T = 150 K<br />
10 3<br />
10 3<br />
10 2<br />
10 2<br />
10 1<br />
10 1<br />
10 0<br />
0.00 0.05 0.10 0.15<br />
10 0<br />
0.00 0.05 0.10 0.15<br />
intensity [arb. units]<br />
10 6<br />
10 5<br />
10 4<br />
10 3<br />
10 2<br />
10 1<br />
H = 6.9 mT<br />
T = 250 K<br />
10 6 - +<br />
- -<br />
10 5<br />
+ +<br />
+ -<br />
10 4<br />
10 3<br />
10 2<br />
10 1<br />
H = 70 mT<br />
T = 250 K<br />
10 0<br />
0.00 0.05 0.10 0.15<br />
10 0<br />
0.00 0.05 0.10 0.15<br />
10 6 - +<br />
- -<br />
10 5<br />
+ +<br />
+ -<br />
10 4<br />
H = 6.9 mT<br />
T = 325 K<br />
10 6 - +<br />
- -<br />
10 5<br />
+ +<br />
+ -<br />
10 4<br />
H = 70 mT<br />
T = 325 K<br />
10 3<br />
10 3<br />
10 2<br />
10 2<br />
10 1<br />
10 1<br />
10 0<br />
0.00 0.05 0.10 0.15<br />
Q z<br />
[A -1 ]<br />
10 0<br />
0.00 0.05 0.10 0.15<br />
Q z<br />
[A -1 ]<br />
Figure 1: Polarized neutron reflectivity with polarization analysis on 60x[Fe 10Å /Cr 80Å ] on MgO for selected<br />
magnetic field (6.9 mT and 70 mT) and temperature (150 K, 250 K, 325 K). Signs + and – indicates<br />
the polarization of the neutron with up and down, respectively, where the first sign is for the<br />
incident and the second for the detected neutrons.<br />
180
Achievements and Main Results<br />
Figure 1 shows the polarized reflectivity curves for three different temperatures of T = 150 K,<br />
250 K and 325 K and each of them at two magnetic fields applied along the sample plane, at<br />
a low and larger field of H = 6.9 mT and H = 70 mT, respectively. The curves were corrected<br />
for background noise and illumination. At the larger field all curves show a very similar<br />
behavior with a large splitting in the NSF channels indicating that the Fe layers are collinear<br />
aligned along the magnetic field direction. The low intensity in the SF channels is mainly due<br />
to the imperfect neutron polarization (P 0
step the same studies will be carried out at other Fe/Cr multilayers with and without Sn<br />
insertion in the Cr layers. As pointed out before, the SDW behavior changes drastically with<br />
the insertion of Sn. Combined with polarized neutron reflectivity studies it will be possible to<br />
identify the influence of the Sn and the observed changes in the SDW in the Cr layers on the<br />
coupling between the Fe and Cr layers a their interfaces.<br />
References<br />
[1] P. Grünberg et al., Phys. Rev. Lett. 57, 2442 (1986).<br />
[2] M.N. Baibich et al., PRL 61, 2472 (1988);<br />
G. Binasch et al., Phys. Rev. B 39, 4828 (1989).<br />
[3] M. Rührig et al., Phys. Stat. Sol. (a) 125, 635 (1991).<br />
[4] D. Lott et al., Physica B 350 (2004) e245–e248<br />
[5] A. Schreyer et al., Phys. Rev. Lett. 79, 4914 (1997).<br />
182
EXPERIMENTAL REPORT<br />
GeNF<br />
NeRo<br />
Magnetic field – Temperature phase diagram of the Dy/Y multilayer system<br />
Proposer:<br />
Co-Proposers:<br />
Yury Chetverikov 1 , 1 PNPI, Gatchina, St-Petersburg, Russia<br />
Sergey Grigoriev 1 ,<br />
Experimental Team:<br />
User Group Leader:<br />
Instrument Scientist:<br />
Date(s) of Experiment: 16 th – 24 th May 2008<br />
Yury Chetverikov 1 ,<br />
Dieter Lott 2 , 2 GKSS Research Centre <strong>Geesthacht</strong>, Germany<br />
Sergey Grigoriev 1<br />
Dieter Lott 2<br />
Objectives<br />
The experiment was aimed to investigate the temperature-magnetic field transformation of<br />
the spin structure in the Dy/Y multilayer sample in the critical and intermediate temperature<br />
range by the polarized neutron reflectometry. The use of the wide angle NeRo reflectometer<br />
allowed us to compare magnetic and superstructure nuclear contributions to the scattering<br />
and to obtain information about the spin orientation.<br />
The first wave of interest in studying the rare earth magnetism began with the discovery that<br />
3D long range incommensurate spin order occurs in rare-earth/yttrium superlattice (SL)<br />
structures [1, 2]. Two important effects were found in Y/Dy system: (i) propagation of helimagnetic<br />
order through nonmagnetic Y layers as thick as 100 Angstroms and (ii) coherency<br />
stain and clamping to the substrate caused by the epitaxial containment suppress completely<br />
the low temperature ferromagnetic phase of dysprosium. A new impulse in the rare earth SL<br />
investigation was stimulated by observation of effects which caused by magneticnonmagnetic<br />
interfaces, such as enhanced interfacial magnetic order [3], twisted magnetization<br />
states [4], and surface Dzyaloshinskii-Moria (DM) interaction [5].<br />
Sample<br />
The sample is a superlattice of the layer sequence Y 50 nm [Dy 3 nm /Y 3 nm ] 150 /Y 234 nm /Nb 200 nm Sapphire<br />
(substrate) (noted below as DY30 sample), which was grown along the c-axis of the<br />
hcp-structure of Dy and Y, the same as used in [1]. The anisotropy of the crystal fixes the<br />
direction of the magnetic spirals k along the c axes. In this Y/Dy superlattice, a coherent helical<br />
phase occurs at T
the spin quantization axis x (x z). Here r (Q) are the complex amplitudes of reflections that<br />
are related to distributions of nuclear and magnetic scattering potentials of the sample. This<br />
experimental technique allow one to define the magnetic induction vector distribution B(z) in<br />
a sample [6, 7]. In general case in order to establish B(z) distribution one has to use an adequate<br />
model. In some cases the model-free interpretation is possible due to certain features<br />
in R(Q) dependences. Thus, from the ratios of coefficients R ++ , R -- , R +- and R -+ one is able to<br />
determine three different types of density modulations: magnetic one (M), nuclear one (N)<br />
and interference between them (NM). For magnetic component these ratios allow one to<br />
characterize the magnetic modulations, which occur along the external field (spin flip) or<br />
transverse to it (spin flop), whereas from the interference component the average magnetization<br />
of the sample can be extracted.<br />
Achievements and Main Results<br />
The previous experiments revealed the transition from the incommensurate spin helix to the<br />
structure with modes, which commensurate to the superlattice period. The observed wave<br />
vectors of the multimode commensurate structures are q = 1.25 q SL ; q = 1.5 q SL ; q = 1.75 q SL ;<br />
and q = 2 q SL , where q SL is the superlattice wave vector. These transformations were observed<br />
for T = 130 K and 155 K when the magnetic field was applied in the layer plane.<br />
Close to T N , i.e. at T = 155 K, this phenomenon is better pronounced as compare to T well<br />
below T N , i.e. at T = 130 K. At the intermediate field values we observed simultaneously four<br />
modes at T = 155 K (q/q SL = 1.25; 1.5; 1.75; 2) while two modes only were detected at<br />
T = 130 K: the incommensurate helix and the one at q/q SL = 1.5. These differences in field<br />
induced transformations are correlated with changes of the chirality close to T N [5, 8].<br />
The given experiment aimed to continue the investigation of spin structure transformations in<br />
DY30 sample using neutron polarization analysis. Figure 1 and Figure 2 presents the reflectivity<br />
profiles for the polarized neutrons obtained from the sample DY30 at different values of<br />
the external magnetic field.<br />
(a) T=130K, H=860mT<br />
I(arb.units)<br />
I(arb.units)<br />
10 3 SL<br />
10 2<br />
10 1<br />
10 0<br />
10 3 SL<br />
10 2<br />
10 1<br />
M1<br />
0.00 0.05 0.10 0.15 0.20 0.25<br />
Q Z<br />
(1/A)<br />
M1<br />
M0<br />
M0<br />
- -<br />
+ -<br />
++<br />
(a)<br />
- -<br />
+ -<br />
++<br />
(b)<br />
0.00 0.05 0.10 0.15 0.20 0.25<br />
Q Z<br />
(1/A)<br />
Figure 1:<br />
Reflectivity curves from the DY30 superlattice<br />
obtained in a small field H = 10 mT at<br />
T = 130 K (a) and T = 155 K (b).<br />
184<br />
I(arb.units)<br />
I(arb.units)<br />
10 4 M1.5 M2 - -<br />
10 3<br />
10 2<br />
10 1<br />
10 0<br />
10 1<br />
10 0<br />
+ -<br />
++<br />
0.00 0.05 0.10 0.15 0.20 0.25<br />
Q Z<br />
(1/A)<br />
(b) T=155K, H=660mT<br />
10 4<br />
10 3<br />
10 2<br />
M1.75<br />
M1.25<br />
- -<br />
+ -<br />
++<br />
0.00 0.05 0.10 0.15 0.20 0.25<br />
Q Z<br />
(1/A)<br />
Figure 2:<br />
Reflectivity curves taken in “large” fields<br />
at T = 130 K (a) and T = 155K (b).
For a small field value of 10 mT intensities R ++ , R -- and R +- coincide practically in the q-range<br />
of magnetic peaks M0 and М1. On the contrary, the intensity R ++ coincides with R -- , but both<br />
differ from R +- in the range of superlattice peak SL. The condition R ++ = R -- = R +- = R -+ for two<br />
magnetic peaks evidences for the helicoidal nature of the magnetic structure. The condition<br />
R -- = R ++ in the SL peak range suggests the absence of a net sample magnetization. Small<br />
peak R +- in the SL peak range appears solely due to imperfection of the setup.<br />
The experimental picture for both observed temperatures changes dramatically in the range<br />
of large fields of 600–800 mT. Firstly, the non zero difference (R -- - R ++ ) appears in the SL<br />
peak range suggesting appearance of the net sample magnetization. Secondly, the magnetic<br />
“spin flip” (M2) and “spin flop” (M1.25, M1.5, M1.75) peaks appear instead of the helical<br />
peaks suggesting a decay of the spiral modulation. As it is well seen from Fig. 2, the “spin<br />
flip” peaks (M2) with R ++ = R -- are significantly stronger than the “spin flop” peaks with R +- but<br />
peaks (M2) have approximately the same intensity as R ++ or R -- components ( M0, M1) of<br />
helicoidal structure at the field of 10 mT (Fig. 1).<br />
Discussion<br />
Thus, we conclude that the magnetic field applied in the easy plane direction leads the degenerate<br />
incommensurate helimagnet to the non-degenerate ferromagnetic state. The transformation<br />
goes with appearance of the different commensurate phases in the intermediate<br />
field range. A similar phenomenon is observed in the physics of the incommensurate ferroelectrics<br />
[9,10]. Approaching the phase transition from an incommensurate continuously degenerate<br />
phase into the future (ferromagnetic) phase, the discretely degenerate state appears<br />
with the structure similar to domain structure but a width of domains is comparable<br />
with domain wall width [9]. As is well known, the domain walls are solitons and can be represented<br />
as nonlinear excitations, which are in the thermodynamic equilibrium with each other<br />
and with phonons [10]. Below the critical field they do not lead to any change of the structure.<br />
However, in case of “pinning” these solitons at the lattice inhomogeneities, the interaction<br />
between the solitons reduces and interaction with the linear excitations is dissipationless. As<br />
a result, the incommensurate structure becomes strongly distorted.<br />
Furthermore, we speculate that the commensurate modulations in DY30 are originated from<br />
the solitons pinned on the superlattice. One possible reason for the commensurate pinning is<br />
a nonuniform defect’s distribution, which depends on the depth in Dy layer [9]. The 1.6 %<br />
inconsistency between Dy and Y lattice parameters can lead to stresses closed to Dy-Y interfaces<br />
and to the formation of large amount of defects. Another reason of the pinning can be a<br />
periodicity of superlattice potential [11]. It is possible when a size of solitons is comparable<br />
with the SL period and a pinning energy is comparable to the energy of the solitons. The first<br />
condition can be fulfilled in the superlattice DY30 due to large period of SL (6 nm), whereas a<br />
typical size of the domain wall is 10–20 nm. The second condition is fulfilled because of a<br />
large difference between strong intralayer interaction energy inside the Dy layer and a weak<br />
interlayer interaction between Dy layers through the nonmagnetic Y. Thus, when a centre of<br />
domain wall is localised in Y stratum it gains some energy and the commensurate magnetic<br />
structure can be favourable.<br />
Finally, we would like to thank our local contacts Dr. Dieter Lott and Ursula Tietze for their<br />
excellent support.<br />
185
References<br />
[1] Ross W. Erwin, J.J. Rhyne, M.B. Salamon, J.Borchers, S. Sinha, R. Du, J.E. Cunningham,<br />
C.P. Flynn, Phys.Rev.B 35, 6808 (1987).<br />
[2] J.A. Borchers, M.B. Salamon, R.W. Erwin, J.J. Rhyne, R.R. Du, and C.P. Flynn, Phys. Rev. B 43,<br />
3123 (1991).<br />
[3] D. Haskel, G. Srajer, J.C. Lang, J. Pollmann, C.S. Nelson, J.S. Jiang, and S.D. Bader, Phys. Rev.<br />
Lett. 87, 207201 (2001).<br />
[4] Y. Choi, D. Haskel, A. Cady, J.C. Lang, D. R. Lee, G. Srajer, J.S. Jiang, and S. D. Bader,<br />
Phys.Rev.B 73, 174401 (2006)<br />
[5] S.V. Grigoriev, Yu.O. Chetverikov, D. Lott, and A. Schreyer Phys. Rev. Lett. 100, 197203 (2008)<br />
[6] S.V. Maleev, V.G. Bar’yakhtar, and R.A. Suris, Fiz. Tverdogo Tela 4 3461 (1962) [Sov. Phys.<br />
Solid State 4, 2533 (1962)].<br />
[7] M. Blume, Phys. Rev. 130, 1670 (1970).<br />
[8] S.V. Grigoriev, A.I. Okorokov, Yu.O. Chetverikov et al. JETP Letters vol. 83 No. 11, 478 (2006).<br />
[9] B.A. Strukov, A.P. Levanyuk, Ferroelectric Phenomena in Crystals: Physical Foundations, (1998)<br />
[10] J. A. Kramhansel, J. R. Schrieffer, Phys. Rev. B. 11, 3535 (1975)<br />
[11] E. B. Sonin, Uspekhi Fizicheskikh Nauk 137 2, 267 (1982)<br />
186
EXPERIMENTAL REPORT<br />
GeNF<br />
NeRo<br />
Proposer:<br />
Co-Proposers:<br />
Experimental Team:<br />
User Group Leader:<br />
Instrument Scientist:<br />
Field-induced chirality of the spiral spin structure<br />
in the [Dy (3nm) /Y (1.5nm) ] 150 multilayer system<br />
Yury Chetverikov 1 , 1 PNPI, Gatchina, St-Petersburg, Russia<br />
Sergey Grigoriev 1<br />
Yury Chetverikov 1 ,<br />
Dieter Lott 2 , 2 GKSS Research Centre <strong>Geesthacht</strong>, Germany<br />
Sergey Grigoriev 1<br />
Dieter Lott 2<br />
Date(s) of Experiment: 27 th November – 7 th Dezember 2008<br />
Objectives<br />
Our previous measurements with polarized neutrons on [Dy 4.2 nm /Y 2.8 nm ] 350 ( denoted as S1)<br />
demonstrated that Dy/Y multilayer structures posses a coherent spin helix with a preferable<br />
chirality induced by the magnetic field [1]. The average chirality, being proportional to the<br />
difference in the left- and right-handed helix population numbers, was measured as a<br />
polarization-dependent asymmetric part of the magnetic neutron scattering . It is introduced<br />
as a measure of the chirality = (I(+P)-I(-P))/(I(+P)+I(-P)), where I(+P) and I(-P) are the<br />
scattering intensities with the polarization along I(+P) and opposite I(-P) the magnetic field. It<br />
was shown that the magnetic field applied in the plane of the sample upon cooling below T N<br />
is able to repopulate the otherwise equal population numbers for the left- and right-handed<br />
helixes. The experimental results indicate strongly that the chirality is caused by<br />
Dzialoshinskii-Moriya interaction due to the lack of the symmetry inversion on the interfaces.<br />
Moreover, the similar study of another multilayer system Y 50 nm [Dy 3.0 nm /Y 3.0 nm ] 150 /Y 234 nm /Nb 200 nm<br />
Saphire(substrate) (denoted as S2) have shown the very similar magnetic field effect [2].<br />
Some conclusions on the nature of this phenomenon have been made considering the fieldinduced<br />
chirality as an experimental evidence for Dzialoshinskii-Moriya interaction on the<br />
interfaces [1, 2]. However, the detailed mechanism for the coupling of the applied field to the<br />
handedness of the spin spiral has not been understood.<br />
At present we study the magnetic-field effect on the helix spin structure of the multilayer system<br />
[Dy 3.0 nm /Y 1.5 nm ] 150 ( denoted as S3) by means of the small angle diffraction in a wide<br />
temperature range. The experiment is aimed to conduct the comparison of the three samples<br />
S1, S2 and S3. Two of them (S1 and S2) are of the same thickness of Y layer but different<br />
thickness of the Dy layer. The other two samples (S2 and S3) are of the same thickness of<br />
Dy layer but different thickness of the Y layer.<br />
Sample<br />
The sample is a superlattice of the layer sequence<br />
Y 50 nm [Dy 3.0 nm /Y 1.5 nm ] 150 /Y 234 nm /Nb 200 nm Al 2 O 3 (substrate), which was grown along the c-axis of<br />
the hcp-structure of Dy and Y, the same as used in [1, 2]. The anisotropy of the crystal fixes<br />
the direction of the magnetic spirals k along the c axes. In this Y/Dy superlattice, a coherent<br />
helical phase occurs at T
Experimental Technique<br />
The experiments were carried out at the NeRo reflectometer of FRG-1 research reactor in<br />
<strong>Geesthacht</strong> (Germany). A polarized beam of neutrons with an initial polarization of P 0 = 0.975,<br />
the neutron wavelength = 4.34 Å (/ = 0.02) was used. The scattered neutrons were<br />
detected by a position sensitive detector (PSD) with (256 x 256) pixels. The multilayer<br />
sample was oriented in such a way that the c-axis was set almost perpendicular to the incident<br />
beam. This geometry allows one to observe neutron diffraction peak from incommensurate<br />
helix structure. The polarization followed the direction of the guide magnetic field of order of<br />
1 mT, which was applied perpendicularly to the incident beam and perpendicularly to<br />
multilayer surface (along c-axis). The additional magnetic field H from 10 to 900 mT could be<br />
applied, when necessary, perpendicularly to the incident beam and parallel to multilayer<br />
surface. The scattering intensity was measured in the temperature range from T = 100 to<br />
T = 200 K for two incident polarizations I(P 0 ) along and opposite of the guiding magnetic<br />
field. The use of polarized neutrons allows one to compare magnetic and superstructure nuclear<br />
contributions to the scattering; to obtain information about spin orientation in the system,<br />
and to extract polarization-dependent chiral contribution to the scattering cross section.<br />
Achievements and Main Results<br />
The typical reflectivity curves from the Dy/Y superlattice (S3) taken at T = 140 K (below<br />
T N = 155 K) is shown in Fig. 1. Closest to Q Z = 0 is the nuclear peak with q N = 1.35 nm -1 (NP)<br />
originated from the multilayer structure with the period equaled to the thickness of the bilayer<br />
d = d Dy +d Y = 4.5 nm. Neither position of this peak nor its intensity change over the whole<br />
range of the measured temperatures, giving the evidence of its nuclear (nonmagnetic) nature.<br />
Additionally, the polarization analysis I +- shows its non magnetic nature as well. The<br />
peaks at higher q values, denoted as M0 and M1, respectively, and positioned at q M1 = 1.64 nm -1<br />
and q M0 = 2.95 nm -1 , originate from the scattering on the spin helix and appear below 155 K.<br />
intensity [arb. units]<br />
10 5 - -<br />
H=0mT<br />
+ -<br />
10 T=140K<br />
4<br />
+ +<br />
10 3<br />
10 2<br />
10 1<br />
NP<br />
M1<br />
M0<br />
integrated intensity [arb. units]<br />
10 5<br />
10 4<br />
10 3<br />
ZFC data<br />
after FC data<br />
10 0<br />
0.00 0.05 0.10 0.15 0.20 0.25 0.30 0.35<br />
Q z<br />
[A -1 ]<br />
Figure 1: Reflectivity curves from the Dy/Y<br />
superlattice (S3) taken at T = 140 K and at<br />
H = 0.<br />
10 2<br />
100 110 120 130 140 150 160<br />
T [K]<br />
Figure 2: Temperature dependence of the<br />
intensity of the magnetic peak M0 at H = 0<br />
in the ZFC measurements and in the ZF<br />
warming regime after FC at H = 628 mT.<br />
The co-existence of several magnetic peaks is a consequence of the modulation imposed by<br />
the nuclear multilayer structure on the spiral structure. Due to this modulation the magnetic<br />
peaks are separated by the value of (q M0 - q M1 ) ~ q N = 1.35 nm -1 . The presence of clearly visible<br />
and well-separated peaks can be also interpreted in term of the long-range correlation of the<br />
magnetic helix propagating through several bilayers.<br />
The intensity of the magnetic peak M0 integrated over the rocking scan increases with decreasing<br />
temperature (Fig. 2). The two curves for the zero Field Cooling (ZFC) regime and<br />
for the ZF warming regimes after FC are practically coincided. The rocking scans of the<br />
188
Bragg peak were taken at different temperatures after the ZFC and FC regimes at different<br />
values of the magnetic field. After FC at H = 828 mT to T = 100 K the intensity at H = 0 is<br />
shown in Fig. 3 as a function of the refelctivity angle for two incident polarizations I(P 0 ).<br />
The chirality is also plotted in the same Fig. 3. For our experiment the scattering intensity<br />
with a certain polarization is related to the only one of two types of the helix domains: left- or<br />
right- handed ones. The rocking scans, shown in Fig. 3, gives an example of the non-zero<br />
difference between two scattering intensities of the opposite polarizations I(+P 0 ) and I(-P 0 ).<br />
The scans demonstrate the existence of the non zero average chirality in the sample i.e. the<br />
non equal population of the left- and right- handed domains.<br />
intensity [arb. units]<br />
6000<br />
5000<br />
4000<br />
3000<br />
2000<br />
1000<br />
0<br />
-1000<br />
-2000<br />
-3000<br />
5.0 5.2 5.4 5.6 5.8 6.0 6.2<br />
FC (826 mT)<br />
T=100 K<br />
I +<br />
I -<br />
<br />
5.0 5.2 5.4 5.6 5.8 6.0 6.2<br />
[deg]<br />
2.0<br />
1.8<br />
1.6<br />
1.4<br />
1.2<br />
1.0<br />
0.8<br />
0.6<br />
0.4<br />
0.2<br />
0.0<br />
-0.2<br />
-0.4<br />
Figure 3: Intensity as a function of the reflectivity<br />
angle for two incident polarizations I(P 0 ) for<br />
H = 0 after FC at H = 828 mT to T = 100 K.<br />
<br />
0.2<br />
0.0<br />
-0.2<br />
-0.4<br />
-0.6<br />
-0.8<br />
Without BG correction<br />
With BG correction<br />
100 110 120 130 140 150 160<br />
T (K)<br />
Figure 4: Temperature dependence of chirality<br />
after the FC procedure at H = 826 mT to the<br />
temperature of interest T.<br />
Fig. 4 shows the value of for different temperature- and magnetic-field treatment. In order to<br />
study the effect of the in-plane field on the chirality, the sample, first, was cooled from T > T N<br />
to T < T N in the in-plane field, then the in-plane field was switched off and the value was<br />
measured in the small guide field ( H g || P 0 || k). As shown in Fig. 4, such a FC procedure at<br />
H = 826 mT to the temperatures below 145 K gives the positive chirality . For FC procedure<br />
to T above 145 K, the chirality becomes negative. After the background correction it becomes<br />
clear that the chirality tends to -1 as temperature of the measurements approaches<br />
T N . The similar behavior of is observed for the measurements after FC (H = 826 mT) to 110 K<br />
with the subsequent warming up in zero field (Fig.5). It should be noted that for Zero Field<br />
Cooling (ZFC) is negative and equal to -0.02 for the whole temperature range below T N .<br />
0.25 ZF warming after FC<br />
0.20<br />
0.15<br />
0.10<br />
<br />
0.05<br />
Figure 5: Temperature dependence of for the<br />
measurements after FC (H = 826 mT) to 110 K<br />
with the subsequent warming up in zero field.<br />
0.00<br />
-0.05<br />
110 120 130 140 150 160<br />
T (K)<br />
Furthermore, the value depends on the strength of the magnetic field applied in the sample<br />
plane (ab) in the FC procedure but it does not depend on the direction (±H FC ) of the field.<br />
Figure 6 gives as a function of the field taken at T = 130 K. The chiral parameter changes<br />
its sign from plus at small fields to minus at the middle fields to plus again at large fields as<br />
the field increases.<br />
189
0.2<br />
0.0<br />
Figure 6:<br />
Magnetic field dependence of chirality <br />
after the FC procedure at H = 826 mT to<br />
the temperature T = 130 K.<br />
<br />
-0.2<br />
-0.4<br />
after FC (T=130K)<br />
0 200 400 600 800<br />
m<br />
Comparing the behavior of chirality for the Sample 3 (under study) and Sample 2 [2] one<br />
concludes they are very similar. Particularly, the change of the chirality with temperature from<br />
positive at low temperature to the negative close to T N is the same for these two samples.<br />
The chirality changes its sign as a function of the field for these two samples. Such a behavior<br />
is attributed to the certain thickness of the Dy layer and it seems that the thickness of Y<br />
does not play a role in the peculiarities of the chiral behavior of these samples. This is also<br />
confirmed by the comparison of the samples S2 and S3 with the S1. The chiral behavior<br />
changes strongly when the thickness of Dy increases from 3.0 nm to 4.3 nm.<br />
In conclusion, we speculate that the spin chirality is caused by Dzyaloshinskii-Moriya (DM)<br />
interaction, which steam from the non inverse exchange coupling closed to the magneticnonmagnetic<br />
interfaces [3]. Although the exact mechanism leading to these phenomena is<br />
not clarified yet, we suggest that the field induced chirality of the Dy/Y multilayers can be<br />
interpreted as an effect of the DM interaction arising from the interfaces of the multilayer<br />
structure [1].<br />
References<br />
[1] S.V. Grigoriev, Yu. O. Chetverikov, D. Lott, A. Schreyer, Phys. Rev. Lett, 100 (2008) 197203<br />
[2] GKSS Report 2007/6, GKSS-Forschungszentrum <strong>Geesthacht</strong> GmbH, <strong>Geesthacht</strong> (2007) p.151<br />
[3] M. Bode, M. Heide, K. von Bergmann, P. Ferriani, S. Heinze, G. Bihlmayer, A. Kubetzka,<br />
O. Pietzsch, S. Blugel, R. Wiesendanger, Nature 447 (2007) 05802.<br />
190
EXPERIMENTAL REPORT<br />
GeNF<br />
NeRo<br />
Variation of lipid layer thickness and adhesion of protein depending of time of<br />
exposition in water and growth medium<br />
Proposer:<br />
Co-Proposer(s):<br />
Regine Willumeit 1 , 1 GKSS Research Centre <strong>Geesthacht</strong>, Germany<br />
Vasyl Haramus 1<br />
Experimental Team:<br />
Head of Institute:<br />
Instrument Responsible:<br />
Date(s) of Experiment: 20 th – 23 rd October 2008<br />
Frank Feyerabend 1 , Anna Schuster 1 , Sebastian Linser 1<br />
Andreas Schreyer 1<br />
Dieter Lott 1<br />
Objective<br />
Permanent implants such as metallic hip prostheses are widely used and successfully implemented<br />
in medicine. The efforts are manifold to develop new implant surface modifications<br />
which may prolong the life span of an implant, or shorten the recovery time of a patient<br />
by quicker and more stable implant incorporation. In our group we chose the approach to<br />
coat an implant by a cell membrane mimic. Cell membranes consist of approximately 60 %<br />
proteins and 40 % lipids. The importance of proteins is widely accepted, while the role of lipid<br />
layers is not fully acknowledged. In several studies we showed as a proof of principle that<br />
even a simple model phospholipid membrane system can significantly influence the cell behaviour<br />
on metallic biomaterials [1, 2].<br />
Our lipids coatings are so far not covalently linked to the surface because the preparation is<br />
based on the self assembly of multilamellar lipid layers by evaporation of a solvent. From the<br />
cellular reaction we can judge that a lipid film must be present even after expose to water or<br />
growth medium. This was confirmed by the first reflectometer measurements. However, the<br />
structure of this film and its remodelling under water conditions as well as the conformation of<br />
protein layers adhering from the growth medium is still unknown and subject of this proposal.<br />
Experiment<br />
Titanium alloy (Ti6Al7Nb) was deposited on the silicon substrates by sputter deposition with<br />
a layer thickness around 100 nm. Phospholipid coating was done with the phospholipid 1-<br />
palmitoyl-2-oleoyl-sn-glycero-3-phospho-ethanolamine (POPE). POPE (1 mM, 7.8 mg/mL)<br />
was solved in chloroform:methanol (80:20) and deposited 200 L to the substrate approximately<br />
1 cm 2 . Afterwards the solvent was evaporated at room temperature in air for 2 hours<br />
and sample has been incubated in growth medium for 3 h. Sample has been measured after<br />
drying.<br />
Achievements and Main Results<br />
Measurements showed that the metal layer deposited on a silicon wafer was 100–110 nm<br />
thick. A small oxide layer (5-6 nm) was found on top. Deposition of lipid bilayers from a chloroform-methanol<br />
solution (evaporation time 30 min) gave only small changes in the reflectivity<br />
curves and was modelled with lipid multilayers consisting of 40–50 bilayers of POPE with<br />
a bilayer thickness of 5.5 nm and a significant roughness of 2 nm. The total thickness of the<br />
POPE multilayers is 200–250 nm which is significantly less than expected from deposited<br />
quantity of lipid in solution which should give ~ 1000 nm. Our interpretation is that the largest<br />
191
portion of the lipid has not yet ordered completely in well structured lipid bilayers and does<br />
not contribute to reflectivity scattering.<br />
Measurements for a sample incubated in growth medium have shown the formation of an<br />
additional layer of substances precipitating on POPE multilayers. The main difference is<br />
observed at lowest q range (Fig. 1). Modelling of data suggests that protein layer is quite thin<br />
around 5 nm.<br />
Intensity, arb. units<br />
10<br />
1<br />
0,1<br />
0,01<br />
1E-3<br />
1E-4<br />
1E-5<br />
Figure 1:<br />
Comparison of reflectivity data for<br />
lipid multilayers and growth medium<br />
(red squares).<br />
1E-6<br />
1E-7<br />
0,01 0,1<br />
Q z<br />
, Å -1<br />
References<br />
[1] D. Pressl, C. Teichert, G. Hlawacek, H. Clemens, P.Iliev, A. Schuster, F. Feyerabend,<br />
R. Willumeit: AFM Roughness and Phase Image Study of Solid-Supported Phospholipid<br />
Membrane Systems on Ti-6Al-4V and Ti-6Al-7Nb. AEM 10(10) (2008) B47-B52;<br />
[2] A. Schuster, R. Ramchal, P. Iliev, F. Feyerabend, D. Lott, , R. Willumeit, K. Richau, M. Schossig,<br />
B. Finke: A covalent phospholipid-based surface coating for titanium implant materials. Biomaterialien<br />
9 (3/4) (2008) 195)<br />
192
EXPERIMENTAL REPORT<br />
GeNF<br />
NeRo<br />
Diffuse neutron scattering analysis on a Ni nanowire sample<br />
Principal Proposer:<br />
Co-Proposer(s):<br />
Experimental Team:<br />
User Group Leader:<br />
Instrument Responsible:<br />
W. Kreuzpaintner 1 , Dieter Lott 1<br />
1 GKSS Research Centre <strong>Geesthacht</strong>, Germany<br />
W. Kreuzpaintner 1 , Dieter Lott 1<br />
Andreas Schreyer 1<br />
Dieter Lott 1<br />
Date(s) of Experiment: 20 th November 2008<br />
Introduction<br />
Preparation and characterization of laterally structured samples is of great importance for<br />
proposed inelastic neutron scattering analysis of standing spinwaves in magnetic<br />
nanostructures.<br />
Here we report on diffuse polarized and unpolarized neutron scattering investigations which –<br />
complementary to the results gained by x-ray, SEM, AFM/MFM and VSM methods –<br />
addresses the structural and magnetic properties of a laterally structured Ni nanowire sample<br />
as a preparatory experiment for inelastic analysis.<br />
Experimental<br />
For the experiment an 1” in diameter large and (by the above methods) pre-characterized<br />
thin ploycrystalline, laterally structured Ni nanowire sample was used. The Ni nanowire<br />
structures have a cross section of approx. 10 nm x 10 nm at a spacing of 750 nm arranged<br />
parallel over the full distance of 2.5 cm. The sample is capped with 10 nm of Al as protective<br />
coating. An AFM/MFM micrograph is shown in figure 1.<br />
Measurements were performed at room temperature for the as-prepared Ni sample with an<br />
applied external field of 70 mT at a neutron wavelength of 4.34 Ǻ. The sample was arranged<br />
such that the nanowires were perpendicular to the plane of incidence and magnetized along<br />
their axis (Damon-Eshbach geometry). The intensities were mapped by means of rocking<br />
scans in the range of Q z = 0.00 Ǻ -1 to 0.10 Ǻ -1 and Q x = -3.5 x 10 -3 Ǻ -1 to Q x = +2.0 x 10 -3 Ǻ -1 ,<br />
respectively (the sign gives only the direction). In order to investigate the magnetism of the Ni<br />
nanowires in the specularly and off-specularly scattered intensities, two reciprocal space<br />
maps were collected using both neutron polarization states.<br />
Results and discussion<br />
The collected data is presented in figure 2 together with a difference plot for spin-up and<br />
spin-down intensities. Most of the off-specularly scattered intensities lie in regions of the<br />
reciprocal space for which the scattered neutrons need to penetrate the sample and, hence,<br />
in regions of the reciprocal space that are not accessible by e.g. x-ray methods. The difference<br />
plot for both spin-directions shows a clear magnetic effect which is a superb result for<br />
this sample with a weak magnetic behaviour and only 2 % of surface coverage with a total Ni<br />
nanowire scattering volume which is equivalent to that of an only 1.3 Ǻ thick continuous Ni layer.<br />
The results gained from the neutron measurements are outstanding and further analysis with<br />
polarized neutron scattering on NERO is proposed to not only obtain a qualitative, but also<br />
quantitative measure of the observed effect.<br />
193
Figure 1:<br />
AFM (left) and MFM (right) micrographs<br />
of the Ni nanowires in an inplane<br />
oriented magnetic field of 0 mT<br />
(A) and 80 mT (B). The bright/dark<br />
contrast of the MFM image (B) indicates<br />
the magnetic nature of the Ni<br />
nanowires. At zero field (A) the magnetic<br />
contrast is not visible.<br />
Figure 2:<br />
Reciprocal space maps as obtained by<br />
“rocking” scans using spin-down (top) and<br />
spin-up (center) neutrons shown together<br />
with the difference in the intensity distribution<br />
(bottom). The off-specular intensities<br />
at Q x = 8.4 x 10⁻⁴ Å -1 give the first order of<br />
lateral lattice spacing of the Ni nanowires<br />
in reciprocal space.<br />
194
EXPERIMENTAL REPORT<br />
GeNF<br />
ARES-2<br />
Diffractometer for the analysis of residual stresses ARES-2<br />
Short Instrument Description:<br />
Diffractometer for the analysis of residual stresses ('strain scanner') in specimens with technical<br />
sizes (up to approx. 200 kg) using thermal neutrons. Starting from the ground with a<br />
dance floor a completely new sample stage and detector mounting was installed in 2006,<br />
significantly improving the capability of handling large samples.<br />
Local Contact:<br />
Dr. Peter Staron<br />
Phone/Fax : +49 4152 87-1208 / +49 4152 87-1356<br />
E-mail: peter.staron@gkss.de<br />
Schematic View of ARES-2:<br />
Instrument Details:<br />
Location at FRG-1:<br />
beam line 7; thermal neutron guide (cross section<br />
42 × 90 mm 2 , supermirrors on top and bottom wall)<br />
Monochromator:<br />
elastically bent perfect Si monochromator,<br />
Si (311), double focussing<br />
Take-off angle:<br />
57° to 120°, continuously selectable<br />
Wavelength: = 0.16–0.23 nm (with Si 311)<br />
Flux at sample position: Φ 3·10 5 cm –2 s –1<br />
Sample movements:<br />
x, y, z (range 400 mm), <br />
Detector:<br />
3 He area detector (300 mm × 300 mm)<br />
Sample environment: Eulerian cradle (with x, y, z tables), load frame, furnace<br />
Software:<br />
PC programs for data reduction and analysis available<br />
195
196
EXPERIMENTAL REPORT<br />
GeNF<br />
ARES-2<br />
Residual stresses in a friction stir welded dissimilar Fe/Al butt joint<br />
Proposer:<br />
Co-Proposer(s):<br />
Experimental Team:<br />
User Group Leader:<br />
Instrument Responsible:<br />
J.F. dos Santos 1 , 1 GKSS Research Centre <strong>Geesthacht</strong>, Germany<br />
P. Staron 1<br />
N. Huber 1<br />
P. Staron 1<br />
Date(s) of Experiment: 11.03.–20.03.2008, 08.04.–10.04.2008<br />
Objectives<br />
Friction stir welding (FSW) is a modern tool for joining advanced Al alloys, e.g. in aircraft<br />
structures. Also FSW of steel is possible with adequate tools. Joining of Al alloys to steel is a<br />
critical issue, which has now also been tackled using FSW. Residual stresses are of special<br />
interest in such a joint of very different materials.<br />
Experiment<br />
A steel sheet made of plain steel S355J2G3 was friction stir welded to a sheet of an Al alloy<br />
(Fig. 1). The thickness of the steel sheet was 1.7 mm; the thickness of the Al sheet was<br />
1.5 mm. Strains were measured in three perpendicular directions. The Al (311) reflection and<br />
the (211) reflection of the steel phase were measured at a wavelength of 1.64 Å. The<br />
nominal size of the gauge volume was 1 mm × 1 mm × 30 mm. A cubic gauge volume of<br />
1 mm × 1 mm × 1 mm was used for longitudinal strains, but the gauge volume was moved in<br />
longitudinal direction during the measurement to cover approximately the same volume as<br />
for the other two directions and improve grain statistics. The sample was carefully adjusted to<br />
make sure that the centre of the gauge volume<br />
was always in the middle of the sheets.<br />
Achievements and Main Results<br />
Fig. 2 shows the strain distributions along a line<br />
perpendicular to the weld. It can be seen that the<br />
tensile peak strains in longitudinal direction are of<br />
the same magnitude in both materials. The strain<br />
zone is significantly wider on the Al side. Since the<br />
modulus of elasticity is much higher for steel, the<br />
tensile longitudinal residual stresses on the steel<br />
side are much higher than on the Al side.<br />
The edge of the steel sheet can be seen in the<br />
peak intensities (Fig. 3). An increase of the peak<br />
width in the steel part seems to indicate plastic<br />
deformation, while this is not the case in the Al part<br />
with a much lower recrystallisation temperature<br />
(Fig. 4).<br />
Figure 1: Al/Fe friction stir weld.<br />
197
Figure 2: Strain distribution across the weld line. x is the longitudinal direction.<br />
Figure 3: Peak intensities across the weld line in arbitrary units. Zero is in the middle of the stir zone.<br />
Figure 4: Peak width across the weld line.<br />
198
EXPERIMENTAL REPORT<br />
GeNF<br />
ARES-2<br />
Residual stresses in CT samples with a laser beam weld<br />
Proposer:<br />
Co-Proposer(s):<br />
Experimental Team:<br />
User Group Leader:<br />
Instrument Responsible:<br />
W.V. Vaidya 1 , 1 GKSS Research Centre <strong>Geesthacht</strong>, Germany<br />
P. Staron 1<br />
N. Huber 1<br />
P. Staron 1<br />
Date(s) of Experiment: 18.04.–30.04.2008, 18.09.–22.09.2008<br />
Objectives<br />
Laser beam welding (LBW) is an effective tool for joining advanced Al alloys in aircraft structures.<br />
However, significant residual stresses can be present in laser beam welds and the<br />
knowledge of their influence on fatigue properties is essential for construction of damage<br />
tolerant aircraft structures. In this work the crack propagation from a notch in CT samples<br />
parallel and perpendicular to the weld in the Al alloy AA6056 was studied. The influence of<br />
the stresses at the crack tip on the crack propagation rate was of special interest.<br />
Experiment<br />
CT samples with a size of 125 mm × 120 mm were prepared from laser beam butt-welded Al<br />
sheets of the alloy AA6056 in temper T6. The sheet thickness was 6 mm. Four samples were<br />
prepared with a notch perpendicular to the weld line with the notch tip at different distances<br />
from the weld line. For comparison, also a sample with the notch parallel to the weld line was<br />
produced (Fig. 1). Internal strains were measured in three perpendicular directions. The Al<br />
(311) reflection was used at a wavelength of 1.64 Å. The nominal size of the gauge volume<br />
was 3 mm × 3 mm × 3 mm. A plane stress<br />
state was assumed in the thin sheets for the<br />
evaluation of d 0 and stresses.<br />
Achievements and Main Results<br />
Fig. 2 shows one example of the stress distribution<br />
along a line perpendicular to the<br />
weld. In general, it shows the expected<br />
shape for such a weld. A first comparison<br />
with results of fatigue crack propagation<br />
tests on these samples showed that compressive<br />
stresses at the crack tip in the direction<br />
perpendicular to the notch direction<br />
( x in Fig. 2) can strongly retard the crack<br />
propagation. A more detailed analysis of the<br />
results is under work.<br />
Figure 1: CT sample with notch parallel to the weld.<br />
199
Figure 2: Stress distribution across the weld line. x is the longitudinal direction.<br />
The shaded region marks the position of the weld. The notch is perpendicular to the weld.<br />
200
EXPERIMENTAL REPORT<br />
GeNF<br />
ARES-2<br />
Residual stress in laser spot welded overlap joints of steel sheets<br />
Proposer:<br />
Co-Proposer(s):<br />
Experimental Team:<br />
User Group Leader:<br />
Instrument Responsible:<br />
S. Daneshpour 1 , 1 GKSS Research Centre <strong>Geesthacht</strong>, Germany<br />
M. Koçak 1<br />
P. Staron 1<br />
N. Huber 1<br />
P. Staron 1<br />
Date(s) of Experiment: 13.–16.05.2008, 20.–23.06.2008, 26.–30.09.2008<br />
Objectives<br />
Resistance Spot Welding (RSW) remains to be the most widely-used joining method in the<br />
automotive industry [1]. However, Laser Spot Welding (LSW) provides a flexible alternative<br />
to RSW with the benefits of low distortion due to a smaller heat-affected zone (HAZ), and<br />
requires only line-of-sight (with one side of the area to be welded) fabrication, allowing for<br />
access to more difficult-to-reach areas. Further advances, such as the remote welding<br />
method will allow even higher rates of throughout, which is of great importance when considering<br />
the high volumes and quantities of welds associated with automobile manufacture.<br />
Improved understanding of the fatigue behaviour, in connection with residual stresses, is an<br />
extremely important subject particularly for newly developed welding processes such as LSW<br />
[2, 3]. The present work aims to determine the effect of different laser spot weld shapes on<br />
the residual stress state in comparison with the residual stress state found in resistance spot<br />
welds. Simulation of the LSW process using the ABAQUS FE suite was conducted alongside<br />
the experimental analysis. Fatigue performance of the different laser spot weld path geometries<br />
will also be performed.<br />
Experiment<br />
All laser welds were made at GKSS using a 3.3 kW Nd:YAG laser. Deep-drawn DC04 steel<br />
with a sheet thickness of 2.0 mm was chosen due to its prevalent use in the automotive industry.<br />
All welds were made on overlap specimens. Two 40 mm wide sheets were joined<br />
with a 40 mm overlap by a single spot weld. Two examples of the welds, namely the 'ring<br />
weld' geometry (closed weld) and the 'Brezel' geometry (endpoints protected from external<br />
loads) are shown in Fig. 1.<br />
Residual strains were measured using the (211) reflection of the phase and a wavelength<br />
of 1.64 Å. The nominal size of the gauge volume was 1.5 mm × 1.5 mm × 1.5 mm. The grain<br />
size of the material proved to be small<br />
enough to ensure good grain statistics.<br />
The stress-free lattice parameter d 0 was<br />
determined by assuming a plane stress<br />
state in the thin sheets. The values E =<br />
225 GPa and = 0.28 were used for the<br />
evaluation for the (211) reflection of the<br />
iron α-phase.<br />
Figure 1: LSW 'ring weld' and 'Brezel' geometries.<br />
201
Achievements and Main Results<br />
In the comparison of the tangential residual stresses, LSW shows higher tensile residual<br />
stresses entire the weld ring than those found in the nugget of RSW (Fig. 2). The weld region<br />
in LSW is surrounded by a compressive region which is also larger in magnitude than that of<br />
the RSW.<br />
Good agreement is observed between experimental and simulated stress fields in both ringweld<br />
and Brezel-weld using a basic FE model with a conical Gaussian volume heat source<br />
(Fig. 3). Since typical plug-type failure of spot welds has occurred in the area directly around<br />
the exterior of the weld [3], deviation between the experimental and simulated results in<br />
these areas was considered acceptable.<br />
Figure 2:<br />
Comparison of tangential residual<br />
stresses in LSW and RSW specimens.<br />
Figure 3: Comparison of measured residual stresses and FE predictions for ring-weld (left) and<br />
Brezel-weld (right).<br />
References<br />
[1] M. Janota and H. Neumann, Welding in the World 52 (No. 3/4) (2008) 12–16.<br />
[2] S. Daneshpour, S. Riekehr, M. Koçak and C.H.J. Gerritsen, Sci. Technol. Weld. Joining (2008)<br />
DOI 10.1179/136217108X336298.<br />
[3] S. Daneshpour, S. Riekehr, M. Koçak, V. Ventzke and A.I. Koruk, Sci. Technol. Weld. Joining 12<br />
(2007) 508–515.<br />
202
EXPERIMENTAL REPORT<br />
GeNF<br />
ARES-2<br />
Residual stresses in a Mg alloy produced by high pressure die casting<br />
Proposer:<br />
Co-Proposer(s):<br />
Experimental Team:<br />
User Group Leader:<br />
Instrument Responsible:<br />
Su Xu 1 , 1 CANMET-Materials Technology Laboratory, Ottawa,<br />
Ontario, Canada, K1A 0G1<br />
P. Staron 2 , 2 GKSS Research Centre <strong>Geesthacht</strong>, Germany<br />
P. Staron 2<br />
Date(s) of Experiment: 17 th –19 th May 2008, 11 th –14 th November 2008<br />
Objectives<br />
Magnesium alloys have seen a recent increase in interest for their weight reduction potential<br />
for use in the automotive sector [1]. One interesting observation in Mg alloy creep is the<br />
creep asymmetry of randomly-textured cast Mg alloys, which manifests itself as significantly<br />
different creep rates during tensile and compressive loading. As the critical loading mode for<br />
Mg alloys in some high temperature automotive applications is compressive, characterization<br />
of creep under compression and study of the underlying mechanisms of the tensilecompressive<br />
creep asymmetry are of great interest. It has been shown that the hightemperature<br />
deformation behaviour of Mg alloys under tension is sometimes significantly<br />
different from that under compression [2, 3]. The mechanisms underlying the creep asymmetry<br />
are still not clear yet and are under investigation at CANMET-MTL. The objective of the<br />
proposed work is to quantitatively characterize residual stress in a rapidly solidified high<br />
pressure die casting (HPDC) sample, especially along the sample axis. This information may<br />
be used to understand and model the tensile-compressive yield and creep asymmetry.<br />
Experiment<br />
The samples for this study were cast through the<br />
high pressure die casting (HPDC) process. The<br />
samples were cast directly into the final dog-bone<br />
shape with a diameter of 6.3 mm. The HPDC die<br />
skin contains finer grains (~5 µm) than the interior<br />
of the samples (~14 µm). The compositional<br />
variations are expected to be small due to the<br />
rapid cooling. For the HPDC sample, die skin has<br />
a depth of ~300 µm.<br />
First, powder patterns were measured for two<br />
samples to see if there are significant differences<br />
between differently deformed tensile test samples<br />
(Fig. 1). Then, the lattice parameter was scanned<br />
along a diameter of an untested sample using the<br />
Mg (103) reflection at a wavelength of 1.64 Å. The<br />
nominal size of the gauge volume was 1 mm ×<br />
1 mm × 1 mm. Figure 1: Two dog-bone samples mounted<br />
for measurement of powder patterns.<br />
203
Achievements and Main Results<br />
There seem to be only small changes in the texture of the first two samples due to different<br />
deformation degrees (Fig. 2). The lattice parameter scan in the undeformed sample shows<br />
small more or less irregular variations along a diameter (Fig. 3). So, the as-produced dogbone<br />
shaped HDPC samples seem to be free of significant residual stresses. This information<br />
will help to define the initial parameters for the numerical simulation.<br />
Figure 2: Powder patterns of two deformed dog-bone samples.<br />
Figure 3: Lattice parameter of the (103) reflection along a diameter of a dog-bone sample.<br />
References<br />
[1] R.J. Osborne, G.S. Cole, B.M. Cox, D.E. Penrod, USCAR Project on Magnesium Structural Castings,<br />
Proc. IMA 2000 Magnesium Conf., Vancouver, BC, Canada, May 21–23, 2002, IMA, pp. 1–5.<br />
[2] S.R. Agnew, S. Viswanathan, E.A. Payzant, Q. Han, K.C. Liu, E.A. Kenik, Tensile and Compressive<br />
Creep Behaviour of Magnesium Die Casting Alloys Containing Aluminium, Proc. Conf. on Magnesium<br />
Alloys and their Applications, ed. K.U. Kainer, Munich, Germany, Sept. 26–28, 2000, pp. 687–692.<br />
[3] S. Xu, M.A. Gharghouri, and M. Sahoo, Tensile-Compressive Creep Asymmetry of Recent Die<br />
Cast Magnesium Alloys, Advanced Engineering Materials, Vol. 9, No. 9, 2007, pp. 807–812.<br />
204
EXPERIMENTAL REPORT<br />
GeNF<br />
ARES-2<br />
Residual stresses in friction stir welded ESET fatigue test specimens<br />
Proposer:<br />
Co-Proposer(s):<br />
Experimental Team:<br />
User Group Leader:<br />
Instrument Responsible:<br />
J.F. dos Santos 1 , 1 GKSS Research Centre <strong>Geesthacht</strong>, Germany<br />
T. Fischer 1 , Y.E. Ma 2 , P.E. Irving 2<br />
2 School of Applied Science,Cranfield University<br />
T. Fischer 1 , P. Staron 1<br />
N. Huber 1<br />
P. Staron 1<br />
Date(s) of Experiment: 20 th May – 19 th June 2008<br />
Objectives<br />
Friction stir welding (FSW) is a proven technology for use in airframes. It has been shown<br />
that even for simple applications like longitudinal fuselage joints weight savings of up to 15 %<br />
and cost savings of 20 % can be achieved. FSW is now seen as a key element for producing<br />
cost effective integral metallic structures in future airframe applications. By further understanding<br />
and development of the FSW process new applications can be realized leading to<br />
further cost and weight benefits for metallic airframe structures, which will make these structures<br />
more competitive in the future [1]. Of particular importance is the understanding of the<br />
effect of residual stress on the performance of the welded components.<br />
Effects of weld residual stresses on fatigue crack growth (FCG), perpendicular to aluminium<br />
friction stir welds of the aluminium alloy 2195-T8, were investigated by experiments. A range<br />
of sample sizes were machined from identical welds; hence the hardness and microstructures<br />
were identical and the residual stress fields were different. Tests were conducted on<br />
ESE(T) (eccentrically-loaded single edge crack tension) specimens with transverse welds.<br />
Cracks growing into or growing away from the weld centre, as well as in the nugget zone<br />
were investigated. It is shown that residual stresses have significant effect on FCG rates in<br />
the cases ESE(T). Compressive residual stresses in the weld caused extra crack closure and<br />
FCG rate reduction. Fracture mechanics analysis is conducted to understand and explain the<br />
experimental findings.<br />
Experiment<br />
Residual strains were measured in three<br />
ESET specimens with different dimensions<br />
(Fig. 1). The Al (311) reflection was<br />
measured at a wavelength of 1.64 Å. The<br />
nominal size of the gauge volume was<br />
3 mm × 3 mm × 6 mm. A cubic gauge<br />
volume was used for longitudinal strains.<br />
The approximation of a biaxial stress state<br />
was made for the calculation of stressfree<br />
lattice parameters and stresses. As<br />
Al exhibits small crystalline elastic anisotropy,<br />
the macroscopic elastic constants<br />
(E = 73 GPa, = 0.33) were used.<br />
Figure 1: Three ESET samples mounted<br />
in the diffractometer.<br />
205
Achievements and Main Results<br />
Fig. 2 shows the stress distributions along a line perpendicular to the weld for smallest (top)<br />
and the biggest (bottom) sample. It can be seen that the reduction of the sample dimensions<br />
leads to a decrease of the internal residual stress in longitudinal direction. These results will<br />
be complemented by mechanical tension tests.<br />
250<br />
200<br />
150<br />
x<br />
y<br />
100<br />
[MPa]<br />
50<br />
0<br />
-50<br />
-100<br />
-150<br />
0 10 20 30 40 50 60 70 80<br />
distance from notch tip [mm]<br />
250<br />
200<br />
150<br />
x<br />
y<br />
100<br />
[MPa]<br />
50<br />
0<br />
-50<br />
-100<br />
-150<br />
0 10 20 30 40 50 60 70 80<br />
distance from notch tip [mm]<br />
Figure 2: Residual stress distributions across the weld (shaded area) for longitudinal ( x ) and<br />
transverse ( y ) components.<br />
Reference<br />
[1] J.F. dos Santos (editor): Proceedings of the 1st international seminar on FSW modelling and flow<br />
visualisation. 24–25 February 2003, <strong>Geesthacht</strong>, Germany.<br />
206
EXPERIMENTAL REPORT<br />
GeNF<br />
ARES-2<br />
Residual stresses in friction stir welded CT fatigue test specimens<br />
Proposer:<br />
Co-Proposer(s):<br />
Experimental Team:<br />
User Group Leader:<br />
Instrument Responsible:<br />
J.F. dos Santos 1 , 1 GKSS Research Centre <strong>Geesthacht</strong>, Germany<br />
T. Fischer 1 , Y.E. Ma 2 , P.E. Irving 2<br />
2 School of Applied Science,Cranfield University<br />
T. Fischer 1 , P. Staron 1<br />
N. Huber 1<br />
P. Staron 1<br />
Date(s) of Experiment: 24 th June – 18 th July 2008<br />
Objectives<br />
Friction stir welding (FSW) is a proven technology for use in airframes. It has been shown<br />
that even for simple applications like longitudinal fuselage joints weight savings of up to 15 %<br />
and cost savings of 20 % can be achieved. FSW is now seen as a key element for producing<br />
cost effective integral metallic structures in future airframe applications. By further understanding<br />
and development of the FSW process new applications can be realized leading to<br />
further cost and weight benefits for metallic airframe structures, which will make these structures<br />
more competitive in the future [1]. Of particular importance is the understanding of the<br />
effect of residual stress on the performance of the welded components.<br />
Effects of weld residual stresses on fatigue crack growth (FCG), parallel to friction stir welds<br />
of the aluminium alloy 2195-T8, were investigated by experiments. A range of sample sizes<br />
were machined from identical welds; hence the hardness and microstructures were identical<br />
and the residual stress fields were different. Tests were conducted on C(T) (compact tension)<br />
specimens with longitudinal welds. Cracks growing into the weld centre and in the nugget<br />
zone were investigated. It is shown that residual stresses have significant effect on FCG<br />
rates in the cases C(T). Compressive residual stresses in the weld caused extra crack closure<br />
and FCG rate reduction. Fracture mechanics analysis is conducted to understand and explain<br />
the experimental findings.<br />
Experiment<br />
Residual strains were measured in three C(T) specimens<br />
with different dimensions (Fig. 1). The Al (311) reflection<br />
was measured at a wavelength of 1.64 Å. The nominal size<br />
of the gauge volume was 3 mm × 3 mm × 6 mm. A cubic<br />
gauge volume was used for longitudinal strains. The approximation<br />
of a biaxial stress state was made for the calculation<br />
of stress-free lattice parameters and stresses. As<br />
Al exhibits small crystalline elastic anisotropy, the macroscopic<br />
elastic constants (E = 73 GPa, = 0.33) were used.<br />
Figure 1: Three sizes of CT specimens.<br />
207
Achievements and Main Results<br />
Fig. 2 shows the stress distributions along a line longitudinal (bottom) and perpendicular (top)<br />
to the weld for the smallest sample. In the comparison of the sample it can be seen that the<br />
reduction of the sample size leads to a decrease of the internal residual stress in longitudinal<br />
direction. These results will be complemented by mechanical tension tests.<br />
Figure 2: Residual stress distributions perpendicular (top) and parallel (bottom)<br />
to the weld line for longitudinal ( x ) and transverse component ( y )<br />
Reference<br />
[1] J.F. dos Santos (editor): Proceedings of the 1st international seminar on FSW modelling and flow<br />
visualisation. 24-25 February 2003, <strong>Geesthacht</strong>, Germany.<br />
208
EXPERIMENTAL REPORT<br />
GeNF<br />
ARES-2<br />
Residual stress control in laser welded Al T-joints by mechanical tensioning<br />
Proposer:<br />
Co-Proposer(s):<br />
Experimental Team:<br />
User Group Leader:<br />
Instrument Responsible:<br />
D. Schnubel 1 , 1 GKSS Research Centre Geethacht, Germany<br />
M. Koçak 1<br />
P. Staron 1<br />
N. Huber 1<br />
P. Staron 1<br />
Date(s) of Experiment: 25 th November – 2 nd December 2008<br />
Objectives<br />
Laser beam welded (LBW) advanced Al-alloy structures are increasingly used in aircraft airframes.<br />
The A318, A340, and A380 aircrafts are currently manufactured by Airbus using<br />
LBW panels in the lower fuselage area. The production costs, weight reduction as well as<br />
reduced number of parts etc. are well-proved and hence accepted as major benefits of the<br />
LBW technology. However, the damage tolerance behaviour of the welded parts (which behave<br />
as integrally stiffened panels) needs to be further improved for wider use of this technology.<br />
Currently, the crack retarding capacity of welded stringers is inferior to the capacity of<br />
riveted or bonded differential designs.<br />
The use of mechanical tensioning (MT) is a highly promising approach to control tensile residual<br />
stresses or even introduce compressive residual stresses locally in the welded structure<br />
[1]. This is reached by the superimposition of a static elastic stress field during the entire<br />
welding process. This technique provides the possibility to tailor the welding induced<br />
stresses with respect to the external loading conditions and hence improve the damage tolerance<br />
behaviour.<br />
The finite element welding simulation software SYSWELD is used to study the modification<br />
of the welding-induced residual stresses by MT for Al-alloys AA2198 and AA6013 stiffened<br />
one-stringer model panels under different MT conditions. The numerical estimations were<br />
validated by accompanying welding tests,<br />
including temperature field and optical distortion<br />
measurements. Finally, specimens were<br />
manufactured using optimized parameters.<br />
Experiment<br />
Residual strains were measured in two<br />
laser beam welded T-joints (Fig. 1). One<br />
was welded without MT, the other was<br />
welded with a longitudinal external load of<br />
100 MPa on the base sheet. The Al (311)<br />
reflection was measured at a wavelength<br />
of 1.64 Å. The nominal size of the gauge<br />
volume was 1.5 mm × 1.5 mm × 30 mm. A<br />
cubic gauge volume was used for longitudinal<br />
strains, but the gauge volume was<br />
Figure 1: Samples mounted in the diffractometer.<br />
209
moved in longitudinal direction during the measurement to cover approximately the same<br />
volume as for the other two directions and improve grain statistics.<br />
Achievements and Main Results<br />
Figure 2 shows the strain distributions along a line perpendicular to the weld for the two<br />
samples. It can be seen that the tensile peak strains in longitudinal direction were significantly<br />
reduced by MT. Also the longitudinal compressive strain field is modified. These modifications<br />
go along with a strong reduction of the welding-induced distortion of the panel. The<br />
results will be compared with the SYSWELD predictions to optimize the FE model.<br />
a)<br />
b)<br />
Figure 2: Strain distributions across the weld line for<br />
a) reference sheet and b) mechanically tensioned sheet.<br />
Reference<br />
[1] D.A. Price, S.W. Williams, A. Westcott, C.J.C. Harrison, A. Rezai, A. Steuwer, M. Peel, P. Staron,<br />
M. Koçak, Science and Technology of Welding and Joining 12 (2007) 620–632.<br />
210
EXPERIMENTAL REPORT<br />
GeNF<br />
TEX-2<br />
Neutron texture diffractometer TEX-2<br />
Short Instrument Description<br />
The four circle neutron texture diffractometer is used to characterise textures in metallic,<br />
ceramic and geologic materials applying thermal, non-polarised neutrons.<br />
Local Contact:<br />
Prof. Dr. Heinz-Günter Brokmeier<br />
Phone/Fax:+49 4152 87-1207 / +49 4152 87-1338<br />
e-mail: brokmeier@gkss.de<br />
Schematic View of TEX-2:<br />
Beamline 5<br />
FRG-1<br />
Reactor shielding<br />
Filter<br />
Collimator<br />
Sample<br />
Beam stop<br />
Monochromator<br />
Detector<br />
Instrument Details:<br />
Location at FRG-1:<br />
beamline 5, thermal neutrons<br />
maximum beam cross section: 45 x 45 mm 2<br />
Primary collimation: 30’, 42’, 51’<br />
Monochromator: Cu (111), Cu (200), PG (002)<br />
Take-off angle: 17.2°, 27.2°, 37.2°, 47.2°, 57.2°<br />
Wavelength range:<br />
= 0.08–0.27 nm (in steps)<br />
Flux at sample position: Φ = 0.3 - 2·10 6 cm -2 s -1<br />
Angular range Φ: -360° to +360°<br />
Χ: -360° to +360°<br />
Ω: -46° to + 46°<br />
2Φ: -60° to +90°<br />
Detector:<br />
3 He- single detector<br />
2-D position – sensitive 3 He-detector 300 x 300 mm<br />
211
Instrument Details (continued):<br />
Sample geometries (standard):<br />
(various):<br />
Distances: sample 3 He detector<br />
sample 2-D-detector<br />
Sample environment:<br />
cube 10 mm edge, sphere 15–20 mm <br />
cylinder 10–15 mm , 10–15 mm high<br />
e.g. wires, tubes, tensile samples<br />
65–160 cm<br />
60–120 cm<br />
– loading device: range of cycling load:<br />
tension up to 1.5 t, compression up to 2.0 t,<br />
– sophisticated set of sample holders<br />
212
EXPERIMENTAL REPORT<br />
GeNF<br />
TEX-2<br />
Texture investigation of magnesium alloy MA2-1 after ECAP<br />
Proposer:<br />
Co-Proposer(s):<br />
Experimental Team:<br />
User Group Leader:<br />
Instrument Responsible:<br />
Tatiana Lychagina 1 , 1 Frank Lab of Neutron Physics, Joint<br />
Institute for Nuclear Research, Dubna, Russia<br />
Dmitry Nikolayev 1<br />
Tatiana Lychagina 1 , Dmitry Nikolayev 1<br />
Tatiana Lychagina 1<br />
Heinz-Günther Brokmeier 2,<br />
2 Clausthal University of Technology, Clausthal, Germany<br />
Date(s) of Experiment: 8 th – 19 th April 2008<br />
Objective<br />
Deformed magnesium alloys find wide application in various branches of mechanical<br />
engineering and, first of all, in aerospace, automobile and electronic industries. Though they<br />
have high specific strength, plasticity of semifinished products from these alloys (especially<br />
at temperatures of deformation below 250 ˚C) is not rather high [1]. It is connected in many<br />
respects to features of the structure and texture formation at plastic deformation of the given<br />
alloys. The situation can considerably be improved if to find ways of deformation of<br />
magnesium products allowing to generate in these materials the equiaxed fine-grained<br />
structure during deformation and diffuse or tilted basal texture. One of the promising ways of<br />
this problem decision is application of the severe plastic deformations with help of equal<br />
channel angular pressing (ECAP)[2–5]. The ECAP process consist of extruding a lubricated<br />
sample through two channels of equal and indentical area of cross-section. The process can<br />
be repeated multiple times. There is no change in area of cross-section due to the process.<br />
Experimental<br />
We investigated the texture formed after ECAP for Mg-4.5%Al-1%Zn (MA2-1) alloy. The bar<br />
extruded with backpressure at 345 ºC was input for ECAP. The ECAP was carried out up to<br />
four passes following the routes A (a sample orientation is not changed after each pass), C<br />
(after each pass a sample is rotated about its longitudinal direction by 180º) and up to six<br />
passes following the route B c (after the first two passes under the route C a sample is rotated<br />
about its longitudinal axis by 90º clockwise, then remaining two passes are achieved again<br />
under the route C). The ECAP procedure was carried out using a specially designed die with<br />
an angle 90º between two channels of square cross section (20×20mm) without any<br />
rounding of the corners. In each route, the sample had to be turned by 90 º around its<br />
transverse axis in order to set the deformed sample back into the die. The first pass was<br />
carried out at 260 ºC. Then temperature having been decreased up to 240 ºC for the fourth<br />
pass. E_D is the extrusion direction (the direction of ECAP). The texture of the 8 samples<br />
was investigated by measuring the (002), (100), (101), (110) pole figures using the TEX-2<br />
neutron diffractometer at the FRG-1 neutron source. The samples size was 10×10×10mm.<br />
The all samples were measured so that the extrusion direction (the direction of ECAP) is in<br />
the center of the pole figures. The exposure time was about 40 hours for the 4 pole figures.<br />
Achievements and Main Results<br />
It was measured four complete pole figures (PFs) (002), (100), (101), (110) for each sample.<br />
The experimental PFs measured for routes A, C and B c are given in Figs. 1–3. The fist row<br />
presents the PFs for the input extruded sample on each figure. In the second row it can be<br />
213
seen the PFs for sample after one ECAP pass. So the PFs in the second row (after one<br />
ECAP pass) are the same for the Figs. 1–2 (routes A and C). The second row in Fig. 3 presents<br />
PFs after two passes in route C. This corresponds to the first step of ECAP procedure<br />
for the route B c in our case. Also the PFs in the third row (Fig. 3) describes the next step of<br />
the ECAP procedure, i.e. PFs after four passes in the route B c. Here two passes are carried<br />
out in route C and two passes in route B c , i.e. with rotation after second and third passes<br />
about longitudinal axis of the sample by 90º clockwise.<br />
The initial texture (for input sample) is characterized by two strong axial components (basal<br />
and prismatic). The intensity of basal component is about 10 mrd, and the intensity of prismatic<br />
component is about 18mrd. It should be underlined that for common magnesium<br />
(AZ31, AZ61, MA2-1) alloys samples after extrusion the one prismatic texture component is<br />
typical. The reason for the second component is backpressure combining with extrusion.<br />
After the first pass we observe the moving of the basal component (the intensity maximum)<br />
on the angle about 45° respectively to extrusion direction. After the second pass in route A<br />
this component moved on the angle about 90° respectively to extrusion direction. After the<br />
fourth pass in the route A the intensity of this component increased from the 6.06 mrd (after<br />
the second pass) up to 8.97 mrd.<br />
Figure 1: The experimental pole figures for the input sample and the samples in the route A of ECAP.<br />
The all samples are from alloy MA2-1. The extrusion direction (ED) is in the center for the all PFs. The<br />
position of the sample coordinate system (extrusion direction, transverse direction, normal direction) is<br />
the same for the all samples.<br />
214
Figure 2: The experimental pole figures for the input sample and the samples in the route C of ECAP.<br />
The all samples are from alloy MA2-1. The extrusion direction (ED) is in the center for the all PFs. The<br />
position of the sample coordinate system (extrusion direction, transverse direction, normal direction) is<br />
the same for the all samples.<br />
The moving of the texture components during the route C is rather close to one in the route<br />
A. The difference is velocity of intensity redistribution. So during the route C the maximum of<br />
basal texture component on the angle about 45° respectively to extrusion direction is more<br />
stable then in the route A. It presents on the PFs for the samples after second and fourth<br />
passes as well in the route C. The maximum of this texture component increased from<br />
6.35 mrd after the second pass up to 8.42 mrd after the fourth pass.<br />
As for the route B c we also observe the same component moving after the fourth pass. The<br />
maximum of this component increased from 8.61 mrd after the fourth pass up to 11.9 mrd<br />
after the sixth pass.<br />
215
Figure 3: The experimental pole figures for the input sample and the samples in the route B c of ECAP.<br />
The all samples are from alloy MA2-1. The extrusion direction (ED) is in the center for the all PFs. The<br />
position of the sample coordinate system (extrusion direction, transverse direction, normal direction) is<br />
the same for the all samples.<br />
Samples were produced by V.N. Serebryany within the frame of the Russian State contract<br />
№ 02.513.11.3340.<br />
References<br />
[1] K. Xia, J.T. Wang, X. Wu, G. Chen, M. Gurvan, Mater.Sci.Eng. A 410-411, 324–327 (2005)<br />
[2] Z. Horita, T. Fujinami and T.G. Langdon, Mater.Sci.Eng., A318, 34 (2001)<br />
[3] R.Z. Valiev, R.K. Islamgaliev and I.V. Alexandrov Prog.Mater.Sci., 45, 103 (2000)<br />
[4] A. Yamashita, Z. Horita and T.G. Langdon Mater.Sci.Eng., A300, 142 (2001)<br />
[5] T. Liu, W. Zhang, S.D. Wu, C.B. Jiang, S.X. Li, Y.B. Yu, Mater.Sci.Eng., A 360, 345 (2003)<br />
216
EXPERIMENTAL REPORT<br />
GeNF<br />
TEX-2<br />
Texture in the accumulative roll bonding (ARB) processed pure Mg<br />
Proposer:<br />
Co-Proposer(s):<br />
Experimental Team:<br />
Mingyi Zheng 1 , Hai Chang 1 , 1 Harbin institute of technology,<br />
No.92 West Dazhi Street, 150001 Harbin, P. R. China<br />
Weimin Gan 2, 3 , Heinz-Günter Brokmeier 2 ,<br />
2 Clausthal University of Technology, Clausthal, Germany<br />
Hai Chang 1 , Weimin Gan 2, 3 ,<br />
3 GKSS Research Centre <strong>Geesthacht</strong>, Germany<br />
User Group Leader:<br />
Instrument Responsible:<br />
Mingyi Zheng 1<br />
Heinz-Günter Brokmeier 2<br />
Date(s) of Experiment: 25 th – 30 th April 2008, 15 th – 22 nd May 2008<br />
Objectives<br />
Accumulative roll bonding (ARB) is a kind of severe plastic deformation process (SPD) which<br />
has potential to be adopted by industry to produce ultra-fine grained (UFG) materials in the<br />
form of large sheets. In ARB process, two pieces of sheets are first stacked after degreasing<br />
and wire-brushing, and then the stacked sheets are held in a furnace to the desired temperature<br />
followed by rolling. The roll-bonded sheet is cut into two halves and the above procedure<br />
is repeated. By repeating this procedure, ultra-high strains can be introduced into the sheet<br />
successfully [1].<br />
Magnesium is more attractive for structural light materials due to its high specific strength,<br />
high specific stiffness, and so on. The use of Mg is expanding, particularly in automotive industry.<br />
For the greater applicability, rolling technologies for high performance Mg sheets<br />
should be improved. Moreover, a rolled Mg sheet shows a strong basal texture, indicating a<br />
strong plastic anisotropy which associated with its inner HCP crystallographic structure.<br />
Most ARB processed materials have ultra-fine grained structure and show very high strength<br />
at ambient temperature [1, 2]. Moreover, ARB process introduces the redundant shear strain<br />
existing at the subsurface region into the inner part of the ARBed sheet. The redundant<br />
shear can accelerate the grain refinement speed in the ARB process [2, 3]. In particular, the<br />
rolling texture of Al sheet was also weakened because of the shear strain [2]. Up to now, the<br />
researches on the texture of ARBed alloy are mainly focused on b.c.c and f.c.c metal sheets,<br />
such as steel and Al sheets, there is little systematic study on the ARBed h.c. p metals, especially<br />
Mg alloys.<br />
Current research is proposed to investigate how the texture develops during ARB processing<br />
of pure Mg with different temperatures and cycles and its effect on the following mechanical<br />
behaviour. Deformation mechanism will be discussed and related to the textures development.<br />
Experiment<br />
A cast commercial pure Mg strip with 120 mm long, 50 mm wide and 4 mm thick are rolled<br />
into a sheet at 350 ˚C with the total reduction of 75 %; and then followed by ARB processing<br />
up to 4 cycles at 300 ˚C, and to 8 cycles at 400 ˚C, respectively. A cubic sample of 1 cm 3<br />
which is a stack of 10 small ARBed sheets with a dimension of 1 x 10 x 10 mm 3 is prepared<br />
for texture measurement by neutrons radiation at TEX-2. Four pole figures of (00.2), (10.0),<br />
(10.1) and (11.0) were measured with single detector. ODFs and inverse pole figures werecalculated<br />
by serious method with an expansion degree L max = 20.<br />
217
Achievements and Main Results<br />
Figure 1 shows (00.2) and (10.0) pole figures of ARBed Mg sheet at 400 ˚C. The basal pole<br />
figures of the Mg layers exhibit a typical rolling texture with the basal pole tilting slightly away<br />
from ND towards RD direction during the whole ARB processing. Intensity of the basal pole<br />
increased till 4 cycles and then decreased. The first possible explanation for this decrease is<br />
the dynamic recystallization grains which will lead to a randomization of grain orientations [4,<br />
5, 6]. The second explanation is the activation of non-basal slip and the suppression of tension<br />
twinning at high temperature weaken the basal slip during rolling, which consequently<br />
reduce the basal texture intensity [6]. The third possible explanation is the introduction of the<br />
bonding interface during ARB.<br />
Figure 2 shows Inverse pole figures of ARBed Mg sheet at 400 ˚C. The main orientation of RD<br />
rotates from the (10.0) to the (11.0) with increasing of the ARB cycles, which may be related<br />
to the accumulated shear strain during ARB [7].<br />
Figure 3 shows (00.2) and (10.0) pole figures of ARBed Mg sheet at 300 ˚C. As same as<br />
400 ˚C, the texture type is still basal texture during ARB. However, the intensity of basal texture<br />
didn’t change obviously.<br />
References<br />
[1] Y. Saito, H. Utsunomiya, N. Tsuji, T. Sakai. Acta Materialia, 1999, 47(2):579–583.<br />
[2] B.L. Li, N. Tsuji, N. Kamikawa. Mater. Sci. Eng. A, 2006, 423: 331–342.<br />
[3] X. Huang, N. Tsuji, N. Hansen, Y. Minamino. Mater. Sci. Eng. A, 2003, 340: 265–271.<br />
[4] M.Y. Zhan, Y.Y. Li, W. P. Chen, W.D. Chen, J Mater. Sci. 42 (2007) 9256<br />
[5] J.A. Del Valle, M. T. Pérez-Prado, O.A. Ruano, Mater. Sci. Eng. A 355 (2003) 68.<br />
[6] Y. Chino, M. Mabuchi, Scripta Mater. (2008), doi: 10.1016/j.scripta mat.2008.11.029<br />
[7] L. Jiang, M.T. Pérez-Prado, P.A. Gruber, E. Arzt, O.A. Ruano, M.E. Kassner, Acta. Mater. 56<br />
(2008) 1228.<br />
218
(0002)<br />
(1010)<br />
RD<br />
1 cycle<br />
P max =15.96 P max =3.255<br />
TD<br />
2 cycles<br />
P max =16.35<br />
P max =3.479<br />
4 cycles<br />
P max =16.94 P max =3.190<br />
6 cycles<br />
P max =14.3 P max =2.959<br />
8 cycles<br />
P max =13.65<br />
P max =2.806<br />
Figure 1: (00.2) and (10.0) pole figures of Mg sheet ARBed at 400 ˚C.<br />
219
1 cycle<br />
(11.0)<br />
(00.2)<br />
(10.0)<br />
2 cycle<br />
4 cycle<br />
6 cycle<br />
8 cycle<br />
Figure 2: Inverse pole figures of Mg sheet ARBed at 400 ˚C.<br />
220
(0002)<br />
RD<br />
(1010)<br />
1 cycle<br />
TD P max =18.87 P max =3.221<br />
2 cycles<br />
P max =18.76<br />
P max =3.622<br />
4 cycles<br />
P max =18.02<br />
P max =3.432<br />
Figure 3: (00.2) and (10.0) pole figures of Mg sheet ARBed at 300 ˚C.<br />
221
222
EXPERIMENTAL REPORT<br />
GeNF<br />
TEX-2<br />
Texture evolution in SiCp/AZ91 composite processed by ECAP<br />
Proposer:<br />
Co-Proposer(s):<br />
Experimental Team:<br />
User Group Leader:<br />
Instrument Responsible:<br />
Mingyi Zheng 1 , 1 Harbin Institute of Technology, Harbin PR China<br />
J.L. Wang 1 , Heinz-Günter Brokmeier 2, 3<br />
2 Clausthal University of Technology, Clausthal, Germany<br />
3 GKSS Research Centre <strong>Geesthacht</strong>, Germany<br />
Bernd Schwebke 2, 3 , Weimin Gan 2, 3<br />
Mingyi Zheng 1<br />
Heinz-Günter Brokmeier 2, 3<br />
Date(s) of Experiment: 29 th May – 22 nd June 2008<br />
Objectives<br />
Magnesium matrix composites have many advantages over monolithic Mg alloys [1]. Stircasting<br />
is one of the commonly used processing methods to fabricate metal matrix composites.<br />
Secondary processing, such as conventional extrusion and rolling is performed on the<br />
stir-cast composites in order to obtain not only the fully dense composites but also the desired<br />
microstructure and properties [2].<br />
In this research, an attractive sever plastic deformation technology ECAP (equal channel<br />
angular pressing) on SiCp/Mg composite is attempted. Effect of processing temperature on<br />
mechanical property was firstly investigated to optimize the microstructure. Texture which<br />
records the thermo-mechanical history is required to be analyzed and related to the deformation<br />
mode, and as well the following property.<br />
Experiment<br />
SiC particulate reinforced AZ91 magnesium composites with different particle sizes and volume<br />
fractions have been fabricated by stir casting in Harbin Institute of Technology, China.<br />
Part of the cast composite ingot was hot extruded at 350 o C to give a quadratic shape billet of<br />
15 mm corresponding to a reduction ratio of 12:1. A rectangular billet with 10×10×60 mm 3<br />
was machined from the cast ingot and extrusion rod, respectively, for ECAP.<br />
The ECAP was conducted on the billets through the die with a channel angle of 90 o and a<br />
curvature angle of 37° with different temperature of 250 °C, 300 °C, 350 °C and 400 °C.<br />
Specimens cut from the center of the ECAPed billet were measured by neutron radiation at<br />
TEX-2 since neutrons are powerful for the texture analysis of multi-phased materials [3]. Four<br />
complete pole figures were measured using a combination of reflection and transmission<br />
method with a wave length of 0.1332 nm.<br />
Achievements and Main Results<br />
Complete (00.2) and (10.0) pole figures of the initial as-extruded and following ECAP processing<br />
at different temperatures are shown in Fig. 1 on the first and second rows, respectively.<br />
The ECAP direction on present projection plane is to the right; and the normal direction<br />
is to the top. The theoretical shear plane which orientates 45° to the extrusion direction is<br />
therefore easily illustrated. A was produced in the as-extruded composite but having<br />
relatively low pole intensity which should be due to the existence of SiC particles.<br />
223
After ECAP at 250 °C double component with a strong fiber around extrusion direction<br />
and a weak shear fiber which orientated about 45° to the extrusion direction was obtained,<br />
as shown in Figure 1. Similar fiber was formed at 300 °C and 350 °C but without<br />
the shear component. ECAP at 400 °C the fiber was about 5° oft to the extrusion<br />
direction and a weak component occurred in pole figure center. It can be found that the<br />
maximum texture intensity was gradually decreased with the increase of ECAP temperature.<br />
Noticeable is that the disappearance of shear component at higher temperature which should<br />
be due to the combination effect of second particles with soft matrix Mg at elevated temperature.<br />
Dynamic recrystallization behavior should also be responsible at high temperature.<br />
Further investigation on the current different texture effect on tensile and damping behavior is<br />
in processing.<br />
As-extruded 250 °C 300 °C 350 °C 400 °C<br />
P max = 2.3 mrd<br />
P max = 4.0 mrd<br />
P max = 3.2 mrd<br />
P max = 3.0 mrd<br />
P max = 2.2 mrd<br />
P max = 2.2 mrd<br />
P max = 2.0 mrd<br />
P max = 1.8 mrd<br />
P max = 1.8 mrd<br />
P max = 1.8 mrd<br />
Figure 1: The (00.2) and (10.0) complete pole figure of ECAPed SiCp/Mg composite at different temperatures<br />
are shown in the first and second rows, respectively (the extrusion and normal direction are<br />
to the right and top, respectively. Contour levels= 1.0, 1.2, 1.4, …).<br />
References<br />
[1] Zheng, M.Y.; Wu, K.; Yao, C.K.; Aging behavior of squeeze cast SiCw/AZ91 magnesium matrix<br />
Composite; Materials Sceincce and Engineering A 318 (2001), 50–56.<br />
[2] Wang, X.J.; Wu. K.; Zhang, H.F.; Hunag, W.X.; Chang, H.; Gan, WeiMin.; Zheng, M.Y.;<br />
Peng, D.L.; Effect of hot extrusion on the microstructure of a particulate reinforced magnesium matrix<br />
Composite; Materials Science and Engineering A 465 (2007), 78–84.<br />
[3] Brokmeier, H.-G.; Neutron Diffraction Texture Analysis of Multi-phase System; Textures and<br />
Microstructures 10 (1989), 325–346.<br />
224
EXPERIMENTAL REPORT<br />
GeNF<br />
TEX-2<br />
Correlation of texture and damping properties in bar extruded Mg-AZ80<br />
Proposer:<br />
Co-Proposer(s):<br />
Experimental Team:<br />
User Group Leader:<br />
Instrument Responsible:<br />
Heinz-Günter Brokmeier 1 , Mingyi Zheng 2 ,<br />
1 Clausthal University of Technology, Clausthal, Germany<br />
2 Harbin Institute of Technology,150001 Harbin, P. R. China<br />
Weimin Gan 1, 3 , 3 GKSS Research Centre <strong>Geesthacht</strong>, Germany<br />
Emad Maawad 1<br />
Weimin Gan 1, 3 , Emad Maawad 1<br />
Heinz-Günther Brokmeier 1<br />
Heinz-Günther Brokmeier 1<br />
Date(s) of Experiment: 10 th – 11 th September 2008<br />
Objectives<br />
It is known that Mg has a good damping capacity which can improve its wide application<br />
[1, 2, 3]. Due to the hexagonal structure of Mg-alloys a more or less pronounced anisotropy<br />
of the properties is observed. In polycrystalline materials crystallographic texture is together<br />
with the microstructure an important parameter for this anisotropy. The present investigation<br />
deals with a rectangular extruded Mg AZ80 bar, see chemical composition in table 1.<br />
Table 1: Chemical composition of the investigated Mg AZ80 alloy.<br />
Al Ca Cu Fe Mn Ni Pb Si Sn Zn Zr Mg<br />
8.58
The damping tests were carried out by using dynamic mechanical analyzer (DMA) (Model<br />
TA Q800, USA) with single cantilever vibration mode. The damping capacity was determined<br />
by Q -1 = tan , where was the lag angle between the applied strain and the response stress.<br />
Neutron experiment<br />
Neutron texture measurements were carried to average of the whole thickness of the<br />
extruded bar. Calculation of the orientation distribution function (ODF) allows the correlation<br />
of the orientation with the three damping samples, see Fig. 1. Therefore, at minimum of three<br />
complete pole figures are necessary to get a sufficient texture quality by using the iterative<br />
harmonic method. We have measured Mg (10.0), (00.2) and (10.1), see two of them in Fig. 3.<br />
Figure 3: Measured (00.2) and (10.0) pole figure of a rectangular Mg AZ80 bar.<br />
Achievements and Main Results<br />
As shown in Fig. 2 anisotropy in mechanical properties is observed, especially for the yield<br />
point. Elastic properties can be directly correlated with damping capacity. Based on the neutron<br />
measurements the preferred orientation of the three loading samples (tensile experiment<br />
in Fig. 2b) and the damping test samples (sample orientation in Fig. 2a) can be described as<br />
follows, see Fig. 4.<br />
0° to ED 45° to ED<br />
90° to ED<br />
LD LD LD<br />
Figure 4: Preferred orientation due to damping and tensile samples (LD – loading direction).<br />
References<br />
[1] A.F. Schwaneke, R. W. Nash: Metall. Transaction 2 (1971), 3453.<br />
[2] H. Watanabe, T. Mukai, M. Sugioka, K.Ishikawa: Scripta Mat. 51 (2004), 291–295.<br />
[3] X.S. Hu, Y.K. Zhang, M.Y. Zheng, K. Wu: Scripta Mat. 52 (2005), 1141.<br />
226
EXPERIMENTAL REPORT<br />
GeNF<br />
TEX-2<br />
Evolution of texture in Mg/Al multilayed composite sheet processed<br />
by accumulative roll bonding<br />
Proposer:<br />
Co-Proposer(s):<br />
Mingyi Zheng 1 , Hai Chang 1 , 1 Harbin institute of technology,<br />
No.92 West Dazhi Street, 150001 Harbin, P. R. China<br />
Weimin Gan 2, 3 , Heinz-Günter Brokmeier 2<br />
2 Clausthal University of Technology, Clausthal, Germany<br />
Experimental Team:<br />
User Group Leader:<br />
Instrument Responsible:<br />
Hai Chang 1 , Weimin Gan 2, 3<br />
3 GKSS Research Centre <strong>Geesthacht</strong>, Germany<br />
Mingyi Zheng 1<br />
Heinz-Günter Brokmeier 2<br />
Date(s) of Experiment: 30 th October – 03 rd November 2008, 04 th – 13 th December 2008<br />
Objectives<br />
Accumulative roll bonding (ARB) is one kind of severe plastic deformation (SPD) process<br />
which can produce bulk ultra-fine grained (UFG) metallic materials [1]. The ARB process<br />
consists of multiple cycles of rolling, cutting, stacking and solid-state deformation bonding, so<br />
that a large strain can be accumulated in the metallic sheet during the ARB process without<br />
any sheet geometrical changing [2]. Particularly, ARB is prospective SPD process which can<br />
produce bulk material continuously and has a good potential for commercialization [1–3].<br />
To date, most of the investigations had been devoted just to the same alloys and less effort<br />
has been dedicated to dissimilar materials [4]. The ARB process is amendable to fabricate<br />
multilayed composites containing alternative layers of different metal types due to the relatively<br />
simple processing and low cost materials of the sheets [4]. Structural formation of dissimilar<br />
metal systems during ARB may be much more complicated than that of single metal<br />
systems, due to the co-deformation of the two dissimilar metals with different flow properties.<br />
Accordingly, the texture of the constitute metals in the ARBed multilayed composite may be<br />
quite different from that of the ARBed monolithic metals, which may affect the properties of<br />
the multilayed composite.<br />
The main purpose of this project is to analyze both the texture evolution of the Mg layer and<br />
Al layer of the ARBed Mg/Al laminated composite by neutron diffraction. This kind of composite<br />
was selected because a unique combination of the advantages of both Mg and Al<br />
could be achieved in such a laminated composite [5].<br />
Experiment<br />
Pure Mg slabs with the dimension of 120 × 50 × 4 mm 3 were cut from the cast ingot and then<br />
rolled into sheets with the thickness about 0.90 mm at 400 ˚C. The Al 5052 alloy was received<br />
in the form of a rolled sheet with the thickness of 0.5 mm and annealed at 400 ˚C for<br />
30 min. After degreasing and wire-brushing, the pure Mg sheet and the annealed Al alloy<br />
sheets were stacked by the sequence of Al-Mg-Al and then warm roll-bonded with 50 % reduction<br />
at 400 ˚C, then the primary sandwich sheet was processed by ARB at 400 ˚C up to 3<br />
cycles. It was noticeable that the rolling direction of the pure Mg sheet was parallel to the<br />
transverse direction of the annealed 5052 sheet during the primary sandwich preparation.<br />
During the ARB processing, the samples were kept at 400 ˚C for 5 min to reach the rolling<br />
temperature before each cycle and air-cooled after rolling.<br />
227
The texture measurements were done on a stack of several sheets with a size of<br />
10 mm×10 mm for the penetration depth of neutron beam. Four complete pole figures<br />
o (0002), (1010), (1120), (10 11) of the Mg layers were measured. The orientation distribution<br />
function (ODF) of the Al layer was calculated from the measured pole figures (111), (200) by<br />
using the harmonic method with a maximum series expansion coefficient of l max = 22. The<br />
ODFs were presented as plots of constant 2 sections with isointensity contours in Euler<br />
space defined by Euler angles , Φ, .<br />
1<br />
2<br />
Achievements and Main Results<br />
Figure 1 shows the (0002) pole figures of the Mg layer in the Mg/Al laminated composite<br />
after different ARB cycles. The basal pole figures of the Mg layers exhibit a typical rolling<br />
texture with the basal pole tilting slightly away from ND towards RD direction during the<br />
whole ARB processing. The intensity of the basal plane texture increased after 1 cycle but<br />
then decreased in the following cycles. Moreover, splitting of basal pole is more clearly visible<br />
for the sheet after three ARB cycles than for the sheet processed by 1 and 2 ARB cycles.<br />
Figure 1: (0002) pole figures of the Mg layer in the Mg/Al laminated composite after (a) primary<br />
sandwich preparation (b) 1 cycle (c) 2 cycles and (d) 3 cycles.<br />
Figure 2 shows the texture evolution of the Al layer in the Mg/Al laminated composite. During<br />
the ARB process, dominant global texture of the Al layer was β fiber rolling texture with scatter<br />
around the ideal orientations. Cube and Rotate Cube exists during the whole deformation<br />
procedure. As shown in Figure 3, during ARB, the intensity and the sharpness of the β fiber<br />
rolling texture increased till two cycles and then decreased dramatically after three cycles.<br />
According to Quadir [6], the significant waviness structure caused by the shear band which<br />
was introduced by the different flow properties of Mg and Al reduced both the intensity and<br />
the sharpness of the rolling texture of both Mg and Al layer after three ARB cycles.<br />
228
Figure 2: Texture evolution of the Al layer: (a) initial Al sheet (b) annealed Al sheet (c) primary<br />
sandwich (d) after 1 cycle (e) after 2 cycles and (f) after 3 cycles.<br />
Figure 3: Intensity variation of the main fibers of the Al alloy: (a) α-fiber, (b) ND-fiber, (c) β-fiber and<br />
(d) intensity variation of the components along the β-fiber versus the ARB cycle numbers.<br />
References<br />
[1] N. Tsuji, Y. Saito, S. H. Lee, Y. Minamino. Adv. Eng. Mater. 5 (2005) 338.<br />
[2] Y. Saito, H. Utsunomiya, N. Tsuji, T. Sakai, Acta Mater. 47 (1999) 579.<br />
[3] B. L. Li, N. Tsuji, N. Kamikawa, Mater. Sci. Eng. A 423 (2006) 331.<br />
[4] M. Eizadjou, A. Kazemi Talachi, H. Danesh Manesh, H. Shakur Shahabi,<br />
K. Janghorban, Comp. Sci. Tech. 68 (2008) 2003.<br />
[5] S. H. Ghader, A. Mori, K. Hokamoto, Mater. Trans. 49 (2008) 1142.<br />
[6] M. Z. Quadir, M. Ferry, O. Al-Buhamad, P. R. Munroe, Acta. Mater. 57 (2009) 29.<br />
229
230
EXPERIMENTAL REPORT<br />
GeNF<br />
TEX-2<br />
Effect of texture on the microplasticity of the ECAPed pure Mg<br />
Proposer:<br />
Co-Proposers:<br />
Guodong Fan 1 , Mingyi Zheng 1 , K. Wu 1, 1 School of Materials<br />
Science and Engineering, Harbin Institute of Technology, Harbin China<br />
Weimin Gan 2, 3 , Heinz-Günter Brokmeier 2 ,<br />
2 Clausthal University of Technology, Clausthal, Germany<br />
3 GKSS Research Centre <strong>Geesthacht</strong>, Germany<br />
Experimental Team:<br />
User Group Leader:<br />
Instrument Responsible:<br />
Weimin Gan 2, 3 , Guodong Fan 1 ,<br />
Mingyi Zheng 1<br />
Heinz-Günter Brokmeier 2<br />
Date(s) of Experiment: 24 th – 29 th November 2008<br />
Objective<br />
Magnesium and its alloys have attracted significant interest due to their excellent properties,<br />
such as low density and high specific strength, which make them potentially suitable candidates<br />
for replacing heavier materials in some automobile parts, astronautic components and<br />
electronic productions [1] .<br />
As one of the typical severe plastic deformation (SPD) techniques, equal channel angular<br />
pressing (ECAP) has attracted considerable attention in recent years [2] . ECAP processed<br />
magnesium alloys exhibited high strength, high ductility as well as low temperature superplasticity<br />
due to the grain refinement [3] . Moreover, it is recognized that ECAP offers the potential<br />
to induce unique deformation texture and these textures could have a significant impact<br />
on the mechanical properties of materials. As a part of mechanical property, it is very<br />
important to understand how microplastic strains are generated, especially for the many applications<br />
where the structure has to be stable elastically. However, very few studies have<br />
been performed on microplasticity of Mg alloys [4, 5] . In fact, microplasticity of Mg alloys depends<br />
on their chemical composition and microstructure, such as grain size and texture.<br />
Therefore, the textures in as-extruded and EX+ECAPed pure Mg were measured, and the<br />
effect of texture on the microplasticity of pure Mg, without influencing by alloys, was analysed.<br />
Experiment<br />
The material used in this investigation was an extruded commercial pure Mg. 10×10×60 mm<br />
rectangular billets were machined from the extrusion rods for ECAP. The ECAP die has a<br />
channel angle of 90 o and a curvature angle of 37° (Figure 1). The ECAP was conducted at<br />
250 o C for 4 passes using processing route B C . Molybdenum disulphide (MoS 2 ) was used as<br />
lubricant. The samples were held for 30 min in the die preheated to 250 o C, and then extruded<br />
with a speed of 24 mm/min.<br />
The neutron texture measurements were carried out at TEX-2 in GKSS-Research Centre at<br />
FRG-1 in <strong>Geesthacht</strong>, Germany. The measuring time was controlled through the fixed thermal<br />
neutron flux for one measuring point, not by fixed time that is generally used for X-ray<br />
measurements. A pole figure measurement is performed at stationary 2- diffraction angle for<br />
(h k i l ) lattice plane in interest, and it is completed by 360° rotation of the sample at each of<br />
tilting position from 0° to 90°, and the used wavelength was 1.332 Å delivered from Cu<br />
monochromator. The measured pole figure has 679 points distributing regularly in an equal<br />
area grid, and then these should be interpolated into an equal angular grid of 5° 5° with<br />
1368 points.<br />
231
Achievements and Main Results<br />
The coordination system of sample after ECAP is shown in Fig. 1, where ED, TD and ND are<br />
the extrusion, the transverse, and the normal direction of the ECAP-processed specimens,<br />
respectively. For better visualization, the experimental pole figures after ECAP are presented<br />
on the ED-TD plane (plane X in Fig. 2). And in order to investigate the effect of shear plane<br />
(seen in Fig. 1) on the texture of materials easily and clearly, most of the studies on ECAE<br />
texture evolution in magnesium alloys use (0002) and ( 10 1 0 ) pole figures projected on to<br />
the ED-ND plane (plane Y) for a representation of texture [6,7] , therefore, the (0002) and<br />
( 10 1 0 ) pole figures were also re-calculated in this article (Fig. 3).<br />
Shear plane<br />
ND (X)<br />
45°<br />
TD (Y)<br />
ED (Z)<br />
Figure 1: Schemes of an ECAP die and the coordination system of ECAP processed sample.<br />
(0002), ( 10 1 0 ) and (10 11) complete pole figures on projection plane X and Y of the pure Mg<br />
after hot extrusion and followed by ECAP processing from 1 pass up to 4 passes are shown<br />
in Fig. 2 and Fig. 3, respectively. Texture in as-extruded pure Mg consists of a central component<br />
visible inside the (0002) pole figure and a girdle distribution along the TD indicating<br />
that most of basal planes nearly parallel to the extrusion axis. Two strong shear components<br />
are observed in pole figure which should be attributed to the mismatched flow speed of material<br />
at four corners of the quadratic die. After 1 pass, the density poles is evenly distributed<br />
around ED and two fiber textures are formed, the stronger one is perpendicular to<br />
the extrusion direction, the weaker one is rotated by about 35º from the normal direction to<br />
ED-TD plane(seen in Fig. 3). The pole distribution becomes asymmetrical around TD as well<br />
as ED after 2 passes and the (0002) pole figure reveals the formation of a maximum located<br />
at about 40º from ND towards ED and 20º from ND towards TD. However, there is still a part<br />
of basal texture parallel to ND. The pole distribution becomes more unsymmetrical with increasing<br />
number of ECAP passes up to 4 such that the basal poles rotated around TD as<br />
well as ED, and the quantity of basal planes paralleling to ED become much smaller. On the<br />
whole, with increasing number of ECAP passes, the basal texture is progressively strengthened,<br />
however, the intensity of ( 10 1 0 ) and (10 11) texture are nearly constant.<br />
The different basal plane orientation leads to the different schmid factor, which will have significant<br />
effect on the microplasticity of pure Mg. The effect of texture on the microplasticity of<br />
pure Mg will be published elsewhere later.<br />
Conclusions<br />
The as-extruded pure Mg was subjected to ECAP at 250 o C up to 4 passes, and the texture<br />
evolution during ECAP was investigated. Some main conclusions can be obtained as follow:<br />
– Most of basal planes of pu–re Mg nearly parallel to the extrusion axis after hot extrusion.<br />
232
– The typical fiber texture was formed after ECAP, the pole distribution becomes<br />
more and more asymmetrical owing to rotating around TD as well as ED with increasing<br />
number of ECAP passes due to the shear stress induced by the shear plane which is 45º<br />
from ED.<br />
– With increasing number of ECAP passes, the basal texture is gradually strengthened,<br />
however, the intensity of ( 10 1 0 ) and (10 11) textures are changed slightly.<br />
X<br />
ED<br />
(0002)<br />
( 1010) (1011)<br />
P m =3.0 P m =2.1 P m =1.4<br />
ND<br />
TD<br />
As-extruded<br />
P m =4.5 P m =2.3 P m =1.5<br />
1 pass<br />
P m =5.5 P m =2.1 P m =1.4<br />
2 passes<br />
P m =6.0 P m =2.3 P m =1.5<br />
4 passes<br />
Figure 2: (0002), ( 10 1 0 ) and (10 11) complete pole figures on projection plane X of the as-extruded<br />
and ECAP processed pure Mg from 1 pass up to 4 passes.<br />
233
Y<br />
ED<br />
(0002)<br />
P m =3.0<br />
( 1010<br />
)<br />
P m =2.1<br />
TD<br />
ND<br />
As-extruded<br />
Shear plane<br />
P m =4.5<br />
P m =2.3<br />
1 pass<br />
P m =5.5<br />
P m =2.1<br />
2 passes<br />
P m =6.0<br />
P m =2.3<br />
4 passes<br />
Figure 3: (0002) and ( 10 1 0 ) complete pole figures on projection plane Y of the as-extruded and<br />
ECAP processed pure Mg from 1 pass up to 4 passes.<br />
References<br />
[1] BL. Mordike, T. Ebert, Mater. Sci. Eng. A, 302, 37 (2001).<br />
[2] R.Z. Valiev, R.K. Islamgaliev, I.V. Alexandrov, Progr. Mater. Sci., 45, 103 (2000).<br />
[3] M.Y. Zheng, S.W. Xu, X.G. Qiao, K. Wu, S. Kamado,Y. Kojima, Mater. Sci. Eng. A, 483-484, 564<br />
(2008).<br />
[4] J. Adrien, E. Maire, R. Estevez, J.C. Ehrstrom, T. Warner, Acta Mater., 52, 1653–1661 (2004).<br />
[5] R.E. Lee, W.J.D. Jones, J. Mater. Sci., 9, 469–475 (1974).<br />
[6] Satyam Suwas, G. Gottstein, R. Kumar, Mater. Sci. Eng. A, 471, 1–14 (2007).<br />
[7] J.A. del Valle, F. Carreno, O.A. Ruano. Acta Mater., 54, 4247–4259 (2006).<br />
234
EXPERIMENTAL REPORT<br />
GeNF<br />
TEX-2<br />
Measurement of Textures in Ti-Alloys<br />
Proposers:<br />
Emad Maawad 1 , Lothar Wagner 1<br />
1 Clausthal University of Technology, Clausthal, Germany<br />
Co-Proposer:<br />
Experimental Team:<br />
User Group Leader:<br />
Instrument Responsible:<br />
Heinz-Günter Brokmeier 1<br />
Weimin Gan 1, 2 , Bernd Schwebke 1, 2<br />
2 GKSS Research Centre <strong>Geesthacht</strong>, Germany<br />
Heinz-Günter Brokmeier 1<br />
Heinz-Günter Brokmeier 1<br />
Date of Experiment: 8 th – 16 th July 2008, 25 th – 28 th August 2008<br />
Objectives<br />
Texture is affected by mechanichal surface tratments, such as shot peening and ball<br />
burnishing. This is a result of the deformation of near-surface regions of the components.<br />
The main aim of this experiment is to measure the bulk textures [1–3] of Ti-2.5Cu and<br />
TIMETAL-LCB Ti-alloys by applying the neutron diffraction technique using TEX-2 [4].<br />
Consequently, near-surface texture in shot peened specimens can be investigated using<br />
conventional X-rays diffraction.<br />
Experiment<br />
The texture was measured in Ti-2.5Cu and Timetal LCB Ti-alloys by applying neutron diffraction<br />
technique. Table 1 shows the diffractometer parameters which were used in this experiment.<br />
Table 1: Diffractometer parameters.<br />
Wave length<br />
1.332 Å<br />
Monochromator<br />
Cu(111)<br />
Detector He-Single, 20 x 40 mm 2<br />
Slits sizes<br />
Sample environment<br />
Primary Slit: 22x22 mm 2<br />
Detector Slit: 22x22 mm 2<br />
Eulerian cradle.<br />
Achievements and Main Results<br />
The bulk texture of the hot-rolled Ti-2.5Cu has been studied by using neutron diffraction because<br />
it provides a large beam cross section in terms of the measured pole figures (Fig. 1)<br />
Figure 1: Measured pole figures of the rolled Ti-2.5Cu.<br />
235
As seen in Fig. 1, the basal poles are tilted about 15° towards TD and about 10° towards RD.<br />
This deviation from the perfect basal pole figure usually observed on commercially pure titanium<br />
is probably caused by the solid solution alloying element copper. In contrast, in coldrolled<br />
commercially pure titanium, the basal poles {00.1} are tilted ~ ± 20° away from the<br />
normal direction ND towards the transverse direction TD because the c/a ratio of (α-Ti is<br />
1.587 (
a) b)<br />
c) d)<br />
α{00.2}<br />
Figure 3: Measured pole figures of the swaged Timetal LCB.<br />
a) b)<br />
α{00.2}<br />
Figure 4: Measured pole figures of the overheated-swaged Timetal LCB.<br />
a) b)<br />
Figure 5: Measured pole figures of the recrystallized Timetal LCB.<br />
237
a) b)<br />
c) d)<br />
Figure 6: Measured pole figures of the rolled Timetal LCB.<br />
Acknowledgements<br />
I am indebted to the German Research Foundation (DFG) for financial support of the investigations,<br />
project number (BR961/5-1). I’d like to thank W. Gan, B. Schwebke, and P. Spalthoff<br />
for their helping and suggestions.<br />
References<br />
[1] H.-G. Brokmeier, Global crystallographic textures obtained by neutron and synchrotron radiation,<br />
Physica B 385-386 (2006) 623–625.<br />
[2] H.-G. Brokmeier, Neutron diffraction texture analysis, Physica B 234 236 (1997) 977–979.<br />
[3] H.J. BUNGE, Advantages of Neutron Diffraction in Texture Analysis, Textures and Microstructures,<br />
1989, Vol. 10, pp. 265–307.<br />
[4] H.-G. Brokmeier, TEX-2 the texture diffractometer at the GKSS-research centre, Physica B 234-<br />
236 (1997) 1144–1145.<br />
238
EXPERIMENTAL REPORT<br />
GeNF<br />
TEX-2<br />
Cast and rolling textures of NiMnGa alloys<br />
Proposer:<br />
Co-Proposer:<br />
Experimental Team:<br />
User Group Leader:<br />
Instrument Responsible:<br />
Werner Skrotzki 1 , 1 Institut für Strukturphysik, Abteilung<br />
Metallphysik, Technische Universität Dresden, Dresden, Germany<br />
Robert Chulist 1<br />
Weimin Gan 2, 3 , Bernd Schwebke 2, 3<br />
2 Clausthal University of Technology, Clausthal, Germany,<br />
3 GKSS Research Centre <strong>Geesthacht</strong>, Germany<br />
Werner Skrotzki 1<br />
Heinz-Günter Brokmeier 2<br />
Date(s) of Experiment: 16 th – 19 th July 2007, 19 th – 23 rd August 2007<br />
Objectives<br />
NiMnGa alloys close to the stoichiometric composition Ni 2 MnGa belong to the quite new family<br />
of ferromagnetic shape memory alloys. These alloys are characterized by magnetically<br />
induced reorientation (MIR) resulting from the motion of twin boundaries under the influence<br />
of a magnetic field [1, 2]. Plastic deformation of NiMnGa single crystals by twin boundary<br />
motion leads to a maximum magnetic field induced strain (MFIS) of about 10 %. To our<br />
knowledge, until now MFIS has not been reported for NiMnGa polycrystals. However, since<br />
for broad technical applications growth of single crystals is quite time consuming and cost<br />
intensive it is necessary to investigate polycrystalline samples on their suitability for MFIS. To<br />
approach MFIS of single crystals the crystallographic texture of polycrystalline samples is of<br />
particular concern. Thus, the present work focuses on texture analyses of NiMnGa polycrystals<br />
fabricated with two different techniques: directional solidification and plastic deformation<br />
by hot rolling. To examine the texture of coarse grained NiMnGa alloys in a statistically relevant<br />
way diffraction of neutrons has been applied. The texture results are discussed with<br />
respect to the material, processing and phase transformations.<br />
During cooling from high temperatures NiMnGa alloys experience different phase transitions,<br />
from B2 (cubic) via L2 1 (cubic, austenite) to martensitic structures (7M modulated, orthorhombic,<br />
space group Fmmm; 5M modulated and non-modulated, both tetragonal, space<br />
group I4mmm) [3–5]. The martensitic crystal structures in NiMnGa are strongly composition<br />
dependent [6–8]. In the hot rolled alloy investigated here 7M and NM martensitic structures<br />
have been observed simultaneously. In general, the phase transformations from austenite to<br />
martensite are characterized by specific orientation relationships with some variants being<br />
preferred.<br />
Experiment<br />
The two polycrystalline samples studied were fabricated by directional solidification<br />
(Ni 48 Mn 30 Ga 22 ) and hot rolling (Ni 50 Mn 30 Ga 20 ). The martensitic transition for Ni 48 Mn 30 Ga 22<br />
takes place at a temperature of -5–5 °C, that means at room temperature the alloy is in the<br />
austenitic state, and for Ni 50 Mn 30 Ga 20 at 90–100 °C. Directional solidification was carried out<br />
under Ar atmosphere. A prealloy was prepared by induction melting of pure elements<br />
(Ni 99.98, Mn 99.8, Ga 99.999) [9]. The casting process was performed in an Indrudet S investment<br />
casting machine followed by furnace-cooling to room temperature. The cast sample<br />
239
had a diameter and length of 10 mm and 50 mm, respectively. Coarse columnar grain growth<br />
was achieved by using a hot mould with a cooled copper plate at the bottom. The mould was<br />
heated in a separate furnace to a temperature close to melting. The cylindrical sample cut<br />
from the cast ingot above about 1 cm from the bottom had a diameter and height of 8 mm<br />
and 15 mm, respectively. The second sample was plastically deformed by hot rolling. The<br />
ingot (7.9 x 11.9 x 44 mm 3 ) canned in steel, was rolled at a temperature of 1000 °C up to<br />
50 % reduction and then air-cooled to room temperature.<br />
The texture of the two samples was measured by neutron diffraction at GKSS Research<br />
Centre <strong>Geesthacht</strong>, Germany. Due to the high penetration depth of neutrons, texture measurements<br />
with this radiation in transmission allows for collecting orientation data from a large<br />
sample volume, i.e. with a good grain statistics. Due to the fact that the rolled sample consists<br />
of more than one phase, some diffraction peaks from different phases may overlap.<br />
Therefore, the orientation distribution functions (ODF) were only calculated with the measured<br />
pole figures belonging to non-overlapping peaks. With the ODF all pole figures desired<br />
can be recalculated. Processing of the texture data was done with the Labotex software.<br />
Achievements and Main Results<br />
The directionally solidified sample is characterized by long columnar grains with a width of<br />
about 0.5 mm. The austenitic phase has a strong fibre texture around the growth direction<br />
(GD) (Fig. 1).<br />
The microstructure of the hot rolled alloy is recrystallized with an equiaxed grain size of about<br />
400 m. Neutron diffraction shows that the polycrystal investigated simultaneously contains<br />
two martensitic structures, 7M and NM. The texture of both phases investigated by neutron<br />
diffraction is a weak {111} rolling texture (Figs. 2, 3). It has been formed during hot<br />
rolling in the B2 phase field.<br />
Figure 1: {200}, {220}, {111} pole figures of the austenitic phase in the directionally solidified sample<br />
(intensities: 1.0, 2.0, 2.5, 3.3, 4.9, 7.3, 9.6, 12.0 mrd, GD = growth direction, TD = transverse direction).<br />
240
Figure 2:<br />
{112} and {111} pole figures of the<br />
orthorhombic 7M phase in the hot<br />
rolled sample (intensities: 1.0, 1.5,<br />
2.0, 1.5, 3.0, 3.4 mrd, RD = rolling<br />
direction, TD = transverse direction).<br />
Figure 3:<br />
{112} and {111} pole figures of the<br />
tetragonal NM phase in the hot<br />
rolled sample (intensities: 1.0, 1.3,<br />
1.6, 1.9, 2.2, 2.5 mrd, RD = rolling<br />
direction, TD = transverse direction).<br />
The fibre texture existing in the directionally solidified NiMnGa alloy is typical for cast<br />
cubic crystals with the fibre axis aligned along the temperature gradient determining<br />
GD [10].<br />
The texture of the hot rolled alloy most probably has been produced by dynamic recrystallization<br />
in the B2 field. It is a typical recrystallization texture of body-centred cubic metals [11].<br />
No obvious variant selection took place during phase transformation from the cubic L2 1<br />
phase to the martensitic phases.<br />
241
Acknowledgements<br />
The work has been carried out within the priority program SPP 1239 “Magnetic shape Memory:<br />
Change of microstructure and shape of solid materials by external magnetic fields” of the<br />
German Research Society (DFG) under contract Sk 21/22-1. Thanks are due to H.-T. Reiter<br />
for sample cutting.<br />
References<br />
[1] Müllner, P., Chernenko, V.A., Wollgarten, M., Kostorz, G., Appl. Phys. Lett. 92 (2002) 6708.<br />
[2] Müllner, P., Chernenko, V.A., Kostorz, G., J. Magn. Magn. Mater. 267 (2003) 325.<br />
[3] Chernenko, V.A., Scripta Mater. 40 (1999) 523.<br />
[4] Ullakko, K., Huang, J.K., Kantner, C., Kokorin, V.V., O’Handley, R.C., Appl. Phys. Lett. 69 (1996)<br />
523.<br />
[5] Martynov, V.V., J. de Physique IV 5 (1995) 5.<br />
[6] Pons, J., Chernenko, V.A., Santamarta, R, Cesari, E., Acta Mater. 48 (2000) 3027.<br />
[7] Chernenko, V.A., Pons, J., Segui, C., Cesari, E., Acta Mater. 50 (2002) 53.<br />
[8] Wedel, B., Suzuki, M., Murakami, Y., Wedel, C., Suzuki, T., Shinto, D., Itagaki, K., J. Alloys<br />
Comp. 290 (1999) 137.<br />
[9] Pötschke, M., Gaitzsch, U., Roth, S., Rellinghaus, B., Schultz, L., J. Magn. Magn. Mater. 316<br />
(2007) 383.<br />
[10] Wassermann, G., Grewen, J., Texturen metallischer Werkstoffe, Springer, Berlin (1962)<br />
[11] Raabe, D., Lücke, K., Mater. Sci. Eng. 157-162 (1994) 597.<br />
242
EXPERIMENTAL REPORT<br />
GeNF<br />
TEX-2<br />
Texture Characterization of CO 3 Ca Biological Samples<br />
Proposer:<br />
Co-Proposer(s):<br />
Experimental Team:<br />
User Group Leader:<br />
Instrument Responsible:<br />
Raúl Eduardo Bolmaro 1 , 1 Instituto de Física Rosario.<br />
FCEIA-UNR. Bv. 27 de febrero 210 bis. Rosario. Argentina<br />
Heinz-Günter Brokmeier 2<br />
2 Clausthal University of Technology, Clausthal, Germany<br />
Bernd Schwebke 2, 3 , Weimin Gan 2, 3<br />
3 GKSS Research Centre <strong>Geesthacht</strong>, Germany<br />
Raúl Eduardo Bolmaro 1<br />
Heinz-Günter Brokmeier 2<br />
Date(s) of Experiment: 12 th – 30 th September 2008<br />
Objectives<br />
Biological structural materials have received special attention due to their outstanding properties<br />
in spite of being built with relatively simple and fragile materials. Mollusks with conchs<br />
(gastropods and bivalves) are a very interesting study case. The conch is constituted mainly<br />
of CO 3 Ca in either one or both crystalline forms, calcite and/or aragonite, in a very oriented<br />
structure making a composite with a biological copolymer. The whole structure is differentiated<br />
in layers were the orientation varies from layer to layer. The preferential orientations of<br />
the calcite lamellas or aragonite crystals vary from species to species and that is usually an<br />
unequivocal way of identification and classification.<br />
The current proposal asks for the measurement of textures of different species of gastropods<br />
and bivalves. The purpose is the contribution to a systematic of organization as well as the<br />
understanding of mechanical behavior and its possible relationship with ecological niche or<br />
evolution trends.<br />
Experiment<br />
Seven samples were measured in this opportunity.<br />
Gastropods: 1 sample of Busycon<br />
perversum, 1 of Busycon carica and 1 of<br />
Pachycymbiola brasiliana Bivalves: 2 of<br />
Eurhomalea lenticulares and 2 of Venus<br />
antigua. The experimental setup was a Cu<br />
(111) monochromator (wavelength of 1.33 Å),<br />
a sample to detector distance from 165 cm<br />
and a large beam cross section to cover the<br />
whole sample. Four pole figures (002),<br />
(011), (200) and (210) were sufficient for<br />
quantitative texture description.<br />
Essential is the sample orientation as shown<br />
in the following picture.<br />
243
Achievements and Main Results<br />
The results are shown divided between textures belonging to gastropod and bivalve families.<br />
Gastropods include a sinister species like Busycon perversum and the bivalves were measured<br />
for both right and left specimens. Gastropod’s textures clearly share the same orthorhombic<br />
symmetry while the bivalves are almost axis-symmetric with just some orthorhombic<br />
symmetry development.<br />
References<br />
[1] Addadi, L., Joester, D., Nudelman, F. and Weiner, S.. (2005). Concept: Mollusk Shell Formation: A<br />
Source of New Concepts for Understanding Biomineralization Processes. Chemistry – A European<br />
Journal, 12, 4: 980–987.<br />
[2] Chateigner, D., Hedegaard, C. and Wenk, H.-R. (2000). Mollusk Shell Microstructures and Crystallographic<br />
Textures. J. Struct. Geology 22: 1723-1735.<br />
[3] Chateigner, D., Morales, M. and Harper, E.M. (2002) QTA of Prismatic Calcite Layers of Some<br />
Bivalves, a link to Trichite Ancestrals. Mat. Sci. Forum 408-412: 1687–1692.<br />
244
EXPERIMENTAL REPORT<br />
GeNF<br />
TEX-2<br />
Texture Characterization of Pure Sn Deformed by ECAE<br />
Proposer:<br />
Co-Proposer(s):<br />
Experimental Team:<br />
User Group Leader:<br />
Instrument Responsible:<br />
Raúl Eduardo Bolmaro 1 , 1 Instituto de Física Rosario.<br />
FCEIA-UNR. Bv. 27 de febrero 210 bis. Rosario. Argentina<br />
Heinz-Günter Brokmeier 2<br />
2 Clausthal University of Technology, Clausthal, Germany<br />
Bernd Schwebke 2, 3 , Weimin Gan 2, 3<br />
3 GKSS Research Centre <strong>Geesthacht</strong>, Germany<br />
Raúl Eduardo Bolmaro 1<br />
Heinz-Günter Brokmeier 2<br />
Date(s) of Experiment: 20 th – 27 th October 2008<br />
Objectives<br />
ECAE has been one of the most prolific techniques in the study of severe deformation on<br />
metallic alloys. Severe deformation on low melting temperature alloys has been scarcely<br />
studied due to the high dynamic recrystallization effects they usually present. Previous ECAE<br />
deformation experiments performed in a 120 o tool at room temperature in pure Pb and near<br />
eutectic composition Pb-62%Sn alloy showed the existence of such recrystallization effects.<br />
The results showed a striking rotated cube texture that was explained by modelling a recrystallization<br />
behaviour of the kind known as Geometrical Dynamic Recrystallization. On the<br />
intended experiments we attempt to complement those results by measuring pure Sn samples.<br />
The samples were passed 5 times in a route A. Textures should give a guide of the<br />
expected behaviour for the composite Pb-62%Sn sample. Together with the pure Pb results<br />
the experiments should give an idea about the dragging force exerted from one phase on the<br />
other during large deformation processes. Due to the high absorption presented by Sn and<br />
the soft nature of the surface that difficult its proper polish for X-rays, the textures need to be<br />
measured by neutron diffraction.<br />
The proposed experiment consists on the measurement of at least four pole figures for each<br />
sample, (200), (101), (220) and (211), with the purpose of whole analysis of texture and calculation<br />
of the due Orientation Distribution Function. A total of 24 pole figures would be necessary<br />
for completely characterize texture evolution for as received and after deformation<br />
textures.<br />
Experiment<br />
Five samples were measured after 1 through<br />
5 passes. Textures were taken on the whole<br />
section at the middle part of the length of the<br />
samples. Sample preparation is to cut cubic<br />
samples as shown in figure 1.<br />
Figure 1:<br />
ECAE sample after 5 passes and cubic Sn<br />
sample for global neutron texture measurement.<br />
245
Achievements and Main Results<br />
The results are shown for the (220) pole figure for the five passes, see figure 2. The texture<br />
sharpness strengthens until 4 th pass, staying almost constant the last step. Sn is a tetragonal<br />
symmetry material and the available slip systems are poorly determined. ECAE on this material<br />
may offer the opportunity for further investigation of deformation mechanisms.<br />
Figure 2: Texture evolution of tetragonal Sn during ECAE from 1 to 5 passes.<br />
References<br />
[1] H.-G. Brokmeier, W. Böcker and H.J. Bunge. Neutron Diffraction Texture Analysis in Extruded<br />
Al-Pb Composites. Text. and Microstructures, 8-9, 429–441 (1988).<br />
[2] H.-G. Brokmeier. Experimental textures of Al-Pb. Al-Cu and Fe-Cu metal-metal Composites. Mat.<br />
Sci. Eng A175, 131–139 (1994).<br />
[3] H.-G. Brokmeier, K. Helming and T. Eschner. Pb Texture of Pb-Al Composites Determined by<br />
the Iterative Series Expansion Method and the Component Method. Mat. Sci. Forum. 157-162,<br />
633–638 (1994).<br />
[4] R.E. Bolmaro, V.L. Sordi, M. Ferrante, WeiMin Gan and H.-G. Brokmeier. Cube texture due to<br />
dynamic recrystallization in Pb and PbSn alloys under Equal Chanel Angular Extrusion processing.<br />
15 th ICOTOM. June 1 st –5 th , 2008. Pittsburgh. USA.<br />
[5] R.E. Bolmaro, V.L. Sordi, M. Ferrante, WeiMin Gan and H.-G. Brokmeier. Dynamic recrystallization<br />
textures in Sn, Pb and eutectic PbSn composites deformed by ECAP. 18 Congresso<br />
CBECIMAT. 24–28 Novembro 2008. Porto de Galinha. Brasil.<br />
246
EXPERIMENTAL REPORT<br />
GeNF<br />
POLDI<br />
Polarised diffractometer POLDI<br />
Short Instrument Description:<br />
With the polarised diffractometer 3-D depolarisation analysis is used to investigate magnetic<br />
properties and correlations in magnetic materials. With minor modifications a time of flight<br />
option in non-polarised mode is additionally available for the purpose of dosemeter calibration.<br />
Local Contact:<br />
Jochen Fenske<br />
Phone/Fax : +49 4152 87-1224 / +49 (0)4152 87-1338<br />
e-mail: jochen.fenske@gkss.de<br />
Dr. Dieter Lott<br />
Phone/Fax : +49 4152 87-1372 / +49 (0)4152 87-1338<br />
e-mail: dieter.lott@gkss.de<br />
Schematic View of POLDI:<br />
R 1<br />
Ana<br />
D<br />
SSB<br />
R2<br />
F<br />
Z<br />
Pol<br />
VS<br />
X<br />
Y<br />
P = D P 0 Set-up for full 3-dimensional neutron<br />
depolarisation analysis in the transmitted beam.<br />
Instrument Details:<br />
Location at FRG-1:<br />
beamline 7, thermal neutrons<br />
cross section 10 x 4 cm 2 ,<br />
Polariser / monochromator (Pol) Cu 2 MnA (111), PG(002), Si (311) doubly focussing;<br />
helical slot selector (VS)<br />
Take-off-angle: 10° < 2 M < 65°<br />
Wavelength:<br />
λ = 0.1 to 0.36 nm,<br />
2 nd order suppression by velocity selector (VS)<br />
Flux at sample position:<br />
max = 0.8 · 10 5 cm -2 s -1 (polarised)<br />
Analyser (Ana):<br />
Co/Ti-supermirror<br />
Overall polarisation: 0.94<br />
3D depolarisation analysis in<br />
transmitted beam:<br />
Sample environment<br />
fitting in the magnetically shielded<br />
sample box (SSB) for<br />
3D depolarisation analysis:<br />
accuracy < 1 % for any component of D<br />
– refrigerator T >12 K,<br />
– DC magnetic field < 160 A/cm<br />
– pulsed field < 8.0 kA/cm<br />
Detector (D):<br />
3 He-counter<br />
Instrument control/data acquisition: remote internet PC control<br />
IEEE bus, serial bus and special interfaces<br />
247
248
EXPERIMENTAL REPORT<br />
GeNF<br />
POLDI<br />
Investigation of temperature behaviour of the magnetic phase transition<br />
in Fe 50 Pt 50-x Rh x thin film<br />
Proposer:<br />
Co-Proposer(s):<br />
G. Mankey 1<br />
1 MINT Center, University of Alabama,Tuscalosa, Al, USA<br />
D. Lott 2 , J. Fenske 2<br />
2 GKSS Research Centre <strong>Geesthacht</strong>, Germany<br />
Experimental Team:<br />
User Group Leader:<br />
Instrument Responsible:<br />
J. Fenske 2<br />
A. Schreyer 2<br />
J. Fenske 2 , D. Lott 2<br />
Date(s) of Experiment: March – July 2008<br />
Introduction<br />
FePt-based alloys are typically the material of choice for magnetic information storage media.<br />
The high magnetic moment of Fe gives a large magnetization and the large atomic number<br />
of Pt results in a high magnetic anisotropy. This combination enables the written bits to be<br />
smaller than ever before, since magnetic grains with a high magnetic anisotropy are more<br />
thermally stable. Another desirable feature of FePt films is that the anisotropy often results in<br />
perpendicular magnetization, which is the preferred orientation for current media.<br />
One way to control the magnetic properties in these materials is through the introduction of a<br />
third element into the crystal matrix e.g. Rh. When Rh is added to replace Pt in the equiatomic<br />
alloy, new magnetic phases emerge.<br />
Bulk Fe 50 Pt 50-x Rh x samples studied by magnetization measurement refer to three different<br />
magnetic phase transitions with increasing temperature: (I) An antiferromagnetic (AF)-<br />
paramagnetic (PM) transition for 30 < x < 14.25, (II), an AF-ferromagnetic (FM) transition for<br />
14.25 < x < 9.5 and, (III), a FM-PM transition 9.5 < x < 0. The regime (II) is of particular interest<br />
for some potential applications due to the AF-FM phase transition, for example thermally<br />
switchable exchange bias coupling. It is also known that the phase transition is influenced by<br />
the film thickness.<br />
In earlier reports we showed that in a 200 nm Fe 50 Pt 40 Rh 10 film instead of an AF-FM phase<br />
transition an AF-AF transition takes place. In this report we show the behaviour of a 200 nm<br />
Fe 50 Pt 25 Rh 25 film and the behaviour of a 100 nm thin Fe 50 Pt 40 Rh 10 film.<br />
Results and Discussion<br />
With the neutron diffractometer POLDI temperature dependent measurements were performed<br />
in a temperature range between 150 K and 475 K on the Fe 50 Pt 25 Rh 25 film. The wavelength<br />
was set to 1.8 Å and a velocity selector was used for the λ/2 suppression. For the<br />
100 nm Fe 50 Pt 40 Rh 10 film temperature dependent measurements were carried out between<br />
13 K and 325 K. In this case no velocity selector was used, which leads to a λ/2 contamination<br />
of 4.8 %.<br />
Fe 50 Pt 25 Rh 25<br />
The neutron diffraction measurements show six peaks, three in-plane and three out-of-plane.<br />
Structure factor calculations for the L1 0 configuration show that the (00½), (½00) and (100)<br />
249
eflections are of pure antiferromagnetic nature, while the (002), (200) and (001) peaks are<br />
nuclear bragg peaks with a possible ferromagnetic contribution.<br />
Opposite to the intensity of the half order peaks of the Fe 50 Pt 40 Rh 10 film the intensity of the<br />
antiferromagnetic (00½) and (½00) peak of the Fe 50 Pt 25 Rh 25 film increase with increasing<br />
temperature up to 280K, 350K respectively. With higher temperature the intensity decreases<br />
again.<br />
The intensity of the (100) reflection is nearly zero about the entire temperature range.<br />
The integrated intensities of the (002), (200) and (001) reflections are constant within the<br />
error bars over the entire temperature range. Structure factor calculations indicate these<br />
peaks are pure nuclear bragg-peaks with no FM contribution.<br />
Comparing all six peak intensities no FM contribution could be found. On the other hand, an<br />
AF contribution is observable with increasing temperature. The intensity maximum for the AF<br />
out-of-plane reflection is at around 280K and for the in-plane reflection at around 350 K.<br />
integrated intensity [arb. units]<br />
150<br />
100<br />
50<br />
(002)<br />
(200)<br />
0<br />
100 150 200 250 300 350 400 450 500<br />
20<br />
15<br />
10<br />
5<br />
0<br />
30<br />
25<br />
20<br />
15<br />
10<br />
(001)<br />
(100)<br />
100 200 300 400 500<br />
5<br />
0<br />
150 200 250 300 350 400 450<br />
Temperature [K]<br />
(001/2)<br />
(1/200)<br />
Figure 1:<br />
Temperature dependence of the integrated neutron<br />
diffraction intensity of three in-plane (200), (100), (½00)<br />
(open circles) and three out-of-plane (002), (001),<br />
(00½) reflections (solid squares) of the Fe 50 Pt 40 Rh 10<br />
film. The lines of the (1/200) and (001/2) peak is a<br />
guide to the eye. Further details are in the text.<br />
Fe 50 Pt 40 Rh 10<br />
Contrary to the 200nm Fe 50 Pt 40 Rh 10 film significant<br />
intensity were only detected at four peaks, two<br />
out-of-plane and two in-plane. As discussed above,<br />
the (002) and (200) peaks are of nuclear nature<br />
with a possible FM contribution and the (00½) and<br />
(½00) reflections are pure antiferromagnetic peaks.<br />
If we consider the λ/2 contamination of the second<br />
order peaks the (001) and (100) peak intensities<br />
are close to zero.<br />
Here we point out that measurements on D23 at the high flux reactor ILL with its higher neutron<br />
flux shows that the first order peaks also exist for the 100nm film and show the same<br />
behaviour as for the 200 nm film. The (001) peak is nearly constant and the (100) peak intensity<br />
increases up to 350 K and than decreases.<br />
The half order peaks has the same temperature behaviour as for the 200 nm Fe 50 Pt 40 Rh 10<br />
film. They decrease with increasing temperature. The transition temperature for the (00½)<br />
out-of-plane peak is with 332 K nearly the same as it is for the 200 nm film. The (½00) reflection<br />
shows only a little peak intensity which vanishes around 250 K. This is about 30 K lower<br />
than for the 200 nm film. The (002) and (200) reflections also behave like the second order<br />
reflections for the 200 nm film. They are constant within the error bars over the entire temperature<br />
range. That is a clear evidence of their nuclear nature.<br />
250
Figure 2:<br />
Temperature dependence of the integrated neutron<br />
diffraction intensity of two in-plane (200), (½00)<br />
(open circles) and two out-of-plane (002), (00½)<br />
reflections (solid squares) of the 100 nm<br />
Fe 50 Pt 40 Rh 10 film. The line for the (00½) (solid line)<br />
is a guide to the eye. Further details are in the<br />
text.<br />
Summary<br />
The magnetic structure of both films could be<br />
solved by neutron diffraction measurements.<br />
The data reveal an AF-PM phase transition<br />
for the 100 nm Fe 50 Pt 40 Rh 10 film above 450 K.<br />
The film also shows an additional transition<br />
from an AF out-of-plane to AF in-plane order at<br />
about 300 K similar to the film with 200 nm<br />
thickness. Contrary to this film the Fe 50 Pt 25 Rh 25<br />
film undergoes two phase transitions. At<br />
about 150 K a PM-AF transition occurs while<br />
at about 450 K the film becomes PM again.<br />
integrated intensity [arb. units]<br />
80<br />
60<br />
40<br />
20<br />
0<br />
10<br />
8<br />
6<br />
4<br />
2<br />
0<br />
30<br />
25<br />
20<br />
15<br />
10<br />
5<br />
0<br />
0 50 100 150 200 250 300 350<br />
0 50 100 150 200 250 300 350<br />
(001/2)<br />
(1/200)<br />
0 50 100 150 200 250 300 350<br />
Temperature [K]<br />
(002)<br />
(200)<br />
(001)<br />
(100)<br />
Outlook<br />
Following these measurements and results, a detailed study of the film thickness is planned<br />
for the Fe 50 Pt 50-x Rh x film for x = 10. Moreover, an investigation of the influence of the substrate<br />
is interesting and will be studies. Therefore a series of samples grown on sapphire will<br />
be fabricated to investigate the differences to the films grown on MgO.<br />
References<br />
[1] Takizawa, K; Ono, T; Miyajima, H, Journal of Magnetism and Magnetic Materials 226: 572 Part 1<br />
Sp. Iss. SI MAY 2001<br />
[2] Thiele, J-U, Maat, S, Fullerton, EE, Applied Physic Letters 82 2859(2003)<br />
[3] P. Mani, GeNF – Experimental Report 2006. GKSS Report 2007/6, p. 215<br />
251
252
EXPERIMENTAL REPORT<br />
GeNF<br />
GENRA-3<br />
<strong>Geesthacht</strong> neutron radiography and tomography facility GENRA-3<br />
Short Instrument Description<br />
The <strong>Geesthacht</strong> neutron radiography and tomography facility serves as an instrument for<br />
non-destructive testing and damage analysis of materials and technical structures by static<br />
and dynamic imaging. The ability of light elements, e.g. hydrogen or boron, to absorb neutrons<br />
allows unique analysis possibilities.<br />
Local Contact:<br />
Dr. P. Klaus Pranzas<br />
Phone/Fax : +49 4152 87-1326 / +49 4152 8-41326<br />
e-mail: pranzas@gkss.de<br />
Schematic View of GENRA-3:<br />
Instrument Details:<br />
Location at FRG-1:<br />
beamline 13, thermal neutrons<br />
Collimation ratio: 100 to 300<br />
Flux at sample position: Φ therm = 1.4 · 10 6 cm -2 s -1<br />
Φ epi = 8 · 10 3 cm -2 s -1<br />
with 4 cm Bi-filter at position: 2 m from beam exit<br />
available filters: 9 cm Bi-filter combined<br />
with 10 cm Be 0.2 cm Cd<br />
max. size of specimen: 100 x 200 cm 2<br />
Image: 15 x 15 cm 2 to 45 x 45 cm 2<br />
Detecting: direct imaging<br />
indirect imaging<br />
Gadolinium foil: max 14 x 17 inch<br />
Gd-scintillation screen connected to an image intensifier<br />
video camera<br />
transfer material: Indium, Dysprosium<br />
Sample handling<br />
Remote control of specimen, e.g. for scan purposes<br />
253
254
EXPERIMENTAL REPORT<br />
GeNF<br />
GENRA-3<br />
Neutron Radiography Characterization of Hydride Tanks<br />
Proposer:<br />
Co-Proposer(s):<br />
Experimental Team:<br />
Group leaders:<br />
Instrument Responsible:<br />
P. Klaus Pranzas 1 , 1 GKSS Research Centre <strong>Geesthacht</strong>, Germany<br />
Oliver Metz 1 , Martin Dornheim 1<br />
Oliver Metz 1 , Heinz-Werner Schmitz 1<br />
Rüdiger Bormann 1 , Andreas Schreyer 1<br />
Heinz-Werner Schmitz 1 , P. Klaus Pranzas 1<br />
Date(s) of Experiment: December 2008<br />
Objective<br />
The aim of this study is the in situ characterisation of the hydrogen absorption and desorption<br />
in light metal hydrides with neutron radiography in order to visualise the hydrogenation and<br />
powder compaction of the material inside the tank. As a first step to the in situ study, a special<br />
aluminium tank was constructed and filled with the commercially available room temperature<br />
metal hydride powder “C5”. This material is used for the reversible storage of hydrogen<br />
at ambient conditions. It contains e.g. Mn (51.31 %), Ti (27.13 %), V (13.95 %), Fe (2.98 %),<br />
Zr (2.97 %) and Al (0.27 %). The available hydrogen storage capacity is approximately<br />
1.5 wt.-%. These investigations are necessary for the optimisation of the construction of<br />
metal hydride hydrogen storage tanks.<br />
Experiment<br />
A new tank design was developed optimized for in-situ neutron radiography experiments<br />
during hydrogen absorption and desorption. The enforced aluminium tank with a constant<br />
powder bed thickness of 15 mm allows an operating pressure of up to 50 bars. Using hydrogen<br />
pressures of up to 30 bars the maximum amount of hydrogen is about 70 litres in a free<br />
tank volume of 165 cm³. The new tank was filled with approx. 400 g metal hydride powder “C5”.<br />
The neutron radiography experiments were performed in the irradiation chamber of<br />
GENRA-3 at distance P = 1 m in the hutch, resulting in a distance to the source of about 3 m.<br />
The neutron beam parameters are:<br />
P [m] 3<br />
Size [cm 2 ] 23 x 23<br />
Flux [n cm -2 s -1 ] 2.7 · 10 6<br />
L/D 150<br />
Exposure time [min] 10<br />
The direct gadolinium method was used to record the radiography images. The gadolinium<br />
converter was placed behind the film (back screen) because of the high absorption of Gd.<br />
During neutron capture Gd emits 70 keV of conversion electrons to the film.<br />
255
Achievements and Main Results<br />
The resulting neutron radiography images are shown in figure 1.<br />
a) b)<br />
Figure 1: a) Neutron radiography image of a hydrogen tank filled with the room temperature metal<br />
hydride “C5” before any absorption of hydrogen, b) The same tank after shaking.<br />
The metal hydride material “C5” before any absorption of hydrogen shows already a distinct<br />
neutron absorption due to the high neutron absorption cross sections of the elements Mn, Ti<br />
and V which are the main components in the metal hydride. The “empty” tank is filled only up<br />
to about 80 % with the room temperature metal hydride, because a swelling of the material<br />
with increasing hydrogen content is expected. The packing of the powder is clearly visible.<br />
After rigorous shaking the powder starts moving to the bottom of the tank. The tank position<br />
during the filling process was 90° anticlockwise. So the own mass from the powder itself<br />
compressed the whole left site inside the tank. Due to this effect the bed does not spread<br />
homogeneously (figure 1b).<br />
The results show that neutron radiography is a suitable method to investigate the structure of<br />
metal hydride powder. This is the first step to an in situ characterisation of the hydrogen absorption<br />
and desorption in metal hydride tanks with neutron radiography and tomography.<br />
256
Note:<br />
The following research projects have been supported by the European Commission under the<br />
6th Framework Programme through the Key Action: Strengthening the European Research<br />
Area, Research Infrastructures. Contract n°: RII3-CT-2003-505925':<br />
M. Knaapila, A. Monkman<br />
SANS studies of polyfluorenes and ladder polymers in solution<br />
S. Rangelov, S. Halacheva<br />
Self-Assembly of Polyglycidol-Based Analogues to Pluronics at Low Temperatures<br />
A. Angelova, R. Mutafchieva, G. Le Bas, V. Iordanova<br />
Intermediates during the Phase Transition from a Lipid Cubic Phase to Sponge and Lamellar<br />
Mesophases<br />
M.V. Avdeev, L. Vekas, A.V. Feoktystov<br />
SANS contrast variation on water-based magnetic fluids stabilized by different monocarboxylic<br />
acids<br />
L. Vekas, A. Han, I. Morjan, M.V. Avdeev, A.V. Feoktystov<br />
SANS study of ferrofluids with iron/iron oxide nanoparticles obtained by laser pyrolysis<br />
J. Preu, T. Gutberlet, T. Heimburg<br />
The influence of angiotensin II on structural changes in lipid dispersions<br />
T. Cosgrove, B. Foster, M. Sharp, B. Cheesman, V. Gibson<br />
Study of novel graft copolymer systems and their solubilisation behaviour<br />
T. Cosgrove, H. Musa, B. Cheesman<br />
Synthesis and characterisation of linear and six-arm star poly (styrene- sulfonate) (PSSNa)<br />
F. Fally, M. Bichler, I. Drevenšek-Olenik, A. Zeilinger<br />
Neutron diffraction from gratings in holographic polymer dispersed liquid crystals<br />
N. van Dijk, S. He<br />
In-situ SANS measurements during self healing in deformed Fe-Cu alloys<br />
P. Staron, E. Eidenberger, M. Schober, A. Schreyer<br />
Test of a new fast furnace for use in a 2 T electromagnet up to 1000 °C<br />
E. Eidenberger, M. Schober, E. Stergar, P. Staron, H. Clemens<br />
SANS and 3DAP as methods to study precipitates in a Fe-Co-Mo alloy<br />
M. Schober, E. Eidenberger, C. Lerchbacher, P. Staron, H. Clemens<br />
In-situ SANS characterisation of the precipitation behaviour of Fe-Cu and Fe-Ni-Al<br />
The support by the European Commission is gratefully appreciated by the authors and<br />
proposers.<br />
257
258
Appendix I<br />
Reports of experiments carried out<br />
at the instruments REFSANS and SRESS-SPEC<br />
at the GKSS outstation at the Forschungsneutronenquelle<br />
Heinz Maier-Leibnitz (FRM II) in Garching<br />
in support of internal and external users.<br />
These reports have been taken from<br />
FRM II Annual Report 2008.<br />
(Reprinted by courtesy of<br />
Forschungsneutronenquelle Heinz Maier-Leibnitz (FRM II), Garching)<br />
259
260
1<br />
0.1 ToF-Horizontal Reflectometer REFSANS<br />
R. Kampmann 1 , J.-F. Moulin 1 , M. Haese-Seiller 1 , M. Pomm 1 , B. Nickel 2 , J. Rädler 2 , M. Müller 1 ,<br />
A. Schreyer 1<br />
1 GKSS Forschungszentrum, Institut für Werkstoffforschung, D-21502 <strong>Geesthacht</strong>, Germany<br />
2 Ludwig-Maximilians-Universität, Geschwister-Scholl-Platz 1, D-80539 München, Germany<br />
Introduction<br />
The neutron reflectometer REFSANS (reflectometry and evanescent small-angle neutron scattering) allows of performing<br />
comprehensive analyses of vertical and lateral surface and interface structures by means of specular and off-specular<br />
neutron reflectivity as well as small-angle neutron scattering at grazing incidence (GISANS) both on solid and free<br />
liquid surfaces [1, 2]. It opens up new and unique possibilities for research into the molecular architecture and function<br />
of complex boundary layers and surfaces of materials which are of increasing significance in technology and biotechnology.<br />
Such boundaries comprise, for example, synthetic polymer films on technical components, biocompatible films<br />
on transplants, complex biological functional materials on electro-optical components and magnetic nanostructures.<br />
Use of REFSANS<br />
After SC-2 had been put into operation in 2007 the quality of measurements at REFSANS could be improved due<br />
to better defined wavelength resolution over the selected λ-range and higher transmission of the chopper system.<br />
Measurements in the frame of exciting internal and external proposals have successfully been performed some of which<br />
are introduced in the following. REFSANS could, however, not be used for user proposals to the expected extent<br />
because the operation of the instrument had been interrupted fully from May to October 2008 due to a breakdown of<br />
the chopper mechanics.<br />
Example: Investigation on biomembrane mimics (R. Willumeit et al.)<br />
A biomembrane mimic coating on an implant substrate (Ti-6Al-7Nb) (sputtered on a Si-wafer) was investigated with<br />
the aim to improve the biocompatibility of the implant. Three reflectivity curves were measured under ambient<br />
condition at REFSANS, i) the wafer with the metallic substrate (thickness: ≈ 100 nm), ii) after coating with POPE,<br />
and iii) after washing the coated sample in water (Fig. 0.1, [6]).<br />
Figure 0.1: Investigation on biomembrane mimics (R. Willumeit et al. [6])<br />
Fits to the data were performed by using a Parratt formalism (continuous lines in Fig. 0.1). These revealed that a<br />
highly disordered lipid multilayer is formed after deposition of POPE solution onto the metallic substrates. A fraction<br />
of only 20-25% of the lipids forms ordered multilayers. Further incubation of the surface in water leads to washing off<br />
of parts of the lipids and to an increase of the ordering of the remaining bilayers [6].
2<br />
Figure 0.2: Reconstructed GTRs in the (Q y − Q z)-plane compared to their theoretical positions for reflected (green) and<br />
transmitted (white) neutrons (W. Kreuzpaintner et al. [3, 4])<br />
Example: ToF-GISANS study of Al-capped Gd-nano-wires (W. Kreuzpaintner et al.)<br />
A ToF-GISANS study of Al-capped Gd-nanowires (cross-section: 50 nm × 50 nm; spacing: 225 nm), grown on a faceted<br />
Al 2 O 3 surface was performed on REFSANS for various sample rotations (φ) [3, 4]. The ToF-GISANS technique was a<br />
real need to find the critical wavelength of 9.2 Å at a given incidence angle of α i =0.67 ◦ and to reconstruct the grating<br />
truncation rods (GTR) in the (Q y − Q z )-plane. In contrast to fixed wavelength instruments, the angle of incidence<br />
does not have to be changed, as the radius of the Ewald sphere is varied with the wavelength. Not only the reflected,<br />
but also the transmitted intensities are explored because of the large penetration depth of neutrons. The reconstructed<br />
GTRs are compared to their expected position and length using the standard Born Approximation. Fig. 0.2 shows<br />
the reconstructed reciprocal space image for a sample rotation of φ =0 ◦ compared with the theoretical locations of<br />
the GTRs. The intensity distribution in the vicinity of the sample horizon, where refraction and multiple scattering<br />
effects must be obeyed, requires a more complex analysis [3, 4].<br />
Example: Solid supported lipid bilayer in D 2 O (B. Nickel et al.)<br />
A solid supported lipid bilayer in D 2 O has been used as a benchmark for the signal-to-noise ratio which is available<br />
for experiments at biological interfaces at REFSANS [5].<br />
Figure 0.3: Solid supported bilayer. (a) Schematic of the sample states. (i) Bare wafer in D 2O. (ii) Supported bilayer in D 2O.<br />
(iii) Bilayer with GM1 incorporated. (b) Corresponding neutron reflectivity curves (B. Nickel et al. [5])<br />
The sample structure is shown schematically in Fig. 0.3a, while the respective measurement is shown in Fig. 0.3b.<br />
First, a bare Si wafer in D 2 Oismeasured(Fig. 0.3a i). The rapid intensity oscillations observed (Fig. 0.3b i)originate
3<br />
from the oxide layer. Then, a partly deuterated lipid bilayer is deposited (D31-POPC, Fig. 0.3a ii) by vesicle fusion<br />
and subsequent rinsing cycles. Homogeneity and diffusivity of the lipid layer was verified by fluorescence microscopy<br />
andthentheneutronreflectivitywasrecorded(Fig.0.3b ii). A huge change of the reflectivity signal due to the<br />
presence of the 4 nm lipid layer is observed. Finally, a glycolipid (GM1) was injected into the D 2 Ophase.SinceGM1<br />
is fully protonated, its insertion is associated with a scattering length density change of the distal leaflet. Indeed, we<br />
observe a small increase in contrast after GM1 injection (Fig. 0.3b iii). A detailed analysis is right now in preparation<br />
to extract the amount of GM1 intercalated into the distal leaflet from the observed scattering length density change.<br />
Outlook: developments on instrument and sample environment<br />
The soft- and hardware systems controlling the neutron systems are continuously improved and the operation of<br />
REFSANS has become more and more reliable. It is further planned to replace fully the two double disk choppers<br />
in the chopper chamber to achieve failure-free operation of the instrument. The data reconstruction software will be<br />
improved to achieve faster and on-line display of spectra and reflectivity. A sample chamber will be designed to allow<br />
of background reduced measurements of the reflectivity from solid and soft samples. Polarized beam options will be<br />
available at REFSANS only in 2010.<br />
Acknowledgements<br />
The development of REFSANS has been supported by the German Federal Ministry of Education, Research and<br />
Technology (BMBF) under contract 03RA7LMU.<br />
References<br />
[1] R. Kampmann, M. Haese-Seiller, V. Kudryashov, V. Deriglazov, M. Tristl, C. Daniel, B. Toperverg, A. Schreyer,<br />
and E. Sackmann. The potential of the horizontal reflectometer refsans/frm-ii for measuring low reflectivity and<br />
diffuse surface scattering. Physica B, 350:e763–e766, 2004.<br />
[2] R. Kampmann, M. Haese-Seiller, M. Marmotti, J. Burmester, V. Deriglazov, V. Syromiatnikov, A. Okorokov,<br />
F. Frisius, M. Tristl, and E. Sackmann. The novel reflectometer refsans for analyses of liquid and soft surfaces at<br />
the new research reactor frm-ii in munich, germany. Applied Physics A, 74:249–251, 2002.<br />
[3] W.Kreuzpaintner,J.-F.Moulin,D.Lott,R.Kampmann,M.Haese-Seiller,M.Störmer,,andA.Schreyer:.Gisans<br />
from nickel-nanodots. FRM II proposal 1707, 2008.<br />
[4] W. Kreuzpaintner, J.-F. Moulin, D. Lott, R. Kampmann, M. Haese-Seiller, M. Störmer, , and A. Schreyer. Timeof-flight<br />
grazing incidence small angle neutron scattering on gd nanowires. Eur. Phys. J. Special Topics, 168:73–79,<br />
2009.<br />
[5] S. Stanglmaier, S. Hertrich, M. Haese-Seiller, R. Kampmann, J. Rädler, and B. Nickel. Amyloid. FRMIIproposal<br />
2384, 2008.<br />
[6] R. Willumeit, F. Fayerabend, A. Schuster, S. Linser, D. Lott, J.-F. Moulin, R. Kampmann, M. Haese-Seiller,<br />
V. Haramus, and A. Schreyer. Lipidschichten auf titan. FRM II proposal 1542, 2007.
Experiments on biofunctional interfaces at Refsans<br />
Stefan Stanglmaier, Samira Hertrich, Joachim Rädler, Bert Nickel<br />
Ludwig-Maximilians-Universität, Department für Physik<br />
with instrumental support from<br />
Martin Haese-Seiller and Reinhard Kampmann<br />
GKSS<br />
Our first focus in 2008 was to establish a data analysis software packet which converts the<br />
raw-data coming from the detector into wavelength and angularly resolved neutrons. In a<br />
second step, these data are then converted into reflected intensities which can be analyzed by<br />
standard software for reflectometry, i.e. the Parratt32 tool from HMI. This LMU-software<br />
packet is now available for regular usage.<br />
An alignment strategy has been established, which allows verifying for sample parallelism<br />
respect to the incident beam, for detector-sample distance, and for triggering of the chopper.<br />
As test samples, smooth oxide layers of the order of 100nm thickness have been used. Other<br />
calibration samples such as Ag-Behenate coated wafers turned out to be less practical. A<br />
typical set of reflected intensities at a fixed angle versus neutron wavelength is shown in Fig<br />
1. In short, the alignment method is based on a series of such measurements at different<br />
angles. The collective movement of the local maxima can be used to determine a<br />
misalignment in angle, triggering or detector distance.<br />
0.2<br />
Intensity (cps)<br />
0.1<br />
0.0<br />
5 10 15<br />
(Å)<br />
Figure 1. Neutrons reflected from a Si/SiO 2 wafer at an incident angle of 2.8° as a function of neutron<br />
wavelength.<br />
In order to benefit from the open chopper system at Refsans, we have explored the interplay<br />
of resolution and intensity as a function of chopper opening, frequency and TOF length. First<br />
experiments confirm the flexibility of the setup allowing for changing between high fluxes to<br />
high resolution, cf. Fig. 2. A detailed analysis of the interplay of chopper and slit setting, also<br />
in view of signal to background ration is work in progress.
(a)<br />
Intensity (cps)<br />
0.5<br />
0.0<br />
5 10 15<br />
1<br />
(b)<br />
I/I Max<br />
0<br />
5 10 15<br />
(Å)<br />
Figure 2. Neutrons reflected from a Si/SiO 2 wafer at two different chopper settings. (a) Absolute intensities<br />
show the increase in flux for a shorter chopper disk separation (chopper position 3, black data points) compared<br />
to a longer chopper disk separation (chopper position 6, red data points). (b) Normalized intensities reveal the<br />
loss in resolution associated with the increase in flux, which shows up here as a smearing of the interference<br />
signal.<br />
For the reflectivity measurement of an extended q-range, it is crucial to verify that<br />
measurements at different angles as a function of wavelength can be superimposed correctly.<br />
This includes the normalization of the reflected intensities with the direct beam spectrum and<br />
the transformation of wavelength and angle into momentum transfer q. Any error in<br />
wavelength, angle, TOF length or TOF time would impede this procedure. As an example, the<br />
reflectometry of a silicon oxide film measured at three different angles is shown in Fig. 3. The<br />
measurements superimpose very well. In a next step we will establish that this is also possible<br />
if different chopper settings are used.<br />
10 0<br />
10 -1<br />
Reflectivity<br />
10 -2<br />
10 -3<br />
10 -4<br />
10 -5<br />
10 -6<br />
10 -7<br />
0.00 0.05 0.10 0.15 0.20<br />
q (Å -1 )<br />
Figure 3. Normalized neutron reflectivity of a SiO 2 /Si wafer is plotted versus momentum transfer. The different<br />
colors encode measurements carried out at incident angles of 0.6° (black), 1.4° (red) and 2.8° (green). Chopper<br />
was in position 3.
Finally, we have used a solid supported lipid bilayer in D 2 O as a benchmark for the signal-tonoise<br />
ratio which is available for experiments at biological interfaces. The sample structure is<br />
shown schematically in Fig. 4a, while the respective measurement is shown in Fig. 4b. First, a<br />
bare Si wafer in D 2 O is measured (Fig. 4a i). The rapid intensity oscillations observed (Fig 4b<br />
i) originate from the oxide layer. Then, a partly deuterated lipid bilayer is deposited (D31-<br />
POPC, Fig. 4a ii) by vesicle fusion and subsequent rinsing cycles. Homogeneity and<br />
diffusivity of the lipid layer was verified by fluorescence microscopy and then the neutron<br />
reflectivity was recorded (Fig 4 b ii). A huge change of the reflectivity signal due to the<br />
presence of the 4nm lipid layer is observed.<br />
Finally, a glycolipid (GM1) was injected into the D 2 O phase. Previous experiments using hard<br />
x-rays have indicated that GM1 inserts spontaneously into the distal leaflet (facing the D 2 O,<br />
Fig. 4 a iii), resulting in a faint increase in bilayer thickness. Due to the weak contrast, the<br />
concentration of the GM1 in the upper leaflet could not be quantified unambiguously with x-<br />
ray. In a neutron experiment, since GM1 is fully protonated, its insertion is associated with a<br />
scattering length density change of the distal leaflet. Indeed, we observe a small increase in<br />
contrast after GM1 injection (Fig 4b iii). A detailed analysis is right now in preparation to<br />
extract the amount of GM1 intercalated into the distal leaflet from the observed scattering<br />
length density change.<br />
10 0 (b)<br />
(a)<br />
10 -1<br />
(i)<br />
Reflectivity<br />
10 -2<br />
10 -3<br />
10 -4<br />
10 -5<br />
(iii)<br />
(ii)<br />
(i)<br />
(ii)<br />
(iii)<br />
10 -6<br />
0.00 0.05 0.10 0.15 0.20<br />
q (Å -1 )<br />
Figure 4. (a) Schematic of the sample states. (i) Bare wafer in D 2 O. (ii) Supported bilayer in D 2 O. (iii) Bilayer<br />
with GM1 incorporated. (b) Corresponding neutron reflectivity curves.<br />
The data presented here indicate that Refsans can be used to analyze subtle changes in<br />
biological model interfaces. We plan to further push the signal-to-noise ratio by tilting of the<br />
incident beam in future experiments. This tilt should allow for recording of intensities at<br />
higher incident angles (4°) while keeping a sufficiently large sample to detector distance. This<br />
should result in a signal-to-background ratio in water beyond 10 6 along with an increase in q-<br />
range accessible.<br />
We acknowledge financial support by BMBF within the research alliance Nanosoft<br />
(03Ra7LMU). We thank K. Fritz (LMU) for help with sample preparation and discussion.
Improved order in thick tri-block copolymer films by different annealing<br />
strategies, No. 1337<br />
Experimental team:<br />
E. Metwalli 1 , U. van Bürck 1 , P. Müller-Buschbaum 1<br />
1 TU München, Physik-Department LS E13, James-Franck-Str. 1, D-85748 Garching,<br />
Germany<br />
Instrument: REFSANS, 04-14-2008 to 04-17-2008<br />
Local contact: J.-F. Moulin, R. Kampmann<br />
We investigated the model system of the A-B-A type tri-block copolymer consisting of<br />
polystyrene and polyparamethylstyrene, denoted poly-paramethylstyrene-b-polystyrene-bpolyparamethylstyrene<br />
with a fully deuterated central polystyrene block P(pMS-b-Sd8-bpMS)<br />
and both components being nearly symmetrical in the number of monomer units.<br />
The molecular weight used in this investigation was Mw= 280 000 g/mol (narrow molecular<br />
weight distribution Mw/Mn=1.1). Due to the high molecular weight, the strong segregation<br />
regime was addressed. In thick films on silicon substrates after annealing in toluene<br />
vapour atmosphere a powder-like disordered lamellar morphology had been observed.<br />
Thus in thick films, the interfaces with the air and substrate did not introduce order, which<br />
orders the full film volume, e.g. in a lamella which is oriented parallel to these interfaces.<br />
However, applications based on the tri-block copolymer film acting as a template require a<br />
good alignment of the lamellae with respect to the interfaces.<br />
Within the performed experiments at REFSANS we focused on alternative routes towards<br />
an increased ordered P(pMS-b-Sd8-b-pMS) film structure. The vapor atmosphere<br />
annealing was replaced by conventional thermal annealing at temperatures above the<br />
glass transition temperature of both blocks. A series of different annealing times was<br />
prepared. Moreover, samples were annealed in an electric field.<br />
The P(pMS-b-Sd8-b-pMS) films were spin-coated onto pre-cleaned Si substrates. A total<br />
film thickness of 880 nm was selected, which allows to accommodate several lamellae<br />
(lamellar spacing is 48 nm). X-ray reflectivity measurements performed right after spincoating<br />
and after the annealing proofed the homogeneity of the films. Investigation with<br />
optical microscopy showed no indication for onset of dewetting although very long<br />
annealing times were applied.<br />
a) b) c)<br />
Figure 1: Two-dimensional GISANS pattern recorded at a wavelength slice #11 for a<br />
P(pMS-b-Sd8-b-pMS) film a) right after preparation, b) after 430 h and c) after 2352 h<br />
annealing at T=174 °C.<br />
Due to the chemical similarity of the blocks, the system P(pMS-b-Sd8-b-pMS) does not<br />
allow for investigations of the micro phase separation structure by real space techniques<br />
and x-ray scattering. In contrast, TOF-GISANS at REFSANS was successfully applied.
Improved order in thick tri-block copolymer films by different annealing<br />
strategies, No. 1337<br />
In GISANS geometry the reflected and refracted intensity was detected. The TOF-GISANS<br />
option allows to detect lateral structures as a function of the wavelength and thus as a<br />
function of different ratios of incident angle to critical angle i/c. Because the films were<br />
thick, 1 day of acquisition time was sufficient to have good statistics.<br />
Figure 1 shows the example of measured two-dimensional GISANS pattern extracted from<br />
the TOF-GISANS data for a fixed wavelength slice. We show slice #11, which corresponds<br />
to the wavelength at the intensity maximum of REFSANS at the applied instrument<br />
settings. Very clearly the scattering pattern changes upon annealing. For the as-prepared<br />
sample, in addition to the specular and the Yoneda peak, strong ring-shaped intensity<br />
maxima are measured. These ring-shaped maxima in the GISANS data (see figure 1a)<br />
show the powder-like disorder of the P(pMS-b-Sd8-b-pMS) film before being annealed .<br />
After 430 h the ring-shaped intensity is vanished and a strong Yoneda peak is present<br />
(see figure 1b). In addition, a triangular shaped diffuse intensity merges the specula and<br />
Yoneda peak. It results from the internal disorder of the film. The powder-like arrangement<br />
of lamellar domains undergoes a reorientation which gives rise to such internal disorder.<br />
After 2352 h of annealing the diffuse scattering has changed again (see figure 1c). While<br />
the Yoneda peak remains strong due to surface roughness at the polymer-air interface, the<br />
rest of the diffuse scattering is strongly decreased. The triangular shaped diffuse intensity<br />
is no longer present, giving a good indication of improved internal order with respect to the<br />
lateral direction.<br />
The same holds for the transmitted signal measured in the region around the beamstop.<br />
Without annealing (see figure 1a) two curved intensity maxima arise from the powder-like<br />
disorder of the lamellar domains installed during spin-coating. After 430 h (see figure 1b)<br />
two broad intensity maxima close to the beamstop have build-up, picturing an increased<br />
internal disorder. Finally, after 2352 h (see figure 1c) nearly no transmitted scattering is<br />
observable because of the installed equilibrium order.<br />
a)<br />
b)<br />
Figure 2: Sketch describing the observed behavior<br />
during annealing of the initially prepared film (from<br />
top to bottom): a) Parts of the P(pMS-b-Sd8-b-pMS)<br />
film are lamellar oriented domains but with a random<br />
orientation with respect to the substrate. b) The film<br />
disorders due to the movement of the block<br />
copolymers before c) reaching a new and highly<br />
ordered configuration.<br />
c)<br />
However, this perfectly ordered stack should give rise to additional Bragg peaks, which are<br />
not visible in the 2D GISANS data. Because TOF-GISANS covers a much larger q-space<br />
region as compared to one single GISANS measurement for fixed wavelength, the limited<br />
q-space probed much likely is not the reason for this. In contrast, it is much more likely,<br />
that the order inside the films is that good after so long annealing, that the lamellae are not<br />
modulated and only in a specular reflectivity measurement Bragg peaks are visible. With<br />
additional neutron reflectivity measurements we will investigate this hypothesis.<br />
Data from samples which were annealed in an electric field is under analysis still.
Conjugated polymer-TiO 2 based bulk heterojunction structures, No. 1338<br />
Experimental team:<br />
G. Kaune 1 , E. Metwalli 1 , U. van Bürck 1 , P. Müller-Buschbaum 1<br />
1 TU München, Physik-Department E13, James-Franck-Str. 1, 85747 Garching (Germany)<br />
Instrument: REFSANS, 07-04-2008 to 14-04-2008<br />
Local contact: J.-F. Moulin<br />
Photovoltaic energy conversion systems based on an inorganic semiconductor and an<br />
organic hole transporting material, so called hybrid solar cells, have emerged to a<br />
promising alternative technology for solar light harvesting [1]. In a common device, a<br />
nanosized structure with a large interface between the two components is necessary to<br />
separate excitons generated by incoming light efficiently. This can be achieved by<br />
application of a nanostructured material, whose interspaces are filled with a polymeric hole<br />
transporting material. For structural characterisation of the resulting thin film systems,<br />
grazing incidence small angle neutron scattering (GISANS) is a powerful tool, as it allows<br />
for the determination of characteristic length scales in the film plane as well as along the<br />
surface normal of the film [2].<br />
In our study we used titanium dioxide (TiO 2 ) as inorganic component in the model system.<br />
The TiO 2 layer was prepared by application of a sol-gel process, allowing a controlled<br />
setting of the film morphology [3]. For this experiment, a foam-like structure, providing a<br />
large surface, was used. The pores of the TiO 2 layer were filled with poly(N-vinylcarbazole)<br />
(PVK), blended with 2,4,7-trinitro-9-fluorenone (TNF) to form a charge transfer complex<br />
with improved electrical properties as compared to pure PVK. Different blending ratios<br />
from 1:0.01 to 1:0.1, corresponding to low towards medium doping levels, were used to<br />
detect structural lengths depending on the TNF ratio. In total, two different sets of samples<br />
were prepared: Thin film systems consisting of TiO 2 and the PVK:TNF blend in different<br />
blending ratios and, for comparison, films consisting only of the identical PVK:TNF blend.<br />
Silicon, cleaned in an acidic bath, was used as substrate material. None of the<br />
components was deuterated.<br />
The GISANS experiments were carried out at the REFSANS instrument in TOF mode. For<br />
each sample GISANS data were taken at 26 wavelength channels, ranging from a minimum<br />
to a maximum mean wavelength of 2.0 to 22.9 Å. The incidence angle was set to<br />
0.5° and the sample-to-detector-distance 9991 mm. Accumulation time was 24 hours for<br />
each sample. Fig. 1 shows exemplarily a comparison of the scattering images collected at<br />
a wavelength of 5.0 Å for four selected samples. In all images next to the specular peak a<br />
Yoneda peak is prominent, being weak in case of the PVK:TNF films and well pronounced<br />
in case of the hybrid films. A splitting in several components for the different materials is<br />
not obvious from the images or vertical cuts (see vertical cuts taken at the composite film<br />
with high PVK doping level in figure 2). The direct beam as well as the specular beam<br />
show an asymmetrically shape, which is also present in the Yoneda peak (see horizontal<br />
cuts in figure 2), making a clear identification of structural peaks difficult. However, no<br />
strong off-specular scattering is detected and only a weak peak might be identified at large<br />
out-of plane angles. Fringes in the scattered intensity along the surface normal, indicating<br />
a layered structure of the composite films, are not pronounced. Thus a rough interface<br />
between the two components is present, as to be expected for the foam-like TiO 2 .<br />
The experiment focussed on the detection of a layered structure in the composite films as<br />
well as in the characterisation of the TiO 2 structure. Another important question regards<br />
the penetration of the PVK:TNF blend into the TiO 2 voids, which is a prerequisite for an<br />
efficient device. A detailed analysis including a modelling of the out-of plane dependence<br />
of the off-specular intensity will allow for the extraction of this information.
Conjugated polymer-TiO 2 based bulk heterojunction structures, No. 1338<br />
Fig. 1: Example of GISANS scattering images collected at a wavelength of 5.0 Å for four<br />
selected samples as noted in the image. A Yoneda peak is well pronounced in all images<br />
and more intense in case of the composite films containing TiO 2 . Direct and specular peak<br />
show an asymmetric shape, which is also visible in the Yoneda peak shape.<br />
a)<br />
20<br />
Yoneda<br />
b)<br />
20<br />
log(Int) (a.u.)<br />
15<br />
10<br />
5<br />
log(Int) (a.u.)<br />
15<br />
10<br />
5<br />
80 100 120 140 160 180<br />
pixel number<br />
50 100 150<br />
pixel number<br />
Fig. 2: Vertical cuts (a) and horizontal cuts (b) taken from the GISAXS data of the<br />
composite film with high TNF concentration (TiO 2 +PVK:TNF(1:0.1)). In the vertical cuts,<br />
shifting and intensity variation with wavelength of the Yoneda peak are indicated with the<br />
dashed line, the horizontal cuts show no strong features but one might identify a weak<br />
peak at large out-of plane angles.<br />
References:<br />
[1] U. Bach, D. Lupo, P. Comte, J. E. Moser, F. Weissörtel, J. Salbeck, H. Spreitzer, M.<br />
Grätzel, Nature 395, 583 (1998)<br />
[2] P. Müller-Buschbaum, J. S. Gutmann, R. Cubitt, W. Petry, Physica B 350, 207 (2004)<br />
[3] Y. Cheng, J. S. Gutmann, J. Am. Chem. Soc. 128, 4658 (2006)
Forschungsneutronenquelle Heinz Maier-Leibnitz (FRM II)<br />
Lichtenbergstr. 1<br />
85748 Garching, Germany www.frm2.tum.de<br />
Variation of lipid layer thickness and adhesion of protein depending of<br />
time of exposition in water and growth medium<br />
<br />
Experimental team:<br />
Regine Willumeit, Frank Fayerabend, Anna Schuster, Sebastian Linser, Dieter Lott,<br />
Vasyl Haramus, Andreas Schreyer<br />
GKSS Research Center, Max-Planck Str. 21502 <strong>Geesthacht</strong>, Germany<br />
Instrument: REFSANS, 04.02. – 11.02. 2008<br />
Local contacts: Reinhard Kampmann, Martin Haese-Seiler, Jean-Francois Moulin<br />
Permanent implants such as metallic hip prostheses are widely used and successfully<br />
implemented in medicine. The efforts are manifold to develop new implant surface modifications<br />
which may prolong the life span of an implant, or shorten the recovery time of a patient by quicker<br />
and more stable implant incorporation. In our group, an approach is proposed and discussed: the use<br />
of a cell biomembrane mimic. Cell membranes consist of approximately 60% proteins and 40%<br />
lipids. The importance of proteins is widely accepted, while the role of lipid layers is not fully<br />
acknowledged. In several studies we have show as a proof of principle that even a simple model<br />
phospholipid membrane system can significantly influence the cell behaviour on metallic<br />
biomaterials. Several phospholipids were chosen, among them POPE (palmitoyl-oleoyl<br />
phosphatidyl-ethanolamine). This phospholipid has been shown to be essential for cytokinesis<br />
(Emoto K,et al J Biol Chem 2005;280,37901), but further physiological functions are not known.<br />
Lipids coatings are so far not covalently linked to the surface because the preparation is based<br />
on the self assembly of multilamellar lipid layers by evaporation of a solvent. Only from the cellular<br />
reaction we can judge that a lipid film must be present even after expose to water or growth<br />
medium.<br />
Titanium alloy (Ti6Al7Nb) was deposited on the silicon substrates by sputter deposition with a<br />
layer thickness around 100 nm. Two pieces (S730 and S674) have been taken for parallel<br />
measurements. Phospholipid coating was done with the phospholipid 1-palmitoyl-2-oleoyl-snglycero-3-phospho-ethanolamine<br />
(POPE). POPE (1 mM, 7.8 mg/mL) was solved in<br />
chloroform:methanol (80:20) and approximately 200 L were deposited onto the substrate with an<br />
area of ~ 1 cm 2 . Afterwards the solvent was evaporated at room temperature in air for 2 hours. One<br />
sample was incubated in distilled water for 2 hours at room temperature. A second sample was<br />
incubated for 30 minutes in distilled water. After drying they were measured.<br />
Initial substrates show similar scattering curves and analysis by PARRATT suggests that there<br />
are metal layer (100-110 nm) and with some small oxide layer (5-6 nm). Deposition of lipid layer<br />
gives only small changes in reflectivity curves (Fig. 1) and can be modelled with lipid mulitilayer<br />
which consists of 40-50 bilayer of POPE of thickness 5.5 nm and significant roughness 2 nm. Total<br />
thickness of POPE multilayer is 200-250 nm which is significantly less than expected from<br />
deposited quantity of solution (~ 1000 nm). It should be pointed out that most of the lipid is in<br />
unordered form and does not contributed to specular reflectivity. This assumption is supported by<br />
atomic force microscopy (AFM) data.
Forschungsneutronenquelle Heinz Maier-Leibnitz (FRM II)<br />
Lichtenbergstr. 1<br />
85748 Garching, Germany www.frm2.tum.de<br />
10<br />
1<br />
substrate coated with POPE phospholipid, S730<br />
substrate coated with POPE phospholipid, S674<br />
0,1<br />
Reflectivity<br />
0,01<br />
1E-3<br />
1E-4<br />
1E-5<br />
1E-6<br />
1E-7<br />
0,00 0,05 0,10 0,15 0,20<br />
Q z<br />
, Å -1<br />
Figure 1. Reflectivity on substrates coated with POPE multilayer together with PARRATT fits. On<br />
the right an AFM picture with an estimated roughness of 5.8 nm on 5 m is shown.<br />
Incubation in water for 30 minutes and 2 hours gives additional features in the reflectivity curves<br />
(Fig. 2), i.e. a maximum around 0.12 Å -1 . PARRAT analysis suggests that during the incubation the<br />
number of bilayers of POPE decreases to 35-45 with same thickness of 5.5 nm and smaller<br />
roughness of 1 nm. It seems that incubation in water leads to better structure of POPE bilayers and<br />
washing out of some of them.<br />
10<br />
1<br />
0,1<br />
substrate coated<br />
with POPE after 2h in water, S730<br />
substrate coated<br />
with POPE after 0.5h in water, S674<br />
Reflectivity<br />
0,01<br />
1E-3<br />
1E-4<br />
1E-5<br />
1E-6<br />
1E-7<br />
0,00 0,05 0,10 0,15 0,20<br />
Q z<br />
, Å -1<br />
Figure 2. Reflectivity on substrates coated with POPE multilayer after incubation in water together<br />
with PARRATT fits.<br />
In the next steps, the the preparation technique will be optimized for adhesion of proteins.<br />
Preliminary measurements have shown the formation of an additional protein layer on the POPE<br />
muiltilayer.
, <br />
Experimental team:<br />
<br />
<br />
<br />
<br />
Instrument:<br />
Local contact:
,
, <br />
Experimental team:<br />
<br />
<br />
<br />
<br />
Instrument: <br />
Local contact:
,
,
Time-of-flight small angle neutron scattering of flux line lattices, 647 & 670<br />
Experimental team:<br />
S. Mühlbauer 1,2 , C. Pfleiderer 1 , P. Böni 1 , B. Taylor 3 , J. White 4 , R. Heslop 4 , E. M.<br />
Forgan 4<br />
1 Technische Universität München, Physikpedartment E21, D-85748 Garching<br />
2 Forschungsneutronenquelle Heinz Maier-Leibnitz, D-85748 Garching<br />
3 University of California, Department of Physics, San Diego USA<br />
4 School of Physics and Astronomy, University of Birmingham, Birmingham UK<br />
Instrument: REFSANS, November 2007<br />
Local contact: R. Kampmann, M. Haese-Seiler<br />
A celebrated property of type II superconductivity is the penetration of an applied magnetic field<br />
into the bulk of the material in terms of quantized lines of magnetic flux. These flux lines may<br />
arrange themselves into a lattice to minimize the overall ground state energy. The study of flux lines<br />
and flux line lattices in turn provides key information on the interplay of the superconducting<br />
coherence length, correlation length, and the detailed electronic structure, notably details of the<br />
superconducting gap symmetry.<br />
(a) (b) (c)<br />
Fig. 1: Typical diffraction pattern observed of the superconducting flux line lattice in single Niob at 4k and 190mT. For details<br />
see text.<br />
Neutron scattering provides an important experimental tool to obtain direct information on the<br />
topology and nature of superconducting flux line lattices, where elementary studies consist of<br />
diffraction experiments. The comparatively large lattice spacing of the flux lines of several<br />
thousand Angstroms imply that the Bragg angles are tiny. This has motivated the somewhat unusual<br />
use of small angle neutron scattering instruments in the spirit of a single crystal diffractometer,<br />
where recent highlights from the literature concern various conventional [1] and unconventional<br />
superconductors [2,3].<br />
We have explored the possibility to study flux line lattices on REFSANS. With its time-of-flight<br />
capability REFSANS offers a completely new approach to diffraction experiments. As proof-ofprinciple<br />
we have measured the superconducting flux line lattice in single crystals of Niobium.<br />
Typical experimental results are shown in Fig. 1. Panel (a) shows the total intensity as integrated<br />
over wavelength whereas panel (b) and (c) show distinct wavelength slices.<br />
For our experiment, REFSANS was configured in conventional SANS mode, not making use of the<br />
focusing beam elements. The collimation was chosen to be 12m, the transmission function of the<br />
chopper system was adjusted to give maximal intensity for long wavelengths. A set of <strong>Helmholtz</strong>
Time-of-flight small angle neutron scattering of flux line lattices, 647 & 670<br />
coils (0-0.5T) as combined with a closed cycle cryostat was used to obtain the appropriate sample<br />
environment. Magnet and cryostat were set up on the instruments goniometer. The magnetic field<br />
was applied parallel to the incident neutron beam.<br />
During our experiments it transpired that time-of-flight small angle diffraction essentially offers the<br />
opportunity to map a large part of reciprocal space without the need to rock the sample. The ability<br />
to choose different wavelength binnings after the experiment gives the possibility to vary<br />
instrumental resolution versus intensity as a free manner. Furthermore, the intrinsic time resolution<br />
of a time-of-flight instrument allows to access the slow dynamics in superconductors in future<br />
studies.<br />
[1] M. Laver, et. al. Phys. Rev. Lett. 96, 167002, (2006)<br />
[2] A. D. Huxley, et. al., Phys. Rev. Lett. 93, 18005, (2004)<br />
[3] A.D. Bianchi et al. Science 319, 177, (2008)
-DKUHVEHULFKW 6$16<br />
<br />
<br />
6$16WKHQHZ6PDOO$QJOH6FDWWHULQJLQVWUXPHQW<br />
<br />
'XULQJWKH\HDUWKHEDVLFFRPSRQHQWVRIWKHFROOLPDWLRQV\VWHPZHUHLQVWDOOHG,QFOXGHG<br />
LQWKLVZRUNZDVILUVWWKHVHDOLQJRIWKHYDFXXPFKDPEHUZLWKDYROXPHRIDURXQGP <br />
ZKLFKDOORZVDIWHUVZLWFKLQJRIIWKHSXPSLQJVWDWLRQWRNHHSDYDFXXPRIEHWWHUWKDQPEDU<br />
IRURQHGD\,WKDVWREHPHQWLRQHGWKDWPRUHWKDQYDFXXPIHHGWKURXJKDQHXWURQJXLGHD<br />
WHOHVFRSHQRVHDQGWZRKDWFKHVZHUHLPSOHPHQWHGEHFDXVHRIWKHVHYHQPRYDEOHWDEOHVDQG<br />
WKHVXSSRUWRIWKHRSWLFDOFRPSRQHQWV$IWHUPRXQWLQJWKHLQVWUXPHQWFRPSRQHQWVLQWKH<br />
YDFXXPFKDPEHUWKHILQDOYDOXHRIWKHYDFXXPFKDQJHGRQO\QHJOLJLEOH,WLVLQWHQGHGIRUWKH<br />
URXWLQHRSHUDWLRQWRSXPSWKHFROOLPDWLRQV\VWHPRQHRUWZRKRXUVLQWKHQLJKWDQGWRVZLWFK<br />
RIIWKHSXPSLQJVWDWLRQRYHUWKHGD\WLPH<br />
7KHLQWHULRUZDOOVRIWKHYDFXXPFKDPEHUZHUHILUVWEDFNHGZLWKSODWHVRIERURQHSR[\<br />
$IWHUZDUGVIUDPHVZHUHLQVWDOOHGZKLFKDOORZWRSRVLWLRQWKHWDEOHVZLWKWKHRSWLFDO<br />
FRPSRQHQWV>@2QHDFKWDEOHDUHPRXQWHGIRXUWUDFNV)LJDE2QHWUDFNIRUWKH<br />
QHXWURQJXLGHDQRWKHURQHIRUWKHSLQKROHDSHUWXUHVRQHIRUDODVHUV\VWHPDQGWKHODVWWUDFN<br />
LVSDUWO\XVHGIRUEDFNJURXQGDSHUWXUHVDQGDOORZVWRLPSOHPHQWQHZGHYHORSHGRSWLFDO<br />
FRPSRQHQWVODWHU7KHQHXWURQJXLGHIUDPHVDUHPRXQWHGDQGSUHDOLJQHG7KHWZR9VKDSHG<br />
SRODULVHUVDUHLQVWDOOHGDQGWKHQHXWURQJXLGHVRI1L ZLOOIROORZLQWKHQH[W\HDU7KH<br />
DSHUWXUHIUDPHVDUHPRXQWHGDQGZLOOEHILOOHGZLWK% &SODWHVVRRQZKHQWKHFXWWLQJRXWRI<br />
WKHSLQKROHVLVUHDG\$WWKHPRPHQWWKHODVHUV\VWHPLVWHVWHGRXWVLGHWKHFROOLPDWLRQV\VWHP<br />
ZLWKVSHFLDODSHUWXUHVZKLFKSURYLGHODWHUWKHSRVVLELOLW\WRDOLJQHDFKWDEOHLQWKHQHXWURQ<br />
EHDPZLWKRXWRSHQLQJWKHVKLHOGHGYDFXXPFKDPEHU7KHFROOLPDWLRQYDFXXPFKDPEHULV<br />
EXLOGURXQGZLWKWRQVRIOHDG,IDIDLOXUHKDSSHQVFLUFOHGSOXJVRIOHDGFDQEHUHPRYHGRQ<br />
VSHFLDOSRVLWLRQVRIWKHVLGHZDOOVZKHUHJODVVZLQGRZVDUHLQVWDOOHGWRKDYHDORRNLQVLGH<br />
7KHFKDPEHULVHTXLSSHGZLWKDQLOOXPLQDWLRQIRUYDFXXPWRSHUIRUPDILUVWFKHFNZLWKRXW<br />
EUDNLQJWKHYDFXXP,IQHFHVVDU\WKHFKDPEHUZLOOEHYHQWDQGWKHOHDGKDVWREHGLVPRXQWHG<br />
IROORZLQJWKHRSHQLQJRIWKHFRYHUWRWDNHWKHRSWLFDOFRPSRQHQWVRXW7KLVHODERUDWHG<br />
SURFHGXUHVKRXOGEHPLQLPL]HGZLWKWKHVXSSRUWRIWKHODVHUV\VWHP'XHWRWKHSDUDOOHO<br />
DOLJQPHQWRIWKHODVHUWRWKHQHXWURQEHDPDIXUWKHUXVHRIWKHODVHULVWRDVVLJQWKHQHXWURQ<br />
EHDPFHQWUHDWWKHVDPSOHSRVLWLRQ7KLVZLOOEHYHU\KHOSIXOEHFDXVHRIPDQ\FKDQJHVRIWKH<br />
VDPSOHHQYLURQPHQWLQWKHURXWLQHRSHUDWLRQ7KHPRYHPHQWVRIWKHPRXQWHGWDEOHVZHUH<br />
WHVWHGZLWKWKHVRFDOOHG%HFNKRII636FRQWUROUHODWLYHWRDFFXUDF\DQGUHSHDWDELOLW\<br />
7KHSRODULVDWLRQRSWLRQGHPDQGVDVWURQJILHOGRIDURXQG*DXVVDWWKHSRODULVHUSRVLWLRQ<br />
DQGDJXLGHILHOGLQWKHZKROHFROOLPDWLRQFKDPEHURIDERXW*DXVV7KHVHWXSRIWKHWZR<br />
SRODULVHUVLVVKRZQLQ)LJWRJHWKHUZLWKWKHH[WHUQDOVWDWLFPDJQHWLFILHOG$IWHUWKH<br />
SRODULVHUDVSLQIOLSSHUZLOOEHLQVWDOOHG7KLVSRVLWLRQKDVWKHDGYDQWDJHWRXVHWKHJUDGLHQWRI<br />
WKHPDJQHWLFILHOGIURPWKHSRODULVHUWRWKHJXLGHILHOG7KHVSLQIOLSSHULVVKRZQLQ)LJ<br />
ZLWKDVOLJKWO\ZHGJHVKDSHGLURQMRNHDQGPRXQWHGZLWKSHUPDQHQWPDJQHWVZKLFKSURYLGHV<br />
D'&ILHOGRIDURXQG*LQWKHFHQWUHRIWKHVSLQIOLSSHU7KH5)FRLOLVZRXQGHGDURXQG<br />
WKHQHXWURQEHDPRQDFHUDPLFWXEH$O 2 WRDYRLGH[FHVVLYHHGG\FXUUHQWORVVHV7KLVVHW<br />
XS>@KDVEHHQVXFFHVVIXOXVHGDWWKHVPDOODQJOHLQVWUXPHQW9DWWKH+HOPKROW]=HQWUXP<br />
%HUOLQ)LUVWLGHDVRIDV\VWHPWRIRFXVWKHQHXWURQEHDPZLWKQHXWURQOHQVHVLVLQSURJUHVV<br />
6SDFHIRUVXFKDHTXLSPHQWLQFOXGLQJDFRROLQJV\VWHPLVUHVHUYHG$QRWKHUSRVVLEOHRSWLRQLV<br />
WKHLQWHJUDWLRQRIDFKRSSHUV\VWHPPRXQWHGEHORZWKHQHXWURQEHDPLQWKHYDFXXPFKDPEHU<br />
<br />
)XUWKHURSHUDWLRQVZHUHFRPSOHWHGDVIRUH[DPSOHWKHFRQQHFWLRQRIWKHQHXWURQJXLGHV\VWHP<br />
WRWKHVHOHFWRUWRZHUZLWKD1L QHXWURQJXLGHLQFOXGLQJWKHVKLHOGLQJ7KHLQVWDOODWLRQRIWKH<br />
WZRPRQLWRUVEHIRUHDQGDIWHUWKHVHOHFWRUZDVSHUIRUPHG7KHVXSSRUWXQLWIRUHOHFWULFLW\
ZDWHUDQGDLUSUHVVXUHZHUHPRXQWHGWRJHWKHUZLWKYDULRXVFDEOHFKDQQHOV6$16ZLOOXVHD<br />
FRPPRQSXPSLQJVWDWLRQZLWKWKH.:6DQGWKH.:6IURP-&16)RUVFKXQJV]HQWUXP<br />
- OLFK7KHSLSHLQVWDOODWLRQIURPWKHSXPSLQJVWDWLRQWRWKHIRUHVHHQGHWHFWRUYHVVHOLVUHDG\<br />
7KHVRIWZDUHKDVWREHLQWHJUDWHGLQWKHV\VWHPWRDOORZWKHSRVVLELOLW\WRZRUNZLWKRQHRU<br />
ERWKSXPSVLQWKHSXPSLQJVWDWLRQLIWKHUHLVDUHTXHVW$VZHOODPDWFKLQJLVQHFHVVDU\LIWZR<br />
RUWKUHHGHWHFWRUYHVVHOVGHPDQGSXPSLQJWLPHDWWKHVDPHPRPHQW<br />
)RUWKHGHWHFWRUDQGWKHGHWHFWRUYHVVHODOOWHFKQLFDOGUDZLQJVZHUHSHUIRUPHGDQGPDQ\<br />
FRPSRQHQWVKDGDUULYHGIRUWKHVHWXS,QFOXGHGLQWKLVSDUWRIWKHSURMHFWLVWKHLQWHJUDWLRQRI<br />
DSODWIRUPRQWRSRIWKHGHWHFWRUYHVVHO7KLVSODWIRUPZLOOEHXVHGIRUWZRKXWFKHVDZRUN<br />
EHQFKDORFDWLRQIRUVDPSOHSUHSDUDWLRQFXSERDUGVHOHFWURQLFUDFNVHWF7KHGHOLYHU\RIWKH<br />
SODWIRUPLVVFKHGXOHGIRU-DQXDU\DQGZLOOEHEXLOGXSZKHQWKHWHVWVRIWKHYDFXXPRI<br />
WKHGHWHFWRUYHVVHOLVILQLVKHG<br />
<br />
7KHPDLQWDVNLQWKH\HDUZLOOEHWKHLQVWDOODWLRQRIWKHGHWHFWRUYHVVHOLQFOXGLQJWKH<br />
LQWHUQDOVHVSHFLDOO\WKHGHWHFWRUDQGWKHPRYDEOHGHWHFWRUV\VWHP<br />
<br />
<br />
<br />
)LJ<br />
7ZRSRODULVHUVOHIWDQGPLGGOHDQGRQHQHXWURQJXLGH1L ULJKWDUHPRXQWHGRQDPRYDEOH<br />
WDEOH8VKDSHGVXSSRUWRIVRIWLURQLVXVHGWRPRXQWSHUPDQHQWPDJQHWV<br />
<br />
<br />
<br />
<br />
<br />
<br />
<br />
<br />
<br />
<br />
<br />
)LJ6FKHPDWLFGUDZLQJRIRQHIUDPHZLWKDWDEOHDQGPRXQWHGRSWLFV<br />
<br />
<br />
<br />
)LJ6SLQ)OLSSHUVHWXSLQVWDOOHGIRUDILUVWWHVWDWWKHLQVWUXPHQW0,5$
)LJ7KHLQQHUOLIHRIWKHFROOLPDWLRQV\VWHPZLWKPRYDEOHWDEOHVWRSRVLWLRQYDULRXV<br />
FRPSRQHQWVLQWKHQHXWURQEHDP<br />
<br />
5HIHUHQFHV<br />
<br />
>@5*LOOHV$2VWHUPDQQ&6FKDQ]HU%.ULPPHU:3HWU\<br />
3K\VLFD%<br />
>@5*LOOHV$2VWHUPDQQ:3HWU\<br />
-$SSO&U\VWV<br />
>@7.HOOHU7.ULVW$'DQ]LJ8.HLGHUOLQJ)0H]HLDQG$:LHGHQPDQQ1XFO,QVWU<br />
DQG0HWK$
Forschungsneutronenquelle Heinz Maier-Leibnitz (FRM II)<br />
Lichtenbergstr. 1<br />
85748 Garching, Germany www.frm2.tum.de<br />
Texture investigations on STRESS-SPEC<br />
Experimental team:<br />
M. Boin 1 , C. Randau 2 , M. Hofmann 3<br />
1 <strong>Helmholtz</strong> Centre Berlin for Materials and Energy, 2 IWW TU-Clausthal, 3 FRM2 TU-Munich<br />
Instrument: STRESS-SPEC, 17.-24.03.2008<br />
Local contact: C. Randau<br />
Two experiments were carried out using neutron diffraction on the STRESS-SPEC instrument. We<br />
investigated the crystallographic orientation distribution, i.e. texture, of two different samples.<br />
The preferred crystal orientations have been determined by peak intensities of diffracting lattice<br />
planes at different sample positions and orientations. Therefore, the samples were rotated around<br />
360 degrees and tilted by 90 degrees in small angular steps. For each step the intensity of a<br />
reflection has been captured and transformed afterwards into a pole figure using the newly<br />
developed software ‘StressTexCalculator’ [1].<br />
TD<br />
ND<br />
RD<br />
Pos. 1<br />
(a)<br />
RD<br />
(b)<br />
Pos. 2<br />
Pos. 3<br />
Figure 1: (a) Textured Al cylinder sample; (b) Extruded Mg AZ31 sample - RD, TD and ND<br />
represent the rolling, transverse and normal direction respectively<br />
The texture of a drawn, cylindrical Al wire sample (see figure 1a) was investigated as part of Bragg<br />
edge neutron transmission studies [2, 3] in order to provide reference data for comparison and<br />
further developments on the transmission method. The sample was expected to have axial<br />
symmetric fibre texture, being isotropic for the whole volume.<br />
The primary and secondary windows were selected to be big enough to set the whole sample<br />
volume inside the neutron beam of the STRESS-SPEC instrument, i.e. the global orientation<br />
distribution was measured. We selected the strongest reflections of the Al sample to be captured by<br />
the 2D detector of the instrument that detects Debye-Scherrer ring sections providing information<br />
about different orientations. For each reflection we set the angular step width of the output pole<br />
figure grid to 5 degrees - for the sample rotation and tilting likewise.<br />
m.r.d.<br />
TD<br />
TD<br />
TD<br />
6,5<br />
6,1<br />
5,7<br />
5,3<br />
4,8<br />
4,4<br />
4,0<br />
3,5<br />
3,1<br />
2,7<br />
2,2<br />
1,8<br />
1,4<br />
1,0<br />
0,5<br />
0,1<br />
ND<br />
ND<br />
ND<br />
Figure 2: From left to right: Pole figures of (111), (200) and (311) reflection showing the<br />
intensity distribution normalised to multiples of a random distribution.
Forschungsneutronenquelle Heinz Maier-Leibnitz (FRM II)<br />
Lichtenbergstr. 1<br />
85748 Garching, Germany www.frm2.tum.de<br />
Finally, the measured peak intensities were analysed using the ‘StressTexCalculator’ software. The<br />
transformed output pole figures for different reflections are shown in figure 2. The axial symmetry<br />
of the peak intensity distribution can clearly be seen and is interpreted as fibre texture after wire<br />
drawing.<br />
A second texture measurement on STRESS-SPEC has been performed investigating an extruded<br />
Mg AZ31 [4] sample (see figure 1b). This time the interest was focussed to resolve local changes of<br />
the texture inside the sample.<br />
The original sample was cut into two L-shaped pieces to perform Bragg edge experiments in<br />
parallel. The crystallographic orientation distribution at different local positions around the bend<br />
was analysed. Therefore, we selected three positions as indicated in figure 1b. The gauge volume<br />
was defined by a 1mm x 1mm slit system small enough to keep it constantly inside the sample for<br />
all rotation and tilting positions. A Eulerian cradle equipped with linear x-y-z-translation tables was<br />
used to drive to the three selected local positions. Also, the monochromator setup on STRESS-<br />
SPEC was changed (we used graphite) to provide more neutron flux, instead of divergence and<br />
wavelength accuracy, which is not needed for texture determination.<br />
For the pole figure analysis we also applied an absorption correction for each investigated sample<br />
position, but its influence on the results is negligible.<br />
m.r.d.<br />
RD<br />
RD<br />
RD<br />
12,9<br />
12,0<br />
11,2<br />
10,3<br />
9,5<br />
8,6<br />
7,8<br />
6,9<br />
6,0<br />
5,2<br />
4,3<br />
3,5<br />
2,6<br />
1,8<br />
0,9<br />
0,1<br />
ND<br />
ND<br />
ND<br />
TD<br />
Figure 3: Pole figures of (002) reflection. From left to right: specimen position 1, 2 and 3.<br />
The resulting pole figures show the orientation variation depending on the local position. Pole<br />
figures for the (002) reflection are shown in figure 3 for representing the three selected positions.<br />
The first pole figure shows the basal planes being arranged perpendicular to the rolling direction<br />
(RD), which is an atypical orientation for extruded materials and could be explained by the<br />
additional shaping and/or re-crystallization processes. This behaviour has been compared and<br />
agreed with inverse pole figure X-Ray measurements [5]. The orientation arrangement changes with<br />
position as can be seen in the 2 nd and 3 rd pole figures. If we re-arrange the coordinate system by<br />
changing normal and transverse direction for the 3 rd position (see TD and ND labelling in the 3 rd<br />
pole figure), similarities to a cold rolling texture [6] can be seen.<br />
The texture analysis of the two presented samples has shown that we are able to investigate global<br />
and local orientation distributions on STRESS-SPEC, even with small gauge volumes.<br />
The quantitative results will be used for the development of the Bragg edge transmission method.<br />
References:<br />
[1] C. Randau, FHTW Berlin, 2007, diploma thesis<br />
[2] J.R. Santisteban et al. / Nuclear Instruments and Methods in Physics Research A 481 (2002) 765.768<br />
[3] M. Boin, experimental report BENSC, MAT-04-1443-EF, MAT-04-1354-EF<br />
[4] S. Müller, TU-Berlin, 2007, phd thesis<br />
[5] W. Reimers, unpublished report<br />
[6] A. Styczynski et al. / Scripta Materialia 50 (2004) 943–947
Texture gradient in a bonelike extrusion profile of Mg Ze10 <br />
Experimental team:<br />
H.-G. Brokmeier 1 , U. Garbe 2 , C. Randau 1 , P. Spalthoff 2 , J. Bohlen 2<br />
1 Institute for Materials Science and Engineering, Clausthal University of Technology,<br />
Germany<br />
2 GKSS Research Center <strong>Geesthacht</strong>, Max-Planck-Str., <strong>Geesthacht</strong>, Germany<br />
Instrument: Stress-Spec, 30.03.2007 – 04.04.2007<br />
Local contact: Ulf Garbe<br />
Investigation of texture gradients or local textures in bulk samples needs comparably long counting<br />
times. This is related to small gage volumes. In our case we use a slit system of 2x2mm² to get on<br />
one hand sufficient local resolution and on the other hand to optimise the total counting time.<br />
Moreover, to reduce the total counting time we restrict the set of theoretically necessary six<br />
experimental pole figures to three pole figures. Mg (10.0), (00.2) and (10.1) were obtained<br />
simultaneously with the STRESS-SPEC area detector at one detector position. A description of<br />
STRESS-SPEC was given by Hofmann et al. [1]. Three different types of samples were cut from<br />
the bonelike extrudate, see figure 1. Due to the restricted beamtime we were using only the<br />
rectangular sample at 6 positions. ED, TD and ND describe the sample orientation due to extrusion<br />
direction ED.<br />
Fig.1: Set of samples cut from a long bonelike extrudate (marked points are for texture gradient<br />
investigations.<br />
Position 1 was just in the middle of the bonelike extrudate, so that we expect a texture close to<br />
rectangular extrusion. Fig. 2 (left) shows such a typical (00.2) basal plane pole figure. Rectangular<br />
extrusion leads to a double or a single central maximum related to the alloy, a second maximum on<br />
the outside and a weak girdle connecting these maxima. 7.4 mrd (mrd - multiple random) is a<br />
medium type texture. The (10.0) pole figure in Fig. 2 (right) includes the zone pole to the<br />
information of (00.2) with a maximum degree of orientation as 9.4 mrd. Relative intensities and<br />
girdle structure depends on the alloy and the cross section of the extrusion die (round, quadratic,<br />
rectangular).
Texture gradient in a bonelike extrusion profile of Mg Ze10 <br />
(00.2) (10.0)<br />
Fig. 2: Mg (00.2) pole figure (left) and (10.10) pole figure (right) with a typical magnesium<br />
extrusion texture with rectangular die (sample position 1)<br />
On the other side of the sample at position 6 the bonelike structure was close to a round sample. In<br />
Fig. 3 the (00.2) pole figure is shown. The texture is more like a girdle and no maxima are found.<br />
This is typical for round extrusion. One can see clearly that this girdle has a little tilt against eastwest<br />
direction that indicates a shear. Materials flow in the round part of the bonelike extrudate is<br />
not homogeneous. This asymmetry comes out clearer looking at positions 5, 4 and 3.<br />
position 6 position 5<br />
Fig. 3: Mg (00.2) pole figure at position 6 (left) and position 5 (right)<br />
It can be concluded, that positions 1 and 2 show textures close to rectangular extrusion with no<br />
information of the flow characteristics of the outer part. The described texture components (central<br />
maxima, girdle and maxima at the outer ring) change in the transition zone between rectangular and<br />
round part of the bonelike structure. This texture gradient results in gradients of materials<br />
properties.<br />
References:<br />
[1] M. Hofmann, J. Robelo-Kornmeier, U. Garbe, R.C. Wimpory, J. Repper, G.A. Seidl,<br />
H.-G. Brokmeier, R. Schneider: STRESS-SPEC: Advanced Materials Science at FRM-II,<br />
Neutron News 18, 27-30, 2007.
Appendix II<br />
Reports of experiments carried out<br />
at the GKSS outstation at DESY in Hamburg<br />
in support of internal and external users.<br />
These reports have been taken from<br />
HASYLAB Annual Report 2008.<br />
(Reprinted by courtesy of DESY, Hamburg)<br />
293
294
GKSS Research Centre <strong>Geesthacht</strong><br />
Outstation at DESYª<br />
Material science research<br />
with high-energy X-rays<br />
The outstation of the GKSS Research Centre <strong>Geesthacht</strong> at<br />
DESY provides instrumentation for investigating engin eering<br />
materials and biomaterials with imaging and diffraction techniques.<br />
Until 2010, it will develop into the German Engineering<br />
Materials Science Centre for Research with Photons (GEMS-P).<br />
Together with the complementary GEMS-N for Research with<br />
Neutrons, GEMS will be the major point of access within the<br />
<strong>Helmholtz</strong> Association for users in scientic and applied engineering<br />
materials research with photons and neutrons.<br />
The current GKSS Outstation (and thus the future GEMS-P)<br />
comprises a suite of instruments at the DESY storage rings<br />
with an emphasis on the use of the new and most brilliant<br />
synchro tron radiation source PETRA III. Two high-energy<br />
beamlines (HARWI II at DORIS III, HEMS at PETRA III) and a<br />
beamline optimized for micro- and nano-tomography (IBL at<br />
PETRA III) address the requirements of research in materials<br />
science over a wide range of X-ray energies and of spatial resolution.<br />
These facilities have been funded by major investment<br />
grants from the HGF. The BioSAXS beamline at PETRA III (in<br />
collaboration with EMBL) is optimized for time-resolved soft<br />
matter structure research.<br />
HARWI II was constructed in 2004 – 2006 at the site of DESY’s<br />
rst beamline for high-energy radiation HARWI (Hard Radiation<br />
Wiggler), making use of a new wiggler providing a broad beam<br />
up to 7 × 1 cm 2 for the investigation of large strongly absorbing<br />
samples. The beamline is optimized for research with monochromatic<br />
and white beam, large view and moderate resolution,<br />
using high-energy X-rays (20-250 keV). HARWI II is in full user<br />
operation, highly overbooked and very well accepted in the<br />
materials science community with experiments in the elds of<br />
texture, residual stress and structure analysis, absorption microtomography,<br />
and high-energy small-angle scattering. In 2008,<br />
a new materials science diffractometer for heavy loads up to<br />
600 kg has been commissioned (see Fig. 1). It can be equipped<br />
with a Eulerian cradle for exible orientation of small samples<br />
and with various sample environments (from temperature control<br />
to stress rigs). The set-up has been completed by a new<br />
large-area two-dimensional detector. The spacious experimental<br />
hutch of HARWI II allows for the installation of novel in situ experiments.<br />
The most prominent example is the in situ friction stir<br />
welding apparatus FlexiStir with very successful diffraction and<br />
Figure 1<br />
On account of its size, the new HARWI II diffractometer is installed in a pit 1.5 m in<br />
depth. In the configuration shown, the specimen is placed in a Eulerian cradle, which is<br />
mounted in a special frame so as to permit the use of both horizontal and vertical diffraction.<br />
small-angle scattering experiments in 2008 (Fig. 2). The encouraging<br />
results trigger plans for the adaptation of other joining<br />
techniques (such as laser welding) to in situ investigations.<br />
At the wiggler beamline BW2 at DORIS III about a third of the<br />
beamtime is made available by DESY for tomography experiments<br />
operated by the GKSS Outstation tomography team,<br />
providing large eld of view experiments ex tending the photon<br />
energy range below that available at HARWI II to 7-24 keV<br />
for lower absorbing samples. A portable tomography camera<br />
58 | Research Platforms and Outstations
Figure 2<br />
(Top) In situ friction-stir welding (FSW)<br />
machine machine FlexiStir<br />
at the HARWI II beamline.<br />
The inset shows details of the welded<br />
joint. (Bottom) Small-angle scattering<br />
intensity (photon energy 70 keV) as<br />
measured 0.3 mm behind the FSW tool<br />
as a function of the tool’s feed rate.<br />
The measurements were done in situ<br />
during welding. A reduction of the<br />
SAXS intensity by one order of<br />
magnitude at small scattering<br />
vectors q was observed with<br />
decreasing feed rate.<br />
can be exibly used at the two beamlines. The construction of<br />
new tomography cameras is currently under way. In the beginning<br />
of 2009, the new instrumentation of the HARWI II tomography<br />
setup will be completed including the implementation of<br />
a phase contrast measurement method. This tomography setup<br />
is optimized for the automated investigation of a large<br />
number of samples.<br />
The projects of beamlines at PETRA III have made great progress<br />
in 2008. The High Energy Materials Science (HEMS) beamline<br />
for research with high resolution, monochromatic, high-energy<br />
X-rays (50-250 keV) from a 5 m in-vacuum undulator will encompass<br />
fundamental research in the elds of metallurgy,<br />
physics and chemistry and applied research for manufacturing<br />
process optimization and smart material development. HEMS<br />
targets the materials science and engineering community<br />
allowing measurements of large structural components up to<br />
1 t, 3DXRD investigations down to the single grain level, microtomography<br />
(see also below) and texture determination with<br />
beam sizes in the mm 2 to 50 m 2 range. The HEMS hutches<br />
and control cabins in the PETRA III hall have been nished. Most<br />
of the instrumentation has already been delivered (1 t heavy load<br />
hexapod; heavy load tables; surface/interfaces diffracto meter)<br />
or are in the design/manufacturing phase (detector portals; monochromators).<br />
The HEMS commissioning phase will start as soon<br />
as synchrotron radiation is provided by the PETRA III storage<br />
ring in 2009.<br />
The Imaging Beamline (IBL) is optimized for micro- and nanotomography<br />
with highest spatial and density resolution. Highly<br />
coherent hard X-rays (photon energy 5-50 keV) will be generated<br />
by a 2 m undulator. The IBL micro-tomography will be optimised<br />
for the automated investigation of large numbers of samples<br />
and will answer questions from materials science (e.g. imaging<br />
and quantitative analysis of pores, cracks, precipitations, phase<br />
transitions) and solve problems in the area of biomaterials (e.g.<br />
structures of cells, tissues, bones and implants). A second<br />
identical tomographic setup located at the HEMS beamline will<br />
extend the energy range to higher energies from 50-150 keV<br />
for the investigation of highly absorbing materials. In a second<br />
experimental station at IBL, new focussing possibilities will extend<br />
the spatial resolution below 100 nm for m-sized samples<br />
for nano-tomography and imaging experiments. The microtomography<br />
instruments are in the manufacturing phase and<br />
is expected to be delivered in early 2009. The IBL commissioning<br />
phase will start midyear 2009.<br />
For the EMBL BioSAXS instrument GKSS contributes the detector<br />
tube and detector platform in a exible design to allow rapid<br />
sample-detector distance changes over a range of 0.5-5 m<br />
with an additional option for vertical lift (off-set mode for anisotropic<br />
scattering). A special temperature-controlled sample<br />
environment will also be provided by GKSS. With the BioSAXS<br />
instrument GKSS will provide time-resolved measurements for<br />
the soft matter and life sciences user community, which has<br />
so far complementarily used the SANS facilities at FRG-1 and<br />
FRM II. Additionally, it will signicantly contribute to the in-house<br />
research dealing with biomaterials and polymers. The design<br />
of components is in the nal stage in order to nalise the GKSS<br />
contribution in 2009.<br />
With the new beamlines, the GKSS outstation at DESY will<br />
cover a large range of synchrotron radiation applications in<br />
materials science by using X-ray beams of various sizes from<br />
wiggler and undulator sources.ª<br />
Contact: Martin Müller, martin.mueller@gkss.de<br />
Andreas Schreyer, andreas.schreyer@gkss.de<br />
Research Platforms and Outstations | 59
The in-situ friction stir welding machine FlexiStir<br />
- First Results -<br />
T. Fischer 1 , L. Bergmann 1 , H. Loitz 2 , P. Staron 1 , J. dos Santos 1 , N. Huber 1 , A. Schreyer 1<br />
1<br />
GKSS Research Centre, Institute of Materials Research, Max-Planck-Strasse 1, 21502 <strong>Geesthacht</strong>, GERMANY<br />
2<br />
Helmut-Schmidt-University / University of the Federal Armed Forces, Holstenhofweg 85, 22043 Hamburg, Germany<br />
Friction stir welding (FSW) is a solid-state joining process, i.e. bonding takes place at temperatures<br />
below the melting point. It is characterised by a high energy efficiency and an unmatched operator<br />
and environmental friendliness. Due to its nature, the FSW process is particularly suited for light<br />
alloys and materials considered difficult to weld or not weldable by conventional fusion welding<br />
processes. In a very short time, FSW has found a multitude of applications at the high-tech end of<br />
transportation and energy industries. Therefore, in the framework of the HGF virtual institute VI-<br />
IPSUS a novel in-situ device for friction stir welding called ‘FlexiStir’ was built. The beamline<br />
HARWI II at DORIS III operated by GKSS with its outstanding experimental facilities offers the<br />
potential for investigation of modern processes in conjunction with advanced alloy systems. The<br />
FlexiStir unit was already commissioned in December 2007 during a two-day beam time at<br />
HARWI II. Precipitation, recrystallisation, and relaxation phenomena are responsible for a loss of<br />
strength in joints of Al alloys. These phenomena are triggered by the process-induced thermal cycle<br />
and the mechanical deformation and have significant consequences in the design and performance<br />
of engineering structures. Presently, the metallurgical reactions (i.e. solubilisation, re-precipitation,<br />
coarsening, nucleation, etc.) are extrapolated from post-mortem observations on welded samples.<br />
However, different alloy systems (and the respective thermo-mechanical processing in production)<br />
react differently to the joining process. The real kinetics of physical chemistry reactions is so far<br />
unknown and only estimated, i.e. from solubilisation curves and precipitation sequences derived<br />
mostly from isothermal analysis on unloaded base material samples.<br />
The photon energy chosen was 70 keV. The beamsize was confined by a first slit pair about<br />
3100 mm before the sample to a<br />
size of 0.5 × 0.5 mm 2 (H × V). A<br />
second slit pair, 1130 mm before<br />
the sample, was used for the cleaning<br />
up of the beam. The lead<br />
beamstop itself had a diameter of<br />
2 mm. It was placed between detector<br />
and the sample. The detector, a<br />
MAR345 online image plate scanner,<br />
was positioned at a distance of<br />
7030 mm behind the sample. The<br />
beam incident angle with respect to<br />
the 3,2 mm thick Al sheets to be<br />
welded was 56º. The common aluminium<br />
alloys AA7449 and<br />
AA2024 were used for the study. In<br />
the present experiment, the rotating<br />
tool advanced with a speed of 4 –<br />
8 mm/s, that allowed an exposure<br />
time of 4 s. The distance between Fig.1: FlexiStir at HARWI II beamline
eam and tool was fixed, while the exposure. These welding conditions are close to real FSW conditions.<br />
Fig. 2: Dissolution of nano-precipitates in the stir zone<br />
Figure 2 shows the results from six of the welded sheets in comparison with the parent material.<br />
The distance form the tool increased from 0.3 mm to 2.8 mm distance from the tool shoulder in the<br />
heat stir zone of the weld. Responding to the growing distance, the investigated material gets older<br />
in the thermo-mechanical history, in this connection a re-precipitation effect can be seen. In the<br />
heat-affected zone in front of the tool, the increasing temperature leads to a dissolution of nanoprecipitates<br />
in the unwelded base material (s. Fig.3).<br />
Fig. 3: Dissolution of nano-precipitates in the heat affected zone in front of the tool<br />
Reference<br />
[1] S. Sheikhi, R. Zettler, M. Beyer, A. Roos, H. Loitz J.F. dos Santos, Vorrichtung zum Reibrührschweißen:<br />
102005029882.6 (DE), and Vorrichtung und Verfahren zum Reibrührschweißen: 102005029881.8<br />
(DE), Patent Applications (‘FlexStir’), 2005.
External and internal structures of fossil and extant<br />
Strepsiptera (Hexapoda) using SRμCT<br />
H. Pohl 1 , F. Friedrich 1 , F. Beckmann 2 , J. Herzen 2 and R.G. Beutel 1<br />
1<br />
Institut für Spezielle Zoologie und Evolutionsbiologie, FSU Jena, 07743 Jena, Germany<br />
2<br />
GKSS-Research Centre, Max-Planck-Str. 1, 21502 <strong>Geesthacht</strong>, Germany<br />
Our investigations at DESY were performed to obtain detailed three-dimensional images of<br />
external and internal structures of extant representatives of the enigmatic insect order Strepsiptera,<br />
and of a Baltic amber fossil also belonging to this order. The data greatly increase the knowledge of<br />
the morphology of the group, hitherto based on investigations with conventional techniques such as<br />
dissection, histology, and scanning electron microscopy. The data will be evaluated aiming at a<br />
clarification of the phylogenetic relationships within the group, and will also contribute to the<br />
assessment of the systematic position within holometabolous insects, and thus help to finally solve<br />
“the Strepsiptera problem”.<br />
Specimen and specimen preparation<br />
We examined a total of 13 adult extant strepsipterans (4 species of Mengenillidae, 4 species of<br />
Stylopdia) and as a stem group representative a 39–50 million year old fossil (†Mengea tertiaria)<br />
embedded in Baltic amber. Extant specimen sizes were within a range of 2–5 mm in length and 1–3<br />
mm in diameter. They were all were fixed in 70% ethanol and critically point dried. Protruding<br />
structures were cut off in order to minimise the field of view for a maximum scan resolution. The<br />
amber surrounding of the fossil specimen (†Mengea) was remodelled to a small cylinder (5 x 2<br />
mm). Extant specimens were scanned using the photon energy of 8 KeV over 180° (0.25° steps).<br />
The detailed amber scan was performed using 11.5 KeV. To increase the density resolution the<br />
tomographical scan was performed over 360° setting the rotation axis to the side of the detector.<br />
Results<br />
SRμCT applied to the extant specimens and to the Baltic amber fossil yielded results of high<br />
quality (Figs 1, 2). The maximum resolution obtained in the extant specimens was 4.03 μm and<br />
3.03 μm in the fossil specimen. With the use of a stable SR-beam at the beamline BW2 we obtained<br />
very detailed images of the exoskeleton of the fossil specimen. It was also possible, for the first<br />
time in the study of fossil insects to our knowledge, to visualize largely preserved internal soft<br />
tissues such as the brain, antennal nerves and musculature.<br />
Discussion<br />
More or less extensive areas of amber inclusions are often partially obscured by an opaque layer of<br />
white, cloudy material. This opaqueness complicates the observation of fossils with light<br />
microscopy. SRμCT is not affected by a reduced transparency of the amber [1, 2]. In contrast to<br />
other studies [e.g. 1, 2] phase-contrast was not applied. Phase-contrast seems to be better suited for<br />
producing more detailed images of skeletal elements of arthropods embedded in amber, whereas<br />
absorption contrast apparently yields better results if the focus is on different soft tissue types, both<br />
in amber fossils and extant specimens.<br />
Acknowledgements<br />
Prof. Dr. Ragnar Kinzelbach, University of Rostock, kindly donated the †Mengea tertiaria<br />
specimen used in this study to HP. We thank Carina Dressler and Monica Koeth for their help in<br />
the collection of synchroton data and we greatly acknowledge the support of the DESY facilities.<br />
References<br />
[1] H. Henderickx, B. Cnudde, B. Masschaele, M. Dierick, J. Vlassenbroeck, and L. van Hoorebeke,<br />
Description of a new fossil Pseudogarypus (Pseudoscorpiones: Pseudogarypidae) with the use of X-<br />
ray micro-CT to penetrate opaque amber. Zootaxa, 41–50 (2006)<br />
[2] M. Heethoff, L. Helfen, and R. A. Norton, Description of Neoliodes dominicus n. sp. (Acari,<br />
Oribatida) from Dominican amber, aided by synchroton x-ray microtomography. J. Paleont, 83(1),<br />
153–159 (2009)
Figure 1: Head and thorax of a 39–50 million year old Baltic amber fossil strepsipteran †Mengea tertiaria<br />
(A, B) and the extant species Eoxenos laboulbenei (C, D). Reconstruction based on SRμCT data (2x binned)<br />
using myVGI. A, C: Frontal view; B, D: Frontal view, virtual cross section of the head. ant – antenna, br –<br />
brain, cpe – compound eye, cx1 – procoxa, fla – flabellum, fw – fore wing, hw – hind wing, le1 – foreleg,<br />
md – mandible, mdm – mandibular muscles, mxp – maxillary palp, nt1 – pronotum, nt2 – mesonotum, ol –<br />
optical lobes of the brain, ph – pharynx, phm – pharynx muscles.<br />
Figure 2: Internal anatomy of a Baltic amber fossil strepsipteran †Mengea tertiaria, virtual sagittal section.<br />
Reconstruction based on SRμCT data (2x binned) using Imaris. antn – antennal muscle, br – brain, cav –<br />
cavity, cx2 – mesocoxa, dlm – dorsal longitudinal muscle, lm – leg muscle, mxp – maxillary palp, nt1 –<br />
pronotum, nt2 – mesonotum, phm – pharynx muscle.
Synchrotron based high resolution X-ray computed<br />
microtomography of freeze dried amphibians and<br />
evolutionary reproductive morphology<br />
S. Kühnel 1 , J. Vetter 1 , T. Kleinteich 2 , J. Herzen 3 , F. Beckmann 3 and A. Kupfer 1<br />
1<br />
Institut für Spezielle Zoologie und Evolutionsbiologie mit Phyletischem Museum, Friedrich-Schiller-Universität<br />
Jena, Erbertstr. 1, 07743 Jena, Germany<br />
2<br />
Biozentrum Grindel und Zoologisches Museum Universität Hamburg, Martin-Luther-King-Platz 3, 20146<br />
Hamburg, Germany<br />
3<br />
GKSS Research Center, 21502 <strong>Geesthacht</strong>, Germany<br />
In order to understand the evolutionary biology of complex structures within organisms a<br />
comparative approach is needed. The application of synchrotron based high resolution X-ray<br />
computed microtomography (µCT) in the field of comparative evolutionary biology are<br />
virtually infinite (for examples see [1], [2]). Synchrotron imaging of a variety of both<br />
invertebrates and vertebrates gave recent novel insights into complex structure and function<br />
[3]. We use µCT imaging to elucidate the role of elaborate genital morphology in the<br />
evolution of reproductive modes in a particular group of amphibians; the caecilians or<br />
Gymnophiona (but see also previous DESY-projects on caecilian head morphology [4]).<br />
Caecilian amphibians are limbless, fossorial vertebrates inhabiting a diverse array of tropical<br />
habitats. Although caecilians only comprise of around 180 species, they show an<br />
extraordinary diversity of reproductive modes and parental care strategies (e.g. skin feeding<br />
[5]) including oviparity (aka egglaying) and viviparity (aka lifebearing). In comparison to<br />
most frogs and salamanders male caecilians possess an evertible copulatory organ, the<br />
phallodeum, to ensure internal fertilisation (Fig. 1 A,B). The current project is strongly<br />
focussed on the morphology of genital structures in various caecilian amphibians representing<br />
diverse reproductive modes. Our main objective is to describe complex structures and to<br />
reveal any correlations between specific morphologies and reproductive modes.<br />
We aim to include at least five different caecilian species representing all currently recognised<br />
reproductive modes in our study (e.g. oviparity with aquatic larva, direct development and<br />
viviparity). So far we have gathered µCT imaging-data for one species, the oviparous<br />
Ichthyophis cf. kohtaoensis. The analysis included a male (AK 158, GKSS-IDs zim12) and<br />
female (H2, GKSS-IDs zim11) cloaca. The data has been collected within 48 h at beamline<br />
BW2. The cloacae have been removed and were freeze dried prior to the µCT imaging<br />
procedure. Because the lengths of the samples exceeded the area that could be penetrated by<br />
the X-ray beam at once, several scans were performed for each sub-region and the separate<br />
datasets were subsequently reassembled.<br />
The resulting datasets show highest detail in soft tissues. The resolution of the µCT data<br />
(voxel-sizes) ranges from 2 to 9 µm, depending on the size of the sample. Single muscle<br />
fibers, nerves, and connective tissues can be easily identified in the images. Such richness in<br />
detail of vertebrate genital structures, especially within soft tissues, has never been produced<br />
before for any vertebrate (see µCT scans of skeletons and references in [5]).
Figure 1: µCT data on caecilian reproductive morphology. A: Ichthyophis cf. kohtaoensis in copula, m<br />
= male, w = female; B = everted male phallodeum of Ichthyophis cf. kohtaoensis in vivo; C = everted<br />
male phallodeum of Ichthyophis cf. kohtaoensis (AK 158, GKSS-IDs zim12), full dorsal view; D =<br />
dorsal view, outer muscle tissue removed showing details of blind sac tissue and the ureaodeum; E =<br />
mid lateral view, saggital section.<br />
The imaging of the everted male cloaca = phallodeum reveals full details and proportions of<br />
the tissues involved (Fig.1 C-E). µCT data on further caecilian species will be gathered in<br />
future session at beamline BW2. This will allow interspecific comparisons and later give a<br />
better understanding of various structures of caecilian genitalia.<br />
Initial results based on µCT imaging produced at DESY have been embedded in a talk held in<br />
January 4 th , 2009 at the Annual meeting of the Society for Integrative and Comparative<br />
Biology (SICB) in Boston, USA.<br />
References<br />
[1] O. Betz, U. Wegst, D. Weide, et al., J. Microsc. 227, 51–71 (2007)<br />
[2] M. Nickel, T. Donath, M. Schweikert, et al., Zoomorph. 125, 209-223 (2006)<br />
[3] M.W. Westneat, J.J. Socha, W.-K. Lee, Ann. Rev. Physiol. 70, 119-142 (2008)<br />
[4] T. Kleinteich, A. Summers, A. Haas, J. R. Soc. Interface (2008)<br />
[5] A. Kupfer, H. Müller, M.M. Antoniazzi, et al., Nature 440, 926–929 (2006)<br />
[6] Digital Morphology Group, University of Texas, http://www.digimorph.org (2007)
J.U. Hammel 1 , J. Herzen 2 , F. Beckmann 2 and M. Nickel 1<br />
<br />
<br />
<br />
<br />
<br />
Background<br />
Sponges (Porifera) are sessile, filter feeding animals, which display a number of sexual and asexual<br />
reproductive modes. Asexual reproduction by budding is widespread among sponges and also<br />
among other metazoans, e.g. the cnidarians like Hydra vulgaris. In the later, budding is a highly<br />
morphologically and genetically patterned process. In contrast, budding in sponges is generally<br />
characterized as a less specific morphogenetic process, since the general morphology of sponges<br />
can be assumed as less highly organized. However, some sponges display characteristic highly<br />
structured morphologies. Among them is our model sponge Tethya wilhelma [1], which we<br />
previously characterized by SR-μCT [2, 3]. In example, the three major spicule types of the<br />
siliceous skeleton are arranged into a typical star-shaped pattern of three skeletal superstructures of<br />
the adult sponge [3]. The aquiferous (canal) system also forms typical radial structures within the<br />
globular sponge body [2]. Using beamline BW2 we applied SR μCT to a series of developing buds<br />
of T. wilhelma, in order to follow the morphogenesis of the tissue, skeleton superstructures and the<br />
aquiferous system.<br />
Methodology<br />
Buds of T. wilhelma were collected from adult specimens kept in a tropical aquarium in our lab and<br />
subsequently frozen in liquid nitrogen. The buds were fixed via freeze-substitution in Methanol<br />
containing 1% OsO 4 , 2.5% Glutaraldehyde and 2.5 % H 2 O [4]. Alternatively, buds were directly<br />
fixed in 1% OsO 4 and 2.5% Glutaraldehyde in seawater. Samples were subsequently washed,<br />
dehydrated and finally critical point dried. SR-μCT scans were performed at beamline BW2 at 11<br />
keV, yielding final resolutions of between 2.84 μm and 3.01 μm respectively.<br />
Preliminary results and discussion<br />
Using the standard setup for microtomography at beamline BW2, we were able to distinguish<br />
choanocyte chambers which represent multicellular units within the sponge tissue, imaged at a<br />
voxel size of (1.42 m 3 ). Developing choanocytes in the core region of the sponge clearly stand out<br />
against the collagenous matrix (figure 1A). Due to osmium staining, it was even possible to<br />
distinguish the cells from the chamber lumen. Single cells can be recognized as single spots.<br />
However, choanocytes are around 4-5 m in diameter and thus close to the spatial resolution.<br />
Although the spatial resolution of SR-CT is lower than in light microscopy (figure 1B), it is high<br />
enough to reveal the tissue anatomy of the two main sponge functional units, the inner choanoderm<br />
core and the peripheral cortex with lacunar cavities. In the same images, the silica scleres are also<br />
clearly visualized, despite of their much higher x-ray absorption. Both, enhancing absorption of soft<br />
tissue structures using osmium tetroxide staining and minimizing the attenuation of the x-ray beam<br />
before it reaches the sample, led to a higher density resolution potential. The characteristic<br />
absorption of the structures allowed segmentation of 3D image data sets and volumetrics.<br />
We measured the volume proportions of each structure of the image volumes. We plotted all<br />
measurements corresponding to the three image stack axes. The graphs revealed characteristic<br />
spatiotemporal changes for the volume proportions and the quantitative distribution of canals, tissue<br />
and skeleton within the buds, which are schematically represented in Figure 2. The overall graph<br />
shape for each structure changes during bud morphogenesis and displays characteristic features for<br />
each stage. Newly formed buds show a homogenous distribution of tissue and aquiferous system.<br />
Step by step, it organizes into the adult phenotype, which is characterized by high shares of tissue in<br />
the choanosomal centre and of peripheral aquiferous system lacunae dominated cortex. In late<br />
buds/early functional juveniles, the three structures are represented by distinct peaks or plateaus<br />
(Fig. 2). But also the early developing cortex and choanoderm leave imprint in the graphs (Fig. 2).
All investigated buds fall into four categories which we defined by combining volumetrics, graph<br />
characteristics and qualitative characters from volume renderings. The resulting spatiotemporal<br />
morphological pattern sequence is typical for bud formation and maturation. Our results show that<br />
morphogenesis in sponge budding is a spatiotemporally highly patterned process [5].<br />
Fig. 1. Comparison of a SR-<br />
CT slice image at effective<br />
pixel size of (1.42 m 2 ) (A)<br />
and DIC light microscopy<br />
image of a histological semithin<br />
section (B) of two similar<br />
juvenile specimens (bud) of<br />
T. wilhelma. The collagen rich<br />
cortex (co) and cell rich<br />
developing choanoderm (dcd)<br />
are clearly distinguishable<br />
tissue types. Mineral scleres<br />
are visible as bright structures<br />
in the CT image: macrosclere bundles (msb), megasters (ma) and microscleres (tylasters, ta). The lacunar<br />
system cavities (lsc) stand out against the surrounding tissue. The choanocytes chambers (cc) display clear<br />
cellular staining with a darker central cavity inside (compare cc in B). Figure taken from [4].<br />
Fig. 2. Scheme of bud development in T. wilhelma. Four bud stages are characteristic, with the first three<br />
connected to the mother sponge by a stalk: Skeletal elements in red (megasclere bundles and aster spheres);<br />
megasclere bundles partly simplified as cylinders; Tissue in grey, separated into cortex (light grey) and<br />
choanoderm (dark grey). A rotational symmetry along the initial connecting stalk (st) is indicated in stages<br />
one to three. Stage 4 buds display an adult like body morphology with point symmetry to the skeleton centre<br />
(sc). Choanoderm development starts in stage 2, accompanied by the development of the megaster spheres<br />
in stage 3. The differentiation into a cortex (co) and choanoderm (cd) is characterized by the development of<br />
the aquiferous system (larger canals in stage 2; lacunae in stage 3). Body extensions (ext) (filaments) are<br />
exemplified in stage 4 buds. Figure modified from [5].<br />
References<br />
[1] M. Sarà, A. Sarà, M. Nickel, F. Brümmer, Stuttgarter Beitr. zur Naturkunde Ser. A. 631: 1-15 (2001).<br />
[2] M. Nickel, E. Bullinger & F. Beckmann, Zoomorphology 125: 225-239 (2006).<br />
[3] M. Nickel, T. Donath, M. Schweikert & F. Beckmann, Zoomorphology 125, 209-225 (2006).<br />
[4] M. Nickel, J.U. Hammel, J. Herzen & F. Beckmann, Proc. SPIE 7078W1, 1-11 (2008)<br />
[5] J.U. Hammel, J. Herzen, F. Beckmann & M. Nickel, in review.
Quantitative magnetic particle analysis by SRμCT<br />
and MRX<br />
H. Rahn 1 , I. Gomez-Morilla 1 , S. Lyer 2 , Ch. Alexiou 2 , D. Eberbeck 3 , F. Wiekhosrt 3 , H. Richter 3 , L. Trahms 3 ,<br />
S. Odenbach 1 , and F. Beckmann 4<br />
1<br />
Chair of Magnetofluiddynamics, Technische Universitaet Dresden, Dresden 01062, Germany<br />
2<br />
Department of Otorhinolaryngology, Head and Neck Surgery, University of Erlangen-Nürnberg, Erlangen,<br />
Germany<br />
3<br />
Physikalisch-Technische Bundesanstalt, Abbestrasse 2-12, D-10587, Berlin, Germany<br />
4<br />
GKSS, Max-Planck-Str.1, 21502 <strong>Geesthacht</strong>, Germany<br />
Within a DFG-funded coordinated project, two different cancer treatment methods are being<br />
investigated. Both methods, Magnetic Drug Targeting (MDT) and Magnetic Hyperthermia<br />
(MHT), coincide in the use of ferrofluids (magnetic nanoparticles in an appropriate carrier<br />
liquid), but they differ in their approach. They both make use of the strong influence of<br />
magnetic fields on the nanoparticles, with the aim of treating the cancer locally while<br />
reducing, or even eliminating, the side effects that usually occur during conventional cancer<br />
treatments. In case of MDT the magnetic nanoparticles are used as drug carriers directed by a<br />
strong magnetic field gradient, while for MHT they are used to induce local heat transfer<br />
within the respective tissue, forced by an alternating magnetic field.<br />
One of the important stages of MDT is the delivery of the ferrofluids carrying drugs into the<br />
tumor region after their injection through the supplying vessels. At present few groups study<br />
the behaviour of ferrofluids in a circuit flow. For our experiments bovine femoral arteries<br />
have been used which are streamed by a physiological medium. Ferrofluid is injected into the<br />
artery following the usual medical protocol for MDT and is retained in the central part of the<br />
artery by an electromagnet. The concentration and accumulation of magnetic nanoparticles<br />
within the arteries are analysed by magnetorelaxometry (MRX) and micro computed<br />
tomography (μCT) [1, 2]. After the flow experiment the artery was sampled into approximate<br />
equal segments, fixed with formalin and embedded in paraffin, to make the tissue stable for<br />
further analysis – MRX and μCT. The latter shall provide the 3-dimensional distribution of<br />
magnetic nanoparticles within the artery samples.<br />
Fig. 1: A bovine artery is rinsed with physiological medium. Ferrofluid is injected into the flow,<br />
while a strong magnetic field gradient (16 T/m) is influencing the ferrofluid flow.<br />
After the flow experiment the artery was sampled into approximate equal segments, fixed<br />
with formalin and embedded in paraffin, to make the tissue stable for further analysis – MRX<br />
and μCT. The latter shall provide the 3-dimensional distribution of magnetic nanoparticles<br />
within the artery samples.
MRX @ PTB Berlin and SRμCT @ HASYLAB<br />
MRX is a very sensitive technique to determine the iron content within a sample. The MRX<br />
measurements were performed with a single-channel superconducting quantum interference<br />
device (SQUID) gradiometer by the work group of Dr. Trahms at PTB Berlin.<br />
Tomographic examination of the biological samples was performed in cooperation with L.<br />
Gaab and F. Giese on the tomography equipment operated by the GKSS. The measurements<br />
were performed at BW2-beamline using the photon energy of 17 keV and an optical<br />
magnification of 2.5 resulting in a pixel size of 4.5 μm.<br />
Fig. 2: Schematic drawing of the bovine arteries samples measured with MRX. The numbers below<br />
each element give the iron content in arbitrary units.<br />
Results<br />
The combination of MRX and SRμCT provides important information for better<br />
understanding of directed ferrofluid delivery process during the MDT. The main points are<br />
listed beneath.<br />
• The different ways of pumping the flow could be identified.<br />
• Far away from the gradient, the nanoparticles accumulate at the inner walls of the<br />
artery.<br />
• Where the gradient is strongest, the nanoparticles accumulate at the inner walls of the<br />
artery but also block the vessel.<br />
Fig. 3: Cross-sections of bovine arteries<br />
References<br />
[1] R .Jurgons et al, J. Phys.: Condens. Matter 18 S2893–902 (2006)<br />
[2] C. Seliger et al, J. Magn.Magn. Mater. 311 358–62 (2007)
Cellular and molecular mechanisms of bone regeneration<br />
in a sub-critical defect model using diabetic rats<br />
C. Hamann, C. Goettsch, R. Bernhardt 1 , F. Beckmann 2 ,<br />
J. Herzen 2 , D. Scharnweber 1 , L. C. Hofbauer<br />
Dept. of Medicine III, Division of Endocrinology, Diabetes and Bone Diseases, TU Dresden, Germany<br />
1<br />
Max Bergmann Center for Biomaterials, TU Dresden, Germany<br />
2<br />
Institute for Materials Research, GKSS Research Centre <strong>Geesthacht</strong>, Germany<br />
Introduction<br />
Bone metabolism and bone regeneration are severely disturbed in diabetes mellitus, causing delayed<br />
healing of bone fractures and prolonged hospitalization periods for affected patients. The precise<br />
basic mechanisms underlying these alterations are poorly understood. The aim of this study is<br />
to characterize bone defect healing in a diabetic rat model and to analyze the fundamental differences<br />
between diabetic and non-diabetic bone regeneration at the molecular and cellular level.<br />
For that purpose, we used the Zucker Diabetic Fatty (ZDF) rat model, an established rat model of<br />
type 2 diabetes mellitus. The ZDF rats develop their diabetic phenotype by overeating due to impaired<br />
satiety sensing after 8 weeks. By week 1, they display various macroscopic and microscopic<br />
diabetic complications, including vascular, renal, and neurologic complications.<br />
There is evidence that impairment of bone formation and/or turnover is associated with the metabolic<br />
abnormalities characteristic of type 2 diabetes mellitus. However, bone regeneration/repair in<br />
type-2 diabetes has not been evaluated. We established a type 2 diabetic defect model to evaluate<br />
the differences in bone regeneration and defect healing. Using the ZDF rat model, a defect of 3 mm<br />
in the left femur was created after stabilizing the femur by a 4-hole-plate. This surgical procedure<br />
was per-formed under sterile conditions, and all animals received antibiotics for 48 h after surgery.<br />
Materials & Methodes<br />
To document the defect and the appropriate and stable position of the plate, a plain X-ray was performed<br />
immediately after surgery. All animals were mobile on the first day after surgery and<br />
moved normally. X-rays were performed every two weeks to assure the correct position of the plate<br />
and to monitor semi-quantitatively the bone regeneration. In addition, we will harvest osteoblastic<br />
and osteoclastic cells and analyze their proliferation and differentiation capacities. From the newly<br />
formed bone tissue, RNA will be isolated and the gene expression of regulators of bone formation,<br />
bone resorption, and angiogenesis will be evaluated by real-time PCR.<br />
By week 8 samples of the femur bone together with the metallic plate were used for a nondestructive<br />
investigation with Synchrotron micro computed tomography (SR CT). The SR CT<br />
measurements were performed with the GKSS CT-device at HASYLAB beamline BW2. A single<br />
femur segment with a diameter of about 1 cm was investigated. The photon energy was set to<br />
55 keV. With an optical magnification of 2.72 an image resolution of 10.9 m was reached. Finally<br />
6 positions along the femur were investigated using a 360° scan for each position.
Results<br />
The visualisation of the SR CT-data from the rat femur sample shows a clear reproduction of the<br />
bone conditions around the 4-hole-plate (Fig. 1). Inside the defect newly formed bone tissue with<br />
different mineralisation degree could be detected (Fig. 2).<br />
5 mm<br />
5 mm<br />
Fig 1: 3D-View of the joint with metallic plate<br />
and screws from SR CT-investigation using a<br />
photon energy of 55 keV.<br />
Fig. 2: Slice through a 3D-visualisation of the rat<br />
femur: bony tissue (grey), metallic plate (purple)<br />
and soft tissue (orange).<br />
For the future we will quantitatively analyse the process of bone regeneration in diabetic vs. nondiabetic<br />
rats over 8 to 14 weeks after surgery using SRμCT (with the plate in place) as well as conventional<br />
μCT (following removal of the plate).<br />
Acknowledgements<br />
The authors gratefully acknowledge the support of this work by the GKSS, the BMBF, the MeD-<br />
Drive programme of the Dresden Technical University Medical Center and the Elsbeth Bonhoff-<br />
Foundation.
Synchrotron-radiation based microtomography reveals<br />
3D microstructure of Mg-Al-Zn alloy<br />
F. Witte, J. Fischer, F. Beckmann 1 , J. Herzen 1 and N. Hort 1<br />
Laboratory for Biomechanics and Biomaterials, Hannover Medical School,<br />
Anna-von-Borries-Str. 1-7, 30625 Hannover, Germany<br />
1<br />
GKSS Research Center, Max-Planck-Str. 1, 21502 <strong>Geesthacht</strong> ,Germany<br />
The beta phase Mg 17 Al 12 influences high temperature strength as well as corrosion properties of<br />
Mg-Al-Zn alloys. Mg 17 Al 12 develops during casting and its morphology depends on heat treatments<br />
and processing. Normally the beta-phase, its morphology and distribution are determined by<br />
standard metallographic methods leading only to a two dimensional picture. Synchrotron-radiation<br />
based microtomography is able to give a 3D image of the microstructure and was used to<br />
characterize the distribution of Mg 17 Al 12 and Al 8 Mn 5 in as-cast Mg-Al-Zn alloys [1].<br />
Synchrotron-radiation based microtomography (SRμCT) allows the 3D reconstruction of a<br />
specimen from a set of 2D projections using the backprojection of filtered projection algorithm [2].<br />
The SRμCT was performed at Hamburger Synchrotronstrahlungslabor HASYLAB at Deutsches<br />
Elektronen Synchrotron DESY (Hamburg, Germany). The specimens were imaged by<br />
microtomography in absorption mode utilizing synchrotron radiation at beamline BW2 using 16<br />
keV photon energy. Exposed to the parallel synchrotron X-ray beam, the sample was precisely<br />
rotated 0.25° stepwise to 180°, and after every fourth step the reference image (projection) was<br />
recorded to eliminate intensity inhomogeneities and variations of the X-ray beam. The projections<br />
of the parallel beam were detected using a fluorescent screen made of a CdWO4 single crystal of<br />
200 μm thickness. The optical images were recorded by the use of a video-camera lens with a focal<br />
length of 25 mm in front of the CCD chip, 1536 x 1024 pixel each 9 x 9 μm2 (Kodak KAF 1600)<br />
with 14 bit digitization at a frequency of 1.25 MHz (KX2, Apogee Instruments). The 3D structure<br />
was finally reconstructed from 720 two-dimensional projections using the BKFIL-procedure of the<br />
DONNER-library [3]. The specimens were investigated in two different positions of the z-axis to<br />
scan the total volume at optimal spatial resolution. These two separately reconstructed datasets<br />
were finally stacked to an entire dataset. The voxel size of an unbinned dataset was 1.35 μm, the<br />
magnification was 6.673 and the spatial resolution was 2.59 μm. Histograms of reconstructed data<br />
were used to determine thresholds for the different compositions of the tomogram (Fig.1) [4].<br />
Figure 1: The histogram shows the total amount of voxels in the reconstructed data set displayed as the<br />
frequency of voxels depending on their specific attenuation value. Gaussian fits of measured attenuation<br />
values of the material compositions was used to demonstrate the most predominant components of the<br />
recorded data set. (*) Al-Mn-phases showed a broad shoulder of just 10.000 voxels, probably due to partial<br />
volume effects of the minute amount of tiny Al-Mn-phases.
The microtomography using synchrotron-radiation revealed the 3D distribution of the beta-phases,<br />
micro pores and high density areas of Al-Mn particles (Fig. 2, a + b). The typical microstructure of<br />
Mg 17 Al 12 precipitates in the form of secondary, lamellar structures could be observed in 3D<br />
reconstructions (Fig. 2).<br />
Figure 2: The diagram (a) shows 3D-segmented beta-phases (yellow), micropores (blue) and Al-Mn-phases<br />
(red) in an as cast AZ91D. The diagram (b) shows an magnification of (a), demonstrating the lamellar<br />
character of the beta-phases enclosing the Al-Mn-phases in a kind of network.<br />
Scale bar: (a) = 150 μm, (b) = 50 μm.<br />
References<br />
[1] Witte, F., Fischer, J., Beckmann, F., Störmer, M., Hort, N., Scripta Materialia, 58 (6), 453, (2008)<br />
[2] A.C. Kak, M. Slaney, Principles of Computerize Tomographic Imaging, IEEE Press, 1988.<br />
[3] G. Herman, Image reconstruction from projections, implementation and applications,<br />
Springer, Berlin, Heidelberg, New York, 1979.<br />
[4] B. Müller, F. Beckmann, M. Huser, F. Maspero, G. Szekely, K. Ruffieux, P. Thurner,<br />
E. Wintermantel, Biomol. Eng. 19 (2002) 73.
Artifact Reduction in three-dimensional Dental<br />
Imaging using Micro Computed Tomography<br />
M. Luckow 1,2,3 , D. Berndt 2 , J.T. Lambrecht 2 , F. Beckmann 4 , H. Deyhle 1,3 , J. Ratia 1 , and B. Müller 1,3<br />
1<br />
Biomaterials Science Center, University of Basel, 4031 Basel, Switzerland<br />
2<br />
Department of Oral Surgery, Oral Radiology and Oral Medicine, University of Basel, 4056 Basel, Switzerland<br />
3<br />
Materials Science Institute of Dental School, University of Basel, 4056 Basel, Switzerland<br />
4<br />
Institute of Materials Research, GKSS-Research Center, 21502 <strong>Geesthacht</strong>, Germany<br />
Introduction<br />
Metal implants for accurate restorations in dentistry have been widely accepted to treat patients,<br />
who need a tooth root replacement. Dental cone beam computed tomography (CBCT) is an<br />
effective tool for pre-operative planning and implant selection. The cross-sectional images allow<br />
the selection of the appropriate implant length and diameter as well as the appropriate implantation<br />
site. CBCT can not be utilized likewise for the post-operative imaging because huge artifacts<br />
appear as dark bands and streaks around the metal objects. In order to understand the related<br />
phenomena and finally to reduce the artifacts, dental CBCT scans of a porcine mandible with two<br />
commercial available titanium implants were performed varying the accelerating voltage, the beam<br />
current and the position of the mandible with respect to source and detection unit. In order to<br />
determine a baseline for comparison, micro computed tomography (μCT) and synchrotron<br />
radiation-based micro computed (SRCT) data were generated, which did not contain these huge<br />
artifacts.<br />
The patient’s head between X-ray source and detection unit is oriented that the strongly absorbing<br />
teeth and implants are in a single plane. This is the worst case, since all highly X-ray absorbing<br />
components in line cause the strongest artifacts. We hypothesize that tilting the patient’s head will<br />
significantly reduce artifacts. The effect should be especially clear for patients with multiple<br />
implants, because the tilting can prevent the overlapping of the strongly X-ray absorbing materials.<br />
Sample Preparation and Tomography Imaging<br />
For the current study, two titanium-implants (Institut Straumann AG, Villeret, Switzerland) each<br />
4.1 mm in diameter and 10 mm in length were inserted into a porcine mandible. The dental CBCT<br />
3D Accuitomo 60 (Accuitomo, Morita, Japan) provided the volumetric data. For the μCT<br />
measurements with the Skyscan 1172 (Skyscan, Kontich, Belgium) a cylinder (30 mm in diameter)<br />
hosting the two implants was extracted from the mandible.<br />
Figure 1: Left: Set up for dental CBCT (Accuitomo 60). The region of interest is marked in red. Right: For<br />
comparison, all tomography data were pre-registered via the manual selection of 3 non-collinear anatomical<br />
landmarks. (Top: μCT Skyscan 1172; bottom: dental CBCT data).
SRμCT Measurements<br />
SRCT measurements were performed at the beamline W 2 (HASYLAB at DESY, Hamburg,<br />
Germany) using the photon energy of 76 keV. The 30 mm sample was larger than the field of view<br />
of the X-ray detection unit. Therefore, scans for four lateral and two vertical sample positions were<br />
reassembled. The resulting reconstructed volume of (1199 1199 332) voxels corresponds to<br />
32.3 mm 32.3 mm 8.9 mm.<br />
Figure 2: Left: Volume renderings of the total volume with different sagittal cuts (step size: 1.5 mm).<br />
Right: 3D representation of the segmented implants and teeth. The position is shown by different horizontal<br />
cuts of the mandible.<br />
Conclusion<br />
The CT data provide the baseline to be used for the quantification of artifacts in clinical CT [1].<br />
Because of the improved image quality and the artifact-free visualization of additional features,<br />
SRμCT yields an even better defined standard for the optimization purposes. In both cases, the<br />
clinical CT data acquired at different accelerating voltages, beam currents and geometrical<br />
arrangements can be directly compared for the empirical optimization. As expected, the increase in<br />
the accelerating voltage from 70 to 80 kV in CBCT improves the image quality [1]. The dark bands<br />
at the bone-implant interfaces become weaker, the white streaking artifacts in the axial planes are<br />
significantly reduced. Preliminary results indicate that tilting the patient’s head permit a significant<br />
reduction of artifacts [2]. Further data evaluation is necessary to finally instruct the CBCT operator<br />
how to image the human mandible in position, which mainly supports the accurate post-operative<br />
evaluation.<br />
The authors thank HASYLAB at DESY, Hamburg, Germany for beam-time allocation (II-<br />
20060035 EC). The support of Julia Herzen, GKSS, at the beam-line is gratefully acknowledged.<br />
References<br />
[1] D. Berndt, M. Luckow, J.T. Lambrecht, F. Beckmann, B Müller: Proc. SPIE 7078 (2008) 70780N.<br />
[2] M. Luckow et al.(manuscript in preparation)
Crack visualization within laser-welded aluminiumalloy<br />
T-joints using SRCT<br />
J. Herzen, F. Beckmann, S. Riekehr, F. S. Bayraktar, A. Haibel, P. Staron, M. Koçak, and A.<br />
Schreyer<br />
Institute of Materials Research, GKSS Research Centre, <strong>Geesthacht</strong>, Germany<br />
Using laser welding in fabrication of metallic airframes reduces the weight and hence fuel<br />
consumption. Currently, only a limited number of fuselage parts of civil aircrafts are welded due to<br />
stringent damage tolerance requirements. Laser beam welded aluminium-alloys may contain<br />
isolated small process pores and their role and interaction with growing crack need to be<br />
investigated.<br />
The synchrotron radiation based micro computed tomography (SRμCT) is an established imaging<br />
method in the field of materials science. It combines the advantages of a non-destructive 3D<br />
visualization with high spatial resolution and a high density resolution due to the intense,<br />
monochromatic X-ray beam that is used for testing. In this work we visualized the cracks within<br />
laser-welded aluminium-alloy T-joints by means of SRμCT.<br />
The T-joints were welded using the in-house Nd:YAG laser with a welding speed of 1200 mm/min<br />
and a welding angle of 25°. The clip material for all samples was AA6013 T6 with a thickness of 2<br />
mm thick. For the skin different materials were used to vary the amount of pores from very high<br />
(PA734T79) to very low (AA2139 T3). A 1.2 mm thick silicon wire (AA4047) was used as filler<br />
material. The travel speed of the wire was 4 m/min. After the welding process the T-joints were cut<br />
to size of 30 mm and a notch was introduced near the weld to initiate a crack. With a short<br />
vibration of 25 Hz, a traverse speed of 0.2 mm/min and 50 kN force of the testing machine the<br />
initiated cracks were propagated on a distance of about 2 millimeters. Then a tomography scan was<br />
performed to see the inner structure of the weld, the pore distribution, and the crack before putting<br />
higher static load on the sample. After the first tomographic scan the samples were loaded with the<br />
same parameters as described above. During this loading the crack was propagated on a distance of<br />
about 10 mm. Finally, a second tomographic scan was done to study the crack propagation.<br />
As the sample dimension (30 mm) exceeded the maximum field of view of the tomography<br />
detector, a “region-of-interest” (ROI) tomography was performed. For a complete tomographic<br />
scan 720 radiographic projections of the sample are taken in equidistant rotation steps of 0.25<br />
degree in the angular range from 0° to 180° for the ROI and 1440 projections for the outer region of<br />
the sample. Each 2 degrees the sample was moved out of the beam and an image is taken, which is<br />
used for flat field correction. To reconstruct the 3D structure from the projections the filtered back<br />
projection algorithm is used. The projections with the sample are normalized by the reference<br />
projections without the sample, so that the obtained projections represent the absorption of the<br />
sample at different angles. The reconstruction then provides then volumetric information about the<br />
absorption of the sample in 3D. The reconstructed data is stored as a floating point volume and<br />
processed by VGStudio Max® (Volume Graphics GmbH, Heidelberg, Germany) to a volume<br />
rendering dataset.<br />
All measurements were performed at the beamline HARWI-II [1], which is operated by the GKSS<br />
Research Center, <strong>Geesthacht</strong>, Germany at the storage ring DORIS III at the Deutsches Elektronen<br />
Synchrotron (DESY), Hamburg, Germany. This beamline is a high-energy beamline optimized for<br />
diffraction and imaging and equipped with two fixed-exit monochromators: a horizontal one for<br />
diffraction and a vertical one for imaging, which provides a field of view large enough for materials<br />
science applications.<br />
Figure 1 shows a tomogram of the T-joint with the skin material AA2139 T3 before cyclic loading<br />
of the sample to propagate the crack. The region-of-interest technique was performed for this<br />
sample. Some artifacts occur at the edges, where both scans were combined. The artifacts are<br />
partially caused by decrease of beam intensity at the edges of the field of view and partially by the<br />
linear interpolation of the data outside the region of interest. Nevertheless the ROI part of the
sample is very well reconstructed and shows an excellent density resolution (figure 1b). The skin<br />
material and the weld itself can clearly be distinguished although the density difference between the<br />
two used aluminum alloys is below 5 %. The initiated crack runs from the surface directly at the<br />
border between the skin material and the welded region before it enters the skin and goes through<br />
the whole T-joint.<br />
Figure 1: Tomogram of a T-joint after the crack initiation but before cyclic loading to propagate the crack.<br />
The aluminium alloys used in the weld are known for low porosity during laser welding. a) Complete sample<br />
as it was scanned using the region-of-interest technique at 70 keV X-ray energy. The different gray values<br />
represent the different absorptions of the materials. The crack, the aluminium alloy of the skin (bottom part<br />
of the sample) and the welded region can be clearly distinguished. b) Zoom into the region of interest that<br />
was scanned with a better spatial resolution.<br />
This result of the crack visualization demonstrates the high potential of the SRμCT as a nondestructive<br />
imaging method. It allows visualizing even highly absorbing samples with a very high<br />
spatial and density resolution. It has to be emphasized that as the samples are not destroyed neither<br />
during the preparation nor during the tomography scan, further treatments can be performed.<br />
Through additional scans after the treatments the changes in several regions can be easily<br />
displayed.<br />
Based on the first results the study will be continued by analyzing the samples with middle and<br />
high amount of porosity. The crack propagation will be visualized in interaction with the different<br />
types of pores within the welded region and further analysis will be performed on the data. We<br />
believe that the SRμCT as an established imaging technique has a high potential to improve the<br />
understanding of the interaction between damage development and porosity in laser-welded<br />
aluminum alloy T-joints and other materials.<br />
References<br />
[1] F. Beckmann, T. Donath, J. Fischer, T. Dose, T. Lippmann, L. Lottermoser, R.V. Martins, and A.<br />
Schreyer, Proc. SPIE 6316(631210), 1-11 (2006).<br />
[2] J. Herzen, F. Beckmann, S. Riekehr, F. S. Bayraktar, A. Haibel, P. Staron, T. Donath, S. Utcke, M.<br />
Koçak, A. Schreyer: Proc. of SPIE 7078 (2008) 70781V.
Measuring 3D strain tensor fields in multiphased<br />
materials by digital image correlation<br />
H.-A. Crostack, J. Nellesen 1 , G. Fischer 1 , F. Beckmann 2 and J. Herzen 2<br />
Lehrstuhl für Qualitätswesen, Fakultät Maschinenbau, TU Dortmund, 44221 Dortmund, Germany<br />
1 RIF e.V., Joseph-von-Fraunhofer-Str. 20, 44227 Dortmund, Germany<br />
2 GKSS Research Centre, Max-Planck-Str. 1, 21502 <strong>Geesthacht</strong>, Germany<br />
By measuring the 3D strain tensor fields in deformed materials one can gain understanding about<br />
micro deformation and damaging processes. This knowledge helps to predict locus and type of<br />
macroscopical failure and gives the right direction of microstructural design of a composite. In the<br />
past, strain fields were only accessible at the specimen’s surface. For this purpose, SEM images of<br />
a polished surface were taken at different stages of deformation or load respectively. Afterwards<br />
corresponding subimages showing the same microstructural areas in different states were matched<br />
by an iterative procedure in which an affine and a radiometric transform were optimised [1]. As grey<br />
value gradients are exploited during this matching the specimen’s surface was artificially structured<br />
by a grid of gold dots in order to increase the number of sites with a high gradient. Since the<br />
mechanical behaviour at the surface differs from that in the bulk due to the increased number of<br />
degrees of freedom in 3D, the above sketched algorithm for 2D was extended to 3D:<br />
3D microstructure of particle reinforced metal matrix composites is mapped non-destructively by<br />
X-ray tomographic microscopy (XTM) in different deformation states. By digital image correlation<br />
the continuous strain tensor and displacement vector fields are sampled at a discrete grid thereafter:<br />
For a set of corresponding tomogram subvolumes, the affine and radiometric transform between a<br />
less deformed and a more deformed state are iteratively optimized.<br />
z<br />
B 4 C particle<br />
x<br />
F<br />
drilled hole<br />
Al matrix<br />
F<br />
1mm<br />
Figure 1: 2D-image (left) extracted from a 3D tomogram revealing microstructure from the bulk of a drilled<br />
tensile specimen (right) consisting of the Al/B 4 C-composite; hole was drilled by spark cutting in the gauge<br />
length to provoke an inhomogeneous deformation field there.<br />
The Lagrangian strain tensor γ is derived from the final affine transform of each subvolume pair.<br />
The scalar equivalent strain ε equ as well as the principal strains can be gained by relating the tensor<br />
elements to each other. In order to guarantee a sufficient number of sites with a high grey value<br />
gradient for the digital image correlation algorithm the size of the subvolumes has to be adapted
to the characteristic microstructural length which is given by the mean distance between vicinal<br />
microstructural objects. A detailed description of this approach can be found in [2].<br />
The particle-reinforced metal matrix composite Al/B 4 C which was investigated in the scope of the<br />
experiments was produced by plasma spark sintering. In the ductile matrix which consists of highpurity<br />
(99.99% Al) aluminium brittle B 4 C-particles are dispersed with a volume fraction of 5% (=<br />
4.68 % mass fraction). The mean particle diameter amounts to 44.5 μm.<br />
Experiments were performed at beamline BW2. Monochromatic photons of E =22keV were<br />
selected by a double-crystal monochromator in Bragg-reflection arrangement. After each deformation<br />
step the gauge length (cross-sectional area A =2x1 mm 2 ) of the tiny dog-bone shaped<br />
specimen was imaged by XTM in the unloaded state.<br />
In order to provoke an inhomogeneous micro deformation field a hole with a diameter of roughly<br />
500 μm wasdrilled in the gauge length by spark cutting. From the left 2D-image (xz-slice) in<br />
fig. 1 extracted from the 3D-tomogram the microstructure of the composite and the position and<br />
size of the borehole can be gathered. In fig. 2 the distributions of equivalent strain ε equ (left) and<br />
Lagrangian strain γ (right) in one xz-plane beneath the surface after the first deformation are shown.<br />
The distribution of the discretely sampled scalar field of equivalent strain was tesselated in order<br />
to achieve a smooth representation of this quantity. The Lagrangian strain tensors are depicted by<br />
bricks which are oriented and scaled according to the eigenvalues and eigenvectors. Moreover,<br />
these bricks are colour-coded according to the scalar equivalent strain. In view of fig. 2 it can be<br />
concluded that bands of elevated strain originate in the vicinity of the borehole and are tilted against<br />
the direction of global load about approx. 45 ◦ . The effect of microstructure on the initiation and<br />
intensification of these shear bands has not been studied up to now but will be analysed in future<br />
work.<br />
4.2 %<br />
ε equ<br />
0<br />
F<br />
drilled hole<br />
drilled hole<br />
z<br />
x<br />
Figure 2: Distributions of scalar equivalent strain ε equ and Lagrangian strain tensor γ in one xz-plane underneath<br />
the surface taken from the 3D fields; 3D representation of the Lagrangian strain tensors with oriented<br />
bricks; bricks are colour-coded according to the scalar equivalent strain; bands of elevated strain originate in<br />
the vicinity of the borehole and are tilted against the direction of global load about approx. 45 ◦ .<br />
References<br />
[1] H.-A. Crostack, G. Fischer, E. Soppa, S. Schmauder, Y.-L. Liu, J. Microsc. 201 (2), 171<br />
(2001).<br />
[2] H.-A. Crostack, J. Nellesen, G. Fischer, S. Schmauder, U. Weber, F. Beckmann, Proc. SPIE<br />
7078, 70781I-1-12 (2008).
Changes in femoral bones from rats under<br />
osteoporosis preventive treatments<br />
I. Gomez-Morilla 1 , M.D. Ynsa 2 , H. Rahn 1 , S. Odenbach 1 and T. Pinheiro 3<br />
1<br />
Institut für Strömungsmechanik, Technische Universität Dresden, Georg-Bähr-Str. 3, 01069 Dresden,Germany<br />
1<br />
Centro de Microanálisis de Materiales,Universidad Autónoma de Madrid, Cantoblanco, E-28049, Madrid, Spain<br />
1<br />
Laboratório de Feixes de Iões, Instituto Tecnológico e Nuclear, E.N. 10,2685-953 Sacavém, Portugal<br />
Bone is a dynamic tissue which is formed and destroyed continually under the control of hormonal<br />
and physical factors. An imbalance between these processes may result in loss of bone mass<br />
(osteopenia) along with micro-architectural deterioration of the skeleton, leading to bone fragility<br />
and an increased risk of fracture (osteoporosis).<br />
Osteoporosis is a disease that deteriorates the bone due to, among other things, a failure in the<br />
normal hormonal function and it is mainly associated to post-menopausal complications. This<br />
project studies the effects of different therapies based on hormonal supplementation applied to<br />
prevent or treat this disease. Four groups of bones (healthy, osteoporotic without treatment, and<br />
osteoporotic subject to two different treatments) have been analyzed with nuclear microscopy and<br />
the concentration and distribution of certain elements suggest a change in bone density. These<br />
bones are now being analyzed with DiTo at Hasylab [1] in order to image this loss of bone mass,<br />
with the aim of correlating the apparent changes in density to the changes in elemental distribution<br />
and concentration. The final scope is to establish the effects of these hormonal replacement<br />
therapies on bone remodelling in order to better weigh the benefits of steroids supplementation for<br />
osteoporosis treatment.<br />
Female Wistar rats weighing approximately 250 g each have been used in this study, which is being<br />
conducted following the principles for the care and use of laboratory animals according to the<br />
European Union guidelines. The animals were exposed to constant periods of light and darkness<br />
and to a standard diet (Sanders S.A., Madrid, Spain). A total of six animals constituted the control<br />
or basal group (C). The others were ovariectomized, in order to induce osteoporosis, and divided<br />
into three groups 15 days after ovariectomy. The first group of five animals received a placebo (O),<br />
another group of four animals was treated with 17- oestradiol (E) and the other six animals were<br />
treated with micronized progesterone (P). After one month of treatment, all animals were sacrificed<br />
and their femoral bones were excised. For the study, 1 mm thick diagonal cross sections of the<br />
femoral bones were cut using a microtome. The orientation of the cut was chosen in order to obtain<br />
slices comprising the three different femur regions: epiphysis (EPI), femoral neck (NEC) and<br />
diaphysis (DIA). The sections were freeze-dried and examined by optical microscopy in order to<br />
evaluate any possible alterations due to the sample manipulation.<br />
Figure 1: Femoral bone diagonal cross-section where epiphysis, femoral neck and diaphysis are<br />
distinguished. Bone structures are indicated: c, cortical bone; T, trabecular bone; Ch, cartilaginous head.
Nuclear microscopy results showed significant elemental differences between control and<br />
osteoporotic samples basically related with Ca and P levels [2, 3]. The results seem to indicate that<br />
progesterone affects the contents of P, Ca and trace elements in bone after ovariectomy.<br />
Nevertheless, a complete recuperation of bone elemental contents to the levels observed in control<br />
rats could not be reached. Oestrogen supplementation did not improve the ovariectomy status<br />
although an increase in Ca/P ratio was observed in cortical and trabecular bone and especially in<br />
the EPI and NEC femoral regions. The associated variability of trace elements according to bone<br />
type and region together with the variations observed in P and Ca following hormonal<br />
supplementation suggest a recovery from bone loss, possibly a delay in bone resorption and/or an<br />
acceleration of new bone formation.<br />
With X-ray tomography, the volume percentages of cortical and trabecular bone in each of the three<br />
femoral areas (DIA, NEC and EPI) in the four types of samples analyzed can be obtained. A clear<br />
difference can be observed between healthy and osteoporotic samples, particularly in the trabecular<br />
bone. Both treatments show and improvement in comparison to the non-treated osteoporotic bone,<br />
although the healthy volume percentages are not always reached by either of the treatments, what is<br />
more evident in the DIA region.<br />
The tomography analyses performed so far have yielded qualitative results which agree with the<br />
conclusions achieved from the nuclear microscopy study. In particular, the deterioration of the bone<br />
after ovariectomy is evident. The estimation of the volume percentages of the trabecular and<br />
cortical bone show this deterioration of the osteoporotic bone, as well as the recuperation of the<br />
osteoporotic bone after treatment, although without reaching the healthy state. The higher<br />
proportion of trabecular bone in osteoporotic samples with oestrogen supplementation in<br />
comparison to the one with progesterone supplementation may be linked to the higher Ca to P<br />
ration observed in the first one with nuclear microscopy.<br />
Figure 2: Rendered images of the reconstructed data from the diaphysis region of an (a) osteoporotic bone<br />
without treatment and (b) osteoporotic bone treated with progesterone.<br />
Acknowledgements<br />
The authors thank gratefully Dr. Felix Beckmann and Julia Herzen for their help and support during and<br />
after beam time.<br />
References<br />
[1] B. Hasse, H. Rahn, S. Odenbach, F. Beckmann, and W. Reimers, Materials Science Forum 571-572,<br />
201-206 (2008).<br />
[2] M.D. Ynsa, F.J. Ager, L.C. Alves, M.A. Zubeldia, J.C. Millan, and T. Pinheiro, Journal of<br />
Microscopy 224, 298-305 (2006).<br />
[3] M.D. Ynsa, T. Pinheiro, F.J. Ager, L.C. Alves, J.C. Millan, M.A. Gomez-Zubelbia, and M.A.<br />
Respaldiza, Nucl. Instr. Meth. B 189, 431-436 (2002).
Fibre textures in hot extruded NiMnGa alloys<br />
R. Chulist 1 , A. Böhm 2 , C.-G. Oertel 1 , W. Skrotzki 1 and T. Lippmann 3<br />
1 Institut für Strukturphysik, Technische Universität Dresden, D-01062 Dresden,<br />
Germany<br />
2<br />
Fraunhofer-Institut für Werkzeugmaschinen und Umformtechnik, D-01187 Dresden,<br />
Germany<br />
3 Institut für Werkstoffforschung, GKSS Forschungszentrum, D-21502 <strong>Geesthacht</strong>,<br />
Germany<br />
Magnetically actuated shape memory alloys such as NiMnGa have recently attracted<br />
special attention due to large strains achieved by the reorientation of martensitic twin<br />
variants. The movement of twin boundaries under a magnetic field resulting from the<br />
high magnetocrystalline anisotropy leads to a magnetic field induced strain (MFIS) 1,2 .<br />
During cooling from high temperatures NiMnGa alloys experience different phase<br />
transitions, from B2 (cubic) via L2 1 (cubic, austenite) to martensitic structures.<br />
Depending on the chemical composition and heat treatment at least three martensitic<br />
structures can be distinguished in the NiMnGa system (7M modulated, orthorhombic,<br />
space group Fmmm; 5M modulated and non-modulated, both tetragonal, space<br />
group I4mmm) 3-5 . However, MFIS only exists in the 5M and 7M modulated structures.<br />
Until now, MFIS has been mainly reported for NiMnGa single crystals. Since for<br />
large-scale production, growth of single crystals is economically unfavourable, it is<br />
necessary to investigate polycrystalline samples on their suitability for MFIS.<br />
Therefore, to also obtain this effect in polycrystals, fabrication processes to produce<br />
strong textures are needed. One practical way to achieve a preferred crystallographic<br />
orientation in polycrystalline aggregates is hot extrusion.<br />
A polycrystalline ingot of composition Ni 50 Mn 29 Ga 21 (5M) was produced by casting<br />
into an iron mould. To decrease friction during extrusion, the cylindrical ingot (100<br />
mm length, 50 mm diameter) was canned in steel. Extrusion was done at 1000°C<br />
with an extrusion ratio of 4/1. Three cylindrical samples with height and diameter of<br />
10 mm were cut from the extruded rod at the front, middle and end.<br />
The textures were measured by diffraction of high-energy synchrotron radiation (100<br />
keV) using the GKSS materials science beam line HARWI-II at DESY in Hamburg,<br />
Germany. Due to the high penetration depth of synchrotron radiation, texture<br />
measurements in transmission allow to collect orientation data from a relatively large<br />
sample volume, i.e. with a good grain statistics. The orientation distribution function<br />
(ODF) was calculated from the measured pole figures ({400}, {224}) using LABOTEX<br />
software. The ODF was used to calculate the inverse pole figures of the extrusion<br />
direction.<br />
During extrusion the material mainly experiences axisymmetric tension. This<br />
deformation mode applied to NiMnGa alloys in the B2 phase field produces a<br />
/ double fibre texture (Fig. 1). It is typical for hot extruded B2<br />
intermetallics 6,7 having experienced continuous dynamic recrystallization. During<br />
cooling the NiMnGa alloy transforms to the L2 1 cubic structure and finally to the 5M<br />
tetragonal structure. The latter transformation is such that the tetragonal (001) plane<br />
and [110] direction are parallel to the cubic (001) plane and [100] direction,
espectively. Thus, three orientation variants of the tetragonal unit cell are possible.<br />
Figure 1 shows that a variant selection takes place with [110] preferentially aligned<br />
along the extrusion axis. The reason may be stresses developed during cooling. The<br />
textures of the front and end samples are comparable to that of the middle sample,<br />
however, their variant fractions are different.<br />
Fig. 1: Inverse pole figure of the extrusion direction of the tetragonal 5M structure measured<br />
in the middle region of the extruded rod (intensities are given in multiples of a random<br />
distribution, mrd).<br />
References<br />
[1] P. Müllner, V.A. Chernenko, M. Wollgarten and G. Kostorz, Appl. Phys. Lett. 92 (2002)<br />
6708<br />
[2] P. Müllner, V.A. Chernenko and G. Kostorz, J. Magn. Magn. Mater. 267 (2003) 325<br />
[3] V.A. Chernenko, Scripta Mater. 40 (1999) 523<br />
[4] K. Ullakko, J.K. Huang, C. Kantner, V.V. Kokorin and R.C. O'Handley, Appl. Phys.<br />
Lett. 69 (1996) 523<br />
[5] V.V. Martynov, J. de Physique IV 5 (1995) 5<br />
[6] W. Skrotzki, R. Tamm and C.-G. Oertel, Mater. Sci. Forum, 426 (2003) 3598<br />
[7] W. Skrotzki, R. Tamm, K. Kegler and C.-G. Oertel, Springer, (2009) in press.
High-energy synchrotron radiation charge density study of spinels<br />
J. Warczewski 1 , J. Fijak 1 , G.Urban 1 , M. Zubko 1 , T. Lippmann 2<br />
1 University of Silesia, Institute of Physics, Department of Physics of Crystals,<br />
Uniwersytecka 4, 40-007 Katowice, Poland<br />
2 GKSS Research Center, Max-Planck-Str.1, D-21502 <strong>Geesthacht</strong><br />
High symmetry crystals - spinels have the cubic structure (space group Fd-3m).<br />
We used the high-energy synchrotron radiation approximately 100 keV, because then it is<br />
possible to reduce both absorption and extinction [1].<br />
Spinel compounds with the general formula ACr 2 X 4 (where A = Cd, Zn, Hg, Ga, Cu;<br />
X = S, Se, Te, O) have been analysed due to their interesting electric, thermal and<br />
magnetic properties, e.g. the large Seebeck effect and colossal magnetoresistance [2– 5].<br />
The spinels are perfect materials for many current technological applications such as<br />
the magnetic sensors used as the read-write heads in the computer hard disks or as<br />
the temperature sensors. For example the discovery of the colossal magnetoresistance<br />
(> 90 %) in doped ZnCr 2 Se 4 systems [6] is of major interest for technology. The<br />
experimental and theoretical electron density has become an attractive tool to investigate<br />
the bonding and the electronic structure of many compounds [7, 8].<br />
The<br />
advantages of applying synchrotron radiation are especially pronounced when the heavier<br />
atoms are present in the compounds under study (for example Cd, In, Hg, Ga).<br />
The measurements reported here will allow us to apply Hansen & Coppens<br />
aspherical pseudoatom formalism and Hirshfeld method with the goal to create maps of<br />
the electron density, even in the case of investiagting such heavy elements as In and Ga,<br />
which are present in many spinels. The application of these methods for the precise<br />
refinement of the deformation functions of the electron density of the heavy elements is<br />
not really feasible using the conventional X-ray sources. Probably, this is the reason for<br />
the fact that very accurate maps of the electron density in the magnetic spinel crystals are<br />
not available so far. The Hansen & Coppens approach presents a research method for the<br />
understanding the structure in more detail as well as the influence of the electronic effects<br />
and, therefore, it is of great value for physics.<br />
The experiment was performed on the materials science diffractometer at the<br />
GKSS materials science beamline HARWI-II at DESY, Hamburg, Germany. The following<br />
samples of single crystals have been investigated: Cd 0.9 Eu 0.1 Cr 2 Se 4 , Zn 0.5 Cd 0.5 Cr 2 Se 4 ,<br />
CdCr 2 Se 4 , Cd 0.5 Ga 0.5 Cr 2 Se 4 , Zn 0.6 Cd 0.4 Cr 2 Se 4 , Cd x In 1-x Cr 2 Se 4 , Cd x Ga 1-x Cr 2 Se 4 (two<br />
pieces). We used the MAR555 image plate camera. This new MAR555 detector has been<br />
tested at the GKSS materials science beamline HARWI-II recently [9]. The MAR555<br />
detector is characterized by its short read-out time (less than one second per image).<br />
Thus we were able to measure 8 samples within our beamtime. We performed the data<br />
collection for our crystals at room temperature and collected 180 frames and additionally<br />
180 frames using a Fe absorber in the beam in order to account for the strong reflections.
Data reduction using AUTOMAR [10] are currently under progress. Then initial<br />
structure refinements with SHELXL [11] will be made as well as the conventional<br />
refinement with the assumption of spherical atomic scattering factors and the deformation<br />
refinement in which the experimental electron distribution will be fitted to the multipole<br />
deformation functions will be made in XD program [12]<br />
References<br />
[1] T. Lippmann, J.R. Schneider, J. Appl. Cryst. 33 (2000), 156 – 167.<br />
[2] J. Krok-Kowalski, J. Warczewski, K.Krajewski, H. Duda, P. Gusin, T. liwiska,<br />
A. Pacyna, T. Mydlarz, S. Matyjasik, E. Malicka, A.Kita, Journal of Alloys and<br />
Compounds 430 (2007) 47-53<br />
[3] J. Krok-Kowalski, J. Warczewski, H. Duda, P. Gusin, K. Krajewski, T. liwiska,<br />
A. Pacyna, T. Mydlarz, E. Malicka, A.Kita, Journal of Alloys and Compounds 430<br />
(2007) 39-42<br />
[4] J. Warczewski, J. Krok-Kowalski, L. I. Koroleva, P. Gusin, T. liwiska, T. Mydlarz,<br />
S. Matyjasik, R. V. Demin, A. I. Abramovich, Journal of Alloys and Compounds 430<br />
(2007) 43-46<br />
[5] J. Warczewski, J. Krok-Kowalski, P. Gusin, P. Zajdel, Journal of Physics and<br />
Chemistry of Solids 66 (2005) 2044-2048<br />
[6] D. R. Parker, M. A. Green, S. T. Bramwell, A. S. Wills, J. S. Gardner, D. A.<br />
Neumann, J. Am. Chem.Soc. 126 (2004) 2710<br />
[7] P. Coppens, X-ray Charge Densities and Chemical Bonding, Oxforfd University<br />
Press, 1997<br />
[8] T. S. Koritsanszky, P. Coppens, Chem. Rev. 101 (2001) 1583<br />
[9] T. Lippmann, HASYLAB Annual Report 2007<br />
[10] K. Bartels and C. Klein, AUTOMAR users guide, 2003<br />
[11] G. M. Sheldrick, SHELXL-97 – A program for crystal structure refinement<br />
[12] T. S. Koritsanszky, T. Howard, S. Richter, T. Su, Z. Mallinson, P. R. & Hansen, N.<br />
K. (1995) XD Computer Program Package for Multipole Refinement and Analysis of<br />
Electron Densities from X-ray Diffraction Data
In-situ X-ray diffraction study of the transformation of<br />
reverted austenite in the maraging steel PH 13-8 Mo<br />
G.A. Zickler 1 , R. Schnitzer 1 , R. Hochfellner 1 , T. Lippmann 2 , S. Zinner 3 , and H. Leitner 1<br />
1<br />
Christian Doppler Laboratory for Early Stages of Precipitation, Dept. Physical Metallurgy & Materials Testing,<br />
Montanuniversität Leoben, Franz-Josef-Str. 18, A-8700 Leoben, Austria<br />
2<br />
GKSS Research Centre <strong>Geesthacht</strong>, Max-Planck-Str. 1, D-21502 <strong>Geesthacht</strong>, Germany<br />
3<br />
Böhler Edelstahl GmbH & Co KG, Mariazeller Str. 25, A-8605 Kapfenberg, Austria<br />
The deformation-induced phase transformation of metastable austenite in steels is of great scientific<br />
and technological interest. This so-called effect of transformation-induced plasticity (TRIP effect)<br />
shows additional work-hardening and enhanced ductility arising from martensitic shear and plastic<br />
deformation processes around martensitic plates [1,2].<br />
Maraging steels (martensitic precipitation hardening steels) belong to the group of high strength<br />
steels possessing superior mechanical properties. Maraging steels have a martensitic matrix, which<br />
is strengthened by nanometre-sized intermetallic precipitates and tend to form reverted austenite<br />
with increasing time of aging [2]. As far as ascertained not much is reported about the TRIP effect<br />
in maraging steels. The goal of the present study is a systematic investigation of the martensitic<br />
phase transformation behaviour of austenite in a maraging steel of the type PH 13-8 Mo under<br />
external loading.<br />
The material used for the present study was a commercial maraging steel, which was provided by<br />
Böhler Edelstahl GmbH & Co KG, Kapfenberg, Austria. The nominal chemical composition is<br />
given by: base Fe, 0.03 wt.% C, 12.70 wt.% Cr, 2.20 wt.% Mo, 8.10 wt.% Ni, and 1.10 wt.% Al.<br />
The material was solution annealed at a temperature of 1173 K for 1.5 h and then air-cooled to<br />
room temperature. Subsequently the specimens were isothermally aged at 848 K for 3, 5, 10, 15,<br />
and 100 h, respectively. The differently heat-treated samples were machined to tensile testi<br />
specimens with a diameter of 4 mm and a gauge length of 20 mm.<br />
(a)<br />
stress [MPa]<br />
1400 3 h 5 h<br />
1200<br />
1000<br />
800<br />
600<br />
solution<br />
400<br />
treated<br />
200<br />
0<br />
10 h<br />
15 h<br />
(b)<br />
100 h<br />
0.00 0.05 0.10 0.15 0.20<br />
engineering strain <br />
Figure 1: (a) Schematic sketch of the experimental setup for in-situ tensile testing. (b) The<br />
engineering stress-strain curves of the maraging steel PH 13-8 Mo in the solution treated state and<br />
aged at 848 K for different times (see figure).<br />
The high-energy X-ray diffraction studies of the phase transformations were performed at the<br />
GKSS Engineering Materials Science Beamline HARWI-II [3] at HASYLAB/DESY. The<br />
synchrotron radiation was monochromatised to a nominal photon energy of 100 keV and the cross<br />
section of the beam was defined by aperture slits to 0.5 × 0.5 mm 2 at the sample position. Figure 1a<br />
shows a schematic sketch of the experimental setup. For in-situ studying the phase transformation,<br />
a tensile testing machine was mounted on the sample tower of the diffractometer at the<br />
experimental station of the synchrotron beamline [3]. The X-ray diffraction experiments were<br />
performed in transmission geometry. The in-situ tensile tests were performed at ambient conditions
up to the fracture of the specimens. A two-dimensional image plate detector (mar345) was<br />
positioned at a sample-to-detector distance of 950 mm to detect the scattered photons.<br />
Figure 1b illustrates the engineering stress-strain plots, showing the significant influence of the<br />
aging treatment on the mechanical properties. The diffraction pattern of the solution treated<br />
maraging steel contains only diffraction peaks from the martensitic ' phase. However, all aged<br />
samples show Debye-Scherrer rings from the martensitic ' phase and the austenitic phase. Figure<br />
2a displays a series of azimuthally averaged X-ray diffraction patterns in various states of the insitu<br />
tensile testing experiment. The intensities of the phase diffraction peaks strongly decrease<br />
with increasing strain , whereas the diffraction peaks of the ' remain mostly unaffected. With<br />
increasing , the width of the diffraction peaks of both phases increase and slight shifting of the<br />
peak positions is observed. These results are qualitatively found in all aged samples.<br />
The volume fractions of austenite V was calculated by the method of direct comparing of the<br />
integrated intensities of the individual diffraction peaks [4]. Figure 2b shows the results of V as a<br />
function of engineering strain. In the unloaded state, V strongly increases from 7 vol.% at 3 h to 30<br />
vol.% at 100 h. It can be clearly seen that V continuously decreases with increasing strain. The<br />
transformation takes place in the elastic as well as in the plastic region, whereas the decrease in the<br />
plastic regime is much more pronounced. It seems that not all curves reach the zero line, which is,<br />
however, due to the inability of determining the V at the onset of fracture. The retaining austenite<br />
is transformed between the strain value of the last measurement and the elongation of fracture.<br />
Longitudinal scanning of the fractured samples verified this finding. These results indicate that the<br />
TRIP effect can be used for controlling the mechanical properties of maraging steels. For further<br />
details of experimental procedures, methods of data evaluation, and interpretation and discussion of<br />
the results see reference [5].<br />
intensity [arb. units]<br />
10 4<br />
10 3<br />
10 2<br />
(a)<br />
10 6<br />
10 5<br />
= 0.16<br />
= 0.11<br />
= 0<br />
3 4 5 6 7 8 9 10<br />
scattering angle 2 [°]<br />
austenite volume fraction V<br />
0.30<br />
0.25<br />
0.20<br />
0.15<br />
0.10<br />
0.05<br />
0.00<br />
(b)<br />
3 h<br />
5 h<br />
10 h<br />
15 h<br />
100 h<br />
0.00 0.05 0.10 0.15 0.20<br />
engineering strain <br />
Figure 2: (a) A typical series of X-ray diffraction patterns during in-situ tensile testing of the<br />
maraging steel PH 13-8 Mo aged at 848 K for 15 h. The values given in the figure refer to the<br />
applied engineering strain . (b) The volume fraction of austenite V for various aging treatments at<br />
848 K (see figure legend) as a function of engineering strain.<br />
References<br />
[1] R.F. Decker, S. Floreen, in: R.K. Wilson (Ed.), Maraging Steels: Recent Developments and Applications,<br />
The Minerals, Metals & Materials Society, Warrendale (PA) (1988) 1.<br />
[2] W. Sha, A. Cerezo, G.D.W. Smith, Metall. Trans. A 24 (1993) 1221.<br />
[3] T. Lippmann, L. Lottermoser, F. Beckmann, R.V. Martins, T. Dose, R. Kirchhof, A. Schreyer, in: W.<br />
Caliebe, W. Drube, K. Rickers, J.R. Schneider (Eds.) HASYLAB Annual Report, HASYLAB/DESY,<br />
Hamburg (2007) 113.<br />
[4] M.J. Dickson, J. Appl. Cryst. 2 (1969) 176.<br />
[5] G.A. Zickler, R. Schnitzer, R. Hochfellner, T. Lippmann, S. Zinner, H. Leitner, Int. J. Mater. Res.<br />
(formerly Z. Metallkd.) (2008) submitted.
New sample changer at HARWI-II for<br />
texture and phase analysis<br />
H.-G. Brokmeier 1, 2 , W.M. Gan 1,2 , C. Randau 1 , E. Maawad 1 ,B.Schwebke 1, 2 , T. Lippmann 2<br />
1<br />
Institute for Materials Science and Engineering, TU-Clausthal, D38678 Clausthal, Germany.<br />
2<br />
GKSS-Forschungszentrum, Max-Planck strasse 1, D21502 <strong>Geesthacht</strong>, Germany.<br />
Quantitative phase and texture analysis using high energy synchrotron diffraction take many<br />
advantages over conventional x-ray diffraction [1]. One of these advantages is a short exposure time.<br />
An effective use of the beam time requires a high efficient sample holder system and precise<br />
adjustment equipment together with an automatisation. A multi-functional sampler holder was tested<br />
for continuous measurements of phase and texture of a set of samples.<br />
As shown in Fig. 1, an integrated sample holder with five motors each has a rotation from 0° to 360°<br />
separately. The beamline Harwi-II offers many freedoms in x, y and z movement. In combination with<br />
our sample changer up to five different but complex samples can be positioned in the beam. As an<br />
example Fig.1 shows four powder samples in glass tubes and the Al 2 O 3 NIST-standard plate in the<br />
middle position. Calibration of the instrument using the standard (wavelength, sample to detector<br />
distance, detector adjustment) is possible directly in combination with powder measurements. The<br />
wavelength was determined to 0.01523 nm (81,47 keV) with a sample to detector distance of 1000 mm.<br />
One example for a zinc powder is shown in Fig.1 with a Mar345 image plate picture, exposure time 10<br />
sec., and its sum diffraction pattern fitted by Maud [2], respectively.<br />
Fig. 1 The newly developed sample holder system in which are 5 different powder samples (left); an<br />
image diffraction patter of Zn powder (middle) and its sum diffraction pattern (right).<br />
Among other applications, quantitative phase analysis (QPA) is necessary when correlating<br />
microstructure with the properties. An annealed LCB-Ti alloy was firstly solid solution heat treated at<br />
750 °C for 1 hour followed by water quenching; and then aged at 540 °C for 8 hours. QPA of a solid<br />
quadratic sample (5 × 20 × 20 mm 3 ) is shown in Fig. 2. Two phases, - and -Ti, are detected. Volume<br />
fractions of 22% for -Ti and 78% for -Ti were obtained after fitting with Maud [2],
Fig. 2 Sum diffraction pattern fitted by Maud program of annealed a LCB-Ti alloy.<br />
A second example of QTA is given for accumulative roll bonded (ARB) Mg-Al at 350 °C after 3 cycles.<br />
Temperature treatment as well as the ARB process can influence the phase composition including<br />
formation of intermetallic compounds. In order to minimize the influence of strong texture, the<br />
specimen with a dimension of 1 ×2 × 10 mm was measured by a 1×1 mm beam and 360°C continuous<br />
rotation during exposure. The result of the fitted sum diffraction pattern is shown in Fig. 3.<br />
Fig. 3 Sum diffraction pattern fitted by Maud of 3 cycles ARB processed Mg-Al (38 % Mg -62 % Al).<br />
In summery, the current developed sample changer is qualified for phase, texture and strain analysis of<br />
various materials, especially for beam time saving and continuous measurement.<br />
References:<br />
[1] S. B. Yi, H.-G. Brokmeier, R.E. Bolmaro, K.U. Kainer, T. Lippmann. Scripta Mater., 2004 (51), p.<br />
455-460.<br />
[2] L. Lutterotti, S. Gialanella. Acta Mater., 1998 (46), p. 101-110.
Influence of sample shape on the pole figure quality<br />
H.-G. Brokmeier 1, 2 , C. Randau 1 , W.M. Gan, 1,2 , B.Schwebke 1, 2 , T. Lippmann 2<br />
1<br />
Institute for Materials Science and Engineering, TU-Clausthal, D38678 Clausthal, Germany.<br />
2<br />
GKSS-Forschungszentrum, Max-Planck Strasse 1, D21502 <strong>Geesthacht</strong>, Germany.<br />
High energy synchrotron diffraction and thermal neutrons are attractive due to the high penetration<br />
power [1]. Particular for texture gradients in compact samples a kind of local measurements favours<br />
high intense synchrotron radiation. In these cases absorption and extinction plays an important role on<br />
the quality of quantitative texture results [2]. Mass absorption coefficient, scattering behaviour and<br />
photon beam path in the sample have to be taken into account. The present investigation deals with the<br />
influence of the sample shape of rolled Al-samples on the pole figure quality. The test sample an<br />
Al7020 alloys has a well developed strong rolling texture. The as-rolled Al7020 sheet was machined<br />
into four specimens with different shape of Ø 11 mm round, 11×11 mm 2 quadratic, 11 × 22 mm 2 and<br />
11 × 33 mm 2 rectangular, as shown in Fig. 1, these four specimens were clipped in the new sample<br />
changer at HARWI-II. The texture measurements were carried out in steps of 5° in rotation from -90°<br />
to 90° for complete pole figures using the MAR345 detector at a wavelength of 0.01523 nm.<br />
Fig. 1: Set of investigated Al7020 samples mounted on the new sample changer at Harwi-II<br />
One sample takes about 90min with a high counting statistics, so that the whole set of samples was<br />
measured in about 6h. A typical area detector image and its sum diffraction pattern are shown in Fig. 2,<br />
respectively. Integral intensities were calculated using the software package STRESS-TEX-Calculator<br />
to obtain data of three pole figures (111), (200) and (220). For comparison, (111) and (200) pole figures<br />
were plotted only with background correction, see Fig. 3. Al, as light materials, is known for its low<br />
absorption compared to steel, tungsten or lead. The influence of the shape is seen by the decreasing<br />
texture sharpness from ideal round sample (26.3 mrd) to rectangular samples (23.0 mrd). It has to<br />
noticed, that two effects working opposed. For rectangular sample different -positions lead to
variation of the gage volume. On one hand an increasing gage volume gives higher intensities and on<br />
the other hand an increasing beam path in the sample results in higher absorption which reduces the<br />
scattered intensity. Consequently, corrections for absorption and constant volume are necessary.<br />
600<br />
(111)<br />
500<br />
(200)<br />
Intensity<br />
400<br />
300<br />
200<br />
(220)<br />
100<br />
0<br />
2.5 3.0 3.5 4.0 4.5 5.0 5.5 6.0 6.5<br />
2 theta, degree<br />
Fig. 2: Mar345 image of rolled Al7020 (left) and its sum diffraction pattern (right).<br />
Ø 11 mm<br />
11x 11 mm 2<br />
11x 22 mm 2<br />
11x 33 mm 2<br />
P max =26.5 mrd P max =25.5 mrd P max =24.1 mrd P max =23.0 mrd<br />
(111)<br />
P max =8.7 mrd<br />
P max =8.7 mrd<br />
P max =8.4 mrd<br />
P max =7.6 mrd<br />
(200)<br />
Fig. 3: (111) and (200) pole figures of Al7020 with different sample shape<br />
(RD is to the top, contour levels= 1.0, 3.0, 5.0, . . .).<br />
References:<br />
[1] H.-G. Brokmeier, Physica B: Condensed Matter, Vols.385-386 (2006) pp. 623-625.<br />
[2] A. Mücklich, P. Klimanek, Materials Science Forum, Vols.79-82 (1991) pp. 185-190<br />
[3] H.-G. Brokmeier, D. Ostwaldt: Proceedings of ICOTOM 11, Intern. Acad. Publishers Beijing, 1996,<br />
pp. 75-80.
Textures at the outer corner angle in 50%- ECAPed pure Mg<br />
W.M. Gan 1,2 , H.-G. Brokmeier 1, 2 , B.Schwebke 1, 2 , H. Chang 3 , M.Y. Zheng 3 , K. Wu 3<br />
1<br />
GKSS-Forschungszentrum, Max-Planckstrasse 1, D21502 <strong>Geesthacht</strong>, Germany.<br />
2<br />
Institute for Materials Science and Engineering, TU-Clausthal, D38678 Clausthal, Germany.<br />
3<br />
School of Materials Science and Engineering, Harbin Institute of Technology, 150001 Harbin, P. R. China.<br />
Equal channel angular pressing (ECAP) has been proved to be a promising sever plastic deformation<br />
technique which can effectively produce ultra-fined or nano-grained various bulk materials [1].<br />
Microstructural homogeneity of the ECAPed materials is more attractive when considering the<br />
practical applications of this technique. Texture evolution in 50 %-ECAPed pure Mg has been done<br />
under former proposal whose results can be found from the HASYLAB report 2007 [2]. In brief, the<br />
research results indicated a gradient texture evolution from the input to deformation and output regions.<br />
A combination of shear and rotation texture components described the texture evolution. However,<br />
textures at the outer curvature angle region have not still been fully investigated since this angle value<br />
greatly affects the effective imposed strain [1, 3]. Purpose of the present continued research on the<br />
textures at outer curvature angle region in 50 %-ECAPed pure Mg is to investigate the deformation<br />
mode in this region.<br />
In current research, preparation of the ECAPed pure Mg has been in detailed described in former report<br />
[2]. Samples for measurement were cut from the 50 %-ECAPed pure Mg, as shown in Fig. 1, the billet<br />
had a outer curvature angle = 36° which covered region AOB. Hard x-rays at HARWI-II-W2 were<br />
used because of its high local resolution. Three positions were measured along a total length of 5 mm<br />
in OB direction. The texture measurements were carried out in steps of 5° in rotation from -90° to<br />
90° for complete pole figure without any sample symmetry using the MAR345 detector. Integral<br />
intensities were calculated to obtain a set of five pole figures (10.0), (00.2), (10.1), (10.2) and (11.0).<br />
The (00.2) and (10.0) pole figures of three positions which marked by a shaded rectangle are shown in<br />
Fig. 1, respectively. A mixture component in position 1 is developed, one strong on is the (10.0) fiber<br />
with its fiber axis near parallel to the ED; and other weak (00.2) girdle can also be observed. In position<br />
2 one strong orientation in (00.2) with its axis 40 º to the ED and a weak orientation of about 10 º to the<br />
ND are observed. Surprisingly a girdle in (10.0) is missing which indicates a different deformation<br />
mode at this middle position. Texture in position 3 shows a more ideal orientation of the grains related<br />
to the shear direction. Three components are available in (00.2): a strong point maximum 45 º to close<br />
to the ED; a weak point maximum close to the TD; and a weak girdle at 45 º with a fiber axis in (10.0).<br />
Surprise is also the missing girdle in the (10.0) pole figure.<br />
It has been widely reported that a theoretical 45º to the extrusion direction shear is exerted on the<br />
specimen. Current texture result indicates that this ECAP processing is more complicated than a 45 º<br />
shear. It can be found that the gradient texture evolution indicates that the maximum effective shear<br />
occurs at the bottom region. Including the outer curvature angle, the friction condition and material’s<br />
property should all be responsible for the complex deformation mode during ECAP. Due to the<br />
limitation of page in current report, a submitted paper of the former and current research results has<br />
given a detailed explanation.
(00.2)<br />
ND<br />
P max = 5.8 mrd<br />
(10.0)<br />
P max = 2.2 mrd<br />
1<br />
ED<br />
ND<br />
P max = 5.1 mrd<br />
P max = 3.8 mrd<br />
<br />
2<br />
A<br />
<br />
O<br />
1<br />
2<br />
3<br />
B<br />
ED<br />
P max = 5.4 mrd<br />
P max = 3.4 mrd<br />
3<br />
Fig. 1 Schematic illustration of the 50 %-ECAPed billet in which the outer curvature angle region AOB<br />
was investigated in current research (left); the (00.2) and (10.0) pole figures of the region from top AO<br />
to the bottom (contour levers=1.0 ×, 1.5 ×, …).<br />
References<br />
[1] R.Z. Valiev, T.G. Langdon, Prog. in Mater. Sci. , 2006 (51), p. 881-981.<br />
[2] W. M. Gan, H.-G. Brokmeier, B. Schwebke, H. Chang, M.Y. Zheng, K. Wu. HASYLAB Annual<br />
Report 2007, Part I, p. 859-860.<br />
[3] S.C. Yoon, P. Quang, S.I. Hong, H.S. Kim. J. Mater. Pro. Techn., 2007 (187-188), p. 46-50.
Current Status of the HEMS Beamline at PETRA III<br />
N. Schell, A. King, A. Haibel, F. Beckmann, H.-U. Ruhnau, R. Kiehn, R. Kirchhof, M. Müller, and<br />
A. Schreyer<br />
GKSS-Research Centre <strong>Geesthacht</strong> GmbH, Max-Planck-Str. 1, 21502 <strong>Geesthacht</strong>, Germany<br />
The future High Energy Materials Science Beamline HEMS at PETRA III [1] will be fully tunable<br />
in the range of 50 to 300 keV, and will be optimized for sub-micrometer focusing with Compound<br />
Refractive Lenses (CRLs) and Kirkpatrick-Baez (KB) Multilayer mirrors. Design, construction,<br />
operation and main funding is the responsibility of the Research Center <strong>Geesthacht</strong>, GKSS.<br />
Approximately 70 % of the beamtime will be dedicated to Materials Research, the rest reserved for<br />
“general physics” experiments supported by DESY.<br />
Fundamental research will encompass metallurgy, physics, chemistry and biology. For first<br />
experiments in investigating grain-grain-interactions a dedicated 3D-microstructure-mapper has<br />
been designed. Applied research for manufacturing process optimization will benefit from the high<br />
flux in combination with ultra-fast detector systems allowing complex and highly dynamic in-situ<br />
studies of microstructural transformations. The beamline infrastructure will allow easy<br />
accommodation of large user provided equipment. Experiments targeting the industrial user<br />
community will be based on well established techniques with standardised evaluation, allowing<br />
"full service" measurements. Environments for strain mapping on large structural components up to<br />
1 t can be provided as well as automated investigations of large numbers of samples, e.g. for tomography<br />
and texture determination.<br />
The design of HEMS – beamline P07 in sector 5 of the PETRA hall, building 47c – has been<br />
finalized after two GKSS / DESY Workshops and conference contributions in order to introduce<br />
the concept to a larger user community [2]. It consists of a nearly five meter in-vacuum undulator<br />
source (U19-5) optimized for high energies, a general optics hutch, an in-house test facility and<br />
three independent experimental hutches working alternately, plus additional set-up and storage<br />
space for long-term experiments. The lead shielded experimental hutches and the corresponding<br />
control cabins have been built (Fig. 1) and a topping out ceremony has been held December 1 st with<br />
the management of GKSS and DESY present. Major experiments are clearly defined and the<br />
essential instruments designed and ordered or manufactured in-house. An improved HUBER<br />
surface diffractometer with premonochromator for the investigation of liquids as designed by<br />
H. Reichert [3] is ready for shipment (Fig. 2) at the company site [4], a costumized 1 t hexapod<br />
from Physik Instrumente Karlsruhe [5] has been tested and delivered to the DESY site (Fig. 3).<br />
Currently tubing and cabling work is in progress, evaluation rooms and laboratories are equipped,<br />
the staff hired. HEMS should be operational in summer 2009 as one of the first beamlines running<br />
at PETRA III.<br />
References<br />
[1] http://petra3.desy.de/beamlines/work_packages/e1036/e1557/index_eng.html<br />
[2] N. Schell, R.V. Martins, F. Beckmann, H.-U. Ruhanu, R. Kiehn, A. Schreyer, accepted for<br />
publication in Materials Science Forum (Conference proceedings of the 4 th Conference on Stress<br />
Evaluation, MECA SENS IV, in Vienna, Austria, 24-26 September, 2007)<br />
[3] H. Reichert, V. Honkimäki, A. Snigirev, S. Engemann, H. Dosch, Physica B 336, 46 (2003)<br />
[4] Information on http://www.xhuber.com/<br />
[5] Information on http://www.physikinstrumente.com/
Figure 1: Experimental hutches and control cabins of the HEMS beamline at PETRA III.<br />
Figure 2: Surface and interface diffractometer from HUBER for the HEMS beamline.<br />
Figure 3: Prototype 1 t heavy load hexapod for HEMS in the manufacturer’s metrology laboratory.
Status of the Imaging Beamline at PETRA III<br />
A. Haibel, F. Beckmann, T. Dose, S. Utcke, J. Herzen, D. Siemers, R. Kiehn, M. Müller,<br />
and A. Schreyer<br />
GKSS-Research Centre <strong>Geesthacht</strong> GmbH, Max-Planck-Str. 1, 21502 <strong>Geesthacht</strong>, Germany<br />
As part of the PETRA III project the GKSS Research Centre <strong>Geesthacht</strong> is responsible for<br />
construction, operation and funding of the Imaging Beamline IBL. The design of the beamline is<br />
pinpointed to the needs of micro and nano tomography experiments [1,2]. One optics hutch and<br />
two separate experimental hutches are currently under construction (see Fig. 1).<br />
Figure 1: Layout of the Imaging Beamline at PETRA III.<br />
To types of monochromators will be installed in the optics hutch. A silicon single crystal<br />
monochromator, designed by DESY will be used for tomographic methods, which need a very<br />
high monochromatization (e.g. vector tomography, absorption edge tomography, diffraction<br />
tomography). For high flux applications (e.g. for fast measurements like in situ experiments) a<br />
double multilayer monochromator will be designed this year. The multilayer structures are made<br />
in cooperation with M. Störmer (department nano technology, GKSS) as an in house project [3].<br />
The energy range for both monochromators will be in the range between 5 and 50 keV.<br />
In the first experimental hutch the nano tomography setup will be located. Here we will take the<br />
advantage of the high brilliance and the low divergence of the X-ray beam. So, the high flux<br />
allows to realize nano tomography experiments in a sufficient time frame. Spatial resolutions in<br />
the nanometer range below 100 nm will be expected by using crossed cylindrical nano focus<br />
lenses which shape the beam in cone beam geometry for magnifying the radiographic images.<br />
We plan to instrument this setup in cooperation with the Institute for Microstructure Technology<br />
of the University Karlsruhe [4]. Further, a combination of hard X-ray microscopy with<br />
tomography will be realized by means of compound parabolic refractive lenses.
In the second experimental hutch the micro tomography setup is realized. At this distance from<br />
source the field of view is large enough to investigate samples of some millimeters diameter in<br />
(sub)-micrometer resolution. To achieve spatial resolutions near the physical limit, high precision<br />
air bearing stages mounted on granite substructures are used for the sample rotation unit as well<br />
as for the camera translation unit. Further, the sample fine adjustment unit is integrated into the<br />
aperture of the rotation stage to guarantee extremely low tilt errors of the samples. A<br />
sophisticated slip ring concept allows to rotate the samples continuously without losing precision.<br />
camera<br />
it<br />
CCD camera<br />
and<br />
rotation<br />
it<br />
granite<br />
substructure<br />
Figure 2: Micro tomography setup<br />
composed of a rotation unit, a camera<br />
translation unit and a granite<br />
substructure.<br />
Currently we calculate and design the X-ray resistant microscope optics. An automatic sample<br />
changer was designed and will be tested at the HARWI tomography setup during the next<br />
months.<br />
A second micro tomography instrument, almost identical in construction, will be installed at the<br />
High Energy Materials Science Beamline (HEMS) which extends the field of applications in<br />
materials science towards to higher energies. Fields of application in micro tomography<br />
encompass questions from materials science (e.g. imaging and quantitative analysis of pores,<br />
cracks, precipitations, phase transitions) as well as problems in the area of biology or medicine<br />
(e.g. structures of bones, tissues, teeth, plants, insects).<br />
A second Imaging Beamline workshop took place on December 4, 2008. The aim of this<br />
workshop was to present the new beamline project to the interested users as well as to gather<br />
input from experienced synchrotron tomography users for the detailed planning of the<br />
tomography instruments, the sample environments and the required laboratory equipment.<br />
References<br />
[1] http://petra3.desy.de/beamlines/beamlines/beamlines/beamline_8/index_eng.html<br />
[2] A. Haibel, F. Beckmann, T. Dose, J. Herzen, S. Utcke, T. Lippmann, N. Schell, A. Schreyer,<br />
The GKSS Beamlines at PETRA III and DORIS III, Proceedings SPIE Conference:<br />
Developments in X-Ray Tomography VI, San Diego, August 2008<br />
[3] M. Störmer; C. Michaelsen, J. Wiesmann, P. Ricardo and R. Bormann, Nanostructured Multi<br />
Layers for Applications in X-ray Optics. In: Dekker Encyclopedia of Nanoscience and<br />
Nanotechnology; Schwarz, J.A., Contescu, C.I., and Putyera, K., Eds.; Taylor & Francis<br />
Group: New York, 2006.<br />
[4] http://www.fzk.de/fzk/idcplg?IdcService=FZK&node=0887&document=ID_054085
2 nd GKSS Workshop:<br />
Imaging Beamline at PETRA III<br />
A. Haibel<br />
GKSS-Research Centre <strong>Geesthacht</strong> GmbH, Max-Planck-Str. 1, 21502 <strong>Geesthacht</strong>, Germany<br />
On December 4, 2008, the second GKSS Workshop: “Imaging Beamline at PETRA III” took place on<br />
the DESY site. The workshop program is shown below. The aim of this second workshop was to present<br />
the new beamline project to the interested users as well as to gather input from experienced synchrotron<br />
tomography users for the detailed planning of the tomography instruments, the sample environments<br />
and the required laboratory equipment.<br />
The current state and design of the Imaging Beamline (IBL) as well as detailed specifications of the<br />
micro tomography instrument (slip ring concept, sample adjustment unit concept, sample changer,<br />
sample identification system, optics concept) were introduced [1,2]. A second micro tomography setup<br />
(almost identical in construction) developed for the High Energy Materials Science Beamline (HEMS)<br />
was also presented. This setup will work at higher energies and expand the micro tomography<br />
applications towards the high energy regime. Several calculations for nano tomography, realized by<br />
compound refractive X-ray lenses, were presented. Further, several concepts of sample environments for<br />
in situ tomography were presented (e.g. furnaces, cryo streamer, tensile and stress racks).<br />
An IBL user lab furnished with laboratory equipment for sample preparation and postprocessing as well<br />
as data analysis was also introduced.<br />
The first part of presentations was dedicated to potential applications of tomography in materials science<br />
and their specific demands on the tomography setup at PETRA III. The second part of presentations was<br />
dedicated to potential applications of tomography at PETRA III in biological and medical science<br />
followed by the last part of presentations which was dealing with tomography instrumentation like<br />
multilayer structures and compound refractive lenses. Each part of presentation was followed by a round<br />
table discussion. The 26 participants enjoyed lively and highly focused discussions on the IBL case.<br />
References<br />
[1] http://petra3.desy.de/beamlines/beamlines/beamlines/beamline_8/index_eng.html<br />
[2] The GKSS Beamlines at PETRA III and DORIS III, A. Haibel, F. Beckmann, T. Dose, J. Herzen, S. Utcke, T.<br />
Lippmann, N. Schell, A. Schreyer“, Proceedings SPIE Conference: Developments in X-Ray Tomography VI,<br />
San Diego, August 2008
Program for the GKSS User Workshop of the Imaging Beamline @ PETRA III<br />
on 4 th of December 2008, 10h00 to 17h00<br />
building 25b, room 109<br />
10h00 Prof. A. Schreyer, Dr. A. Haibel, GKSS: Welcome and presentation of the Imaging Beamline<br />
project<br />
1 st part: Short presentations about potential applications in Materials Science<br />
10h30 Prof. András Borbély, MPIE: “In-situ tomographic investigations during high temperature creep”<br />
10h45 Dr. Axel Griesche, DLR Köln: “Synchrotron imaging methods for the investigation of metal<br />
interdiffusion”<br />
coffee break 15 min<br />
11h00 - 11h15<br />
11h15 Dr. Andriy Vyshnevskyy, GKSS: "Investigations on damage mechanisms of Al 2024 alloys"<br />
11h30 Dr. Michael Nöthe, TU Dresden: “In situ tomography for the investigation of sintering processes”<br />
Detailed discussion of the 1 st part<br />
11h45 – 12h30<br />
12h30 – 13h45 lunch break<br />
2 nd part: Short presentations about potential applications in Biological and Medical Science<br />
13h45 Prof. Bert Müller, Universität Basel: “High-resolution tomography of human tissues post mortem”<br />
14h00 Priv.-Doz. Michael Nickel, Universität Jena: “Microtomography in zoological sciences - topics,<br />
trends and needs”<br />
14h15 Dr. Regine Willumeit, GKSS: “Biomaterials research at GKSS”<br />
Detailed discussion of the 2 nd part<br />
14h30 – 15h15<br />
coffee break 15 min<br />
15h15 - 15h30<br />
3 rd part: Short presentations about tomography instrumentation<br />
15h30 Dipl.-Ing. Marcus Simon, KIT: “Compound refractive X-ray nanofocus lenses”<br />
15h45 Dipl.-Min. Thomas Ullmann, DLR Stuttgart: “Tomography test facilities for non-destructive<br />
evaluation of fibre reinforced materials”<br />
16h00 Dr. Michael Störmer, GKSS: “Single layer mirrors and multilayer mirrors for next-generation light<br />
sources”<br />
Detailed discussion of the 3 rd part<br />
16h15 – 17h00<br />
17h00 end of the workshop