BIBLIOGRAPHIC INPUT SHEET TEMPORARY Patterns of mortality ...
BIBLIOGRAPHIC INPUT SHEET TEMPORARY Patterns of mortality ... BIBLIOGRAPHIC INPUT SHEET TEMPORARY Patterns of mortality ...
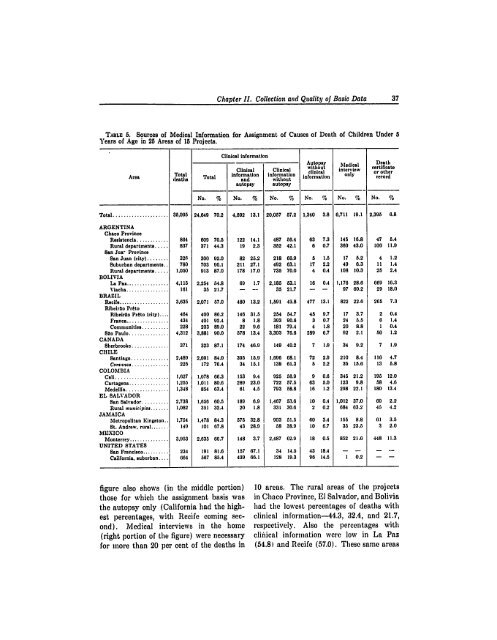
Chapter11. Collection and Quality of Basic Data 37 TABLE 5. Sources of Medical Information for Assignment of Causes of Death of Children Under 5 Years of Age in 25 Areas of 15 Projects. Area To deaths Total Clinical information Clinicl C a Autopsy AutopsyDeath Medical certificate Clinical Clinical withut ineaie or other information information information only rccord and without autopsy autopsy No. % No. % No. % No. % No. % No. % Total ..................... 35,095 24,649 70.2 4.592 13.1 20,057 57.2 1,340 3.8 6.711 19.1 2,395 6.8 ARGENTINA Chaco Province Realstencia ............ 864 609 70.5 122 14.1 487 56.4 63 7.3 145 16.8 47 5.4 Rural departments ..... 837 371 44.3 19 2.3 352 42.1 6 0.7 360 43.0 10 11.9 San Jua- Province San Juan (city) ........ 326 300 02.0 82 25.2 218 60.9 5 1.5 17 5.2 4 1.2 Suburban departments. 780 703 90.1 211 27.1 492 63.1 17 2.2 40 0.3 11 1.4 Rural departments ..... 1,050 013 87.0 178 17.0 735 70.0 4 0.4 108 10.3 25 2.4 BOLIVIA La Paz ................ 4,115 2,254 54.8 69 1.7 2,185 53.1 16 0.4 1,176 28.6 669 16.3 Viacha ................ 161 35 21.7 - -- 35 21.7 - - 97 60.2 29 18.0 BRAZIL Recife ................... 3,635 2,071 57.0 480 13.2 1,591 43.8 477 13.1 822 22.6 265 7.3 Ribeirao Preto Ribeirao Preto (city) .... 464 400 86.2 146 31.5 254 54.7 45 9.7 17 3.7 2 0.4 Franca ................ 434 401 92.4 8 1.8 303 90.6 3 0.7 24 5.5 0 1.4 Communities .......... 228 203 89.0 22 9.6 181 70.4 4 1.8 20 8.8 1 0.4 Sao Paulo ............... 4,312 3,881 00.0 578 13.4 3,303 76.0 289 6.7 02 2.1 50 1.2 CANADA Sherbrooke .............. 371 323 87.1 174 46.0 140 40.2 7 1.0 34 9.2 7 1.9 CHILE Santiago .............. 2,489 2,091 84.0 395 15.0 1,600 68.1 72 2.9 210 8.4 116 4.7 Comunas.............. 225 172 76.4 34 15.1 138 61.3 5 2.2 35 15.0 13 5.8 COLOMBIA Call .................... 1,627 1.078 60.3 153 9.4 925 56.9 9 0.0 345 21.2 195 12.0 Cartagena ............... 1,255 1,011 80.6 289 23.0 722 57.5 63 5.0 123 9.8 58 4.6 Medellin ................ 1,348 854 63.4 61 4.5 793 58.8 16 1.2 208 22.1 180 13.4 EL SALVADOR San Salvador .......... 2,738 1,656 60.5 189 6.9 1,467 53.6 10 0.4 1,012 37.0 60 2.2 Rural municipWo ....... 1,082 351 32.4 20 1.8 331 30.6 2 0.2 684 63.2 45 4.2 JAMAICA Metropolitan Kingston.. 1,754 1,478 84.3 575 32.8 003 51.5 60 3.4 155 8.8 61 3.5 St. Andrew, rural ....... 149 101 67.8 43 28.9 58 38.0 10 6.7 35 23.5 3 2.0 MEXICO Monterrey ............... 3,953 2,635 60.7 148 3.7 2,487 62.9 18 0.5 852 21.6 448 11.3 UNITED STATES San Francisco .......... 234 191 81.6 157 67.1 34 14.5 43 18.4 - - - Catifornia, suburban.... 664 567 85.4 439 66.1 128 19.3 96 14.5 1 0.2 figure also shows (in the middle portion) 10 areas. The rural areas of the projects those for which the assignment basis was in Chaco Province, El Salvador, and Bolivia the autopsy only (California had the high- had the lowest percentages of deaths with est percentages, with Recife coming sec- clinical information-44.3, 32.4, and 21.7, ond). Medical interviews in the home respectively. Also the percentages with (right portion of the figure) were necessary clihiical information were low in La Paz for more than 20 per cent of the deaths in (54.8) and Recife (57.0). These same areas
38 Patternsof Mortalityin Childhood Fio. 20.. Sources of Medical Information for Assignment of Causes of Death of Children Under 5Years in 25 Areas of 15 Projects. PI CENT 0 20 40 60 so oo 0 20 40 0 70 40 60 0 20 CITIES SANlJUANICIIY) CLINICAL RECORD m AUT PSY ONLY MEDICAL INTERVIEW THERO SIC PAULO iii1121 PlIlO icllii MIT. 1INOSIN / SANTIAGO SANFRANCISCO CARIAG|NA I[ISINCIA Z3 I CAIl KIDILIN SAN SALVADOR 'm IA PAZ FRANCA SANlJUAN SOIVOUAN o. folio COMMUNIII S SANJUANRURAL CALIFORNIA |U1U11 LNtqr11 CHILLCOMUNAS St. AND, 1 11,t n CHACORURAL IBSAIVADOR RURAL VIACHA n °Olath c.,lf11o1. *, otho.. e....d, and San Salvador had the highest percent- regarding burials of deceased children and ages in which the only source of information copied the facts from the burial certificate). was the medical interview in the home. Often the home address was missing or in- In the California project when a death complete and further searches had to be occurred outside a hospital an autopsy inade to locate the family. Ehis problem usually was performed by the medical proved especially difficult in the Colombian examiner and thus auto)sy protocols were projects, in which extensive searches had to available for all deaths without clinical be made. In Ribeiriio Pr~to efforts to find records (with one exception). clinical records and families were successful The percentages of deaths with no infor- and information was available on all but ination other than the death certificate or nine of the deaths. In San Juan Province, other record are also shown in Table 5 and even with diiffieult roads in rural areas, data Figure 20 (last colnmns). The percentage were available for all but 40 deaths (1.9 was high in La Paz-16.3 (in this project a per cent). In the El Salvador project the staff member worked in the large central repeated efforts to locate homes were succemetery and obtained daily information cessful; all but 2.2 per cent of deaths in
- Page 5 and 6: PrincipalCollaborators Dr. Adela Le
- Page 7 and 8: vi Patternsof Mortality in Childhoo
- Page 9 and 10: DEDICATED TO ROBERT GOODWIN FIELD A
- Page 11 and 12: CONTENTS (cont.) Page Comparisons w
- Page 13 and 14: CONTENTS (cont.) Distribution of Li
- Page 15 and 16: xvi Patternsof Mortality in Childho
- Page 17 and 18: xviii Patternsof Mortalityin Childh
- Page 19 and 20: 1200 1100 1000 900 800 700 600 500
- Page 21 and 22: 2 Pattern8of Mortality in Childhood
- Page 23 and 24: 4: Patternsof Mortality in Childhoo
- Page 25 and 26: •6 Pattern of Mortalityin,Childho
- Page 27 and 28: 8 Patterns ol Mortality in Childhoo
- Page 29 and 30: 10 Patternsof Mortalityin Childhood
- Page 31 and 32: 12 Pattermn of Mortalityin Childhoo
- Page 33 and 34: 14 Patternsof Mortality in Childhoo
- Page 35 and 36: 16 Patternso Mortality in Childhood
- Page 37 and 38: 18 Patternsof Mortality in Childhoo
- Page 39 and 40: 20 PatternsofMortality in Childhood
- Page 41 and 42: 22 Patternsof Mrtalityin (i'=LWWoo
- Page 43 and 44: 24 Patternsof Mortality in Childhoo
- Page 45 and 46: 26 Pattern8of Mortalityin Childhood
- Page 47 and 48: 28: Patterhs ol Mortality in Childh
- Page 49 and 50: 30 Patterns 01Aortalil inChildhood
- Page 51 and 52: 32, Pattern8ofMortality in Childhoo
- Page 53 and 54: 34 Patterms of Mortality in Childho
- Page 55: 36 Pattermsof Mortality in Childhoo
- Page 59 and 60: 40 Patterns of Mortalityin Childhoo
- Page 61 and 62: '42 Patterns of Mortality inChildho
- Page 63 and 64: 44 Patterns of Mortalitiiin'Childho
- Page 65 and 66: 46 Pattesof Mortality in Childhood
- Page 67 and 68: 48 Patternsof Mortality in Childhoo
- Page 69 and 70: 50 PatternSi of Mortalityin Childho
- Page 71 and 72: 52 Patternsof Mortality in Childhoo
- Page 73 and 74: 54,, Pattyern of Mortality in:Child
- Page 75 and 76: *56 Patterniof Mortality in Childho
- Page 77 and 78: Chapter IV Mortality in Childhood T
- Page 79 and 80: 60 Pattern&'oJMortalityin Childhood
- Page 81 and 82: 62 Patternsof Mortality in Childhoo
- Page 83 and 84: 64 Patternsof Mortality,in Childhbo
- Page 85 and 86: 66 Patternsof Mortalitv in Childhoo
- Page 87 and 88: !68 Patternsof Mortalityin Childhoo
- Page 89 and 90: 70 Patterns of Mortality in Childho
- Page 91 and 92: 72 Pattern oflMortality in Childhoo
- Page 93 and 94: 74' Patternsof Mortality in Childho
- Page 95 and 96: !78 Patterisof Mortality.in Childho
- Page 97 and 98: 78 Pdttern of Mortality in Childhoo
- Page 99 and 100: 80 Patternsof Mortalityin Childhood
- Page 101 and 102: 82 Patternsof Mortality in Childhoo
- Page 103 and 104: 84 Patternsof Mortality in Childhoo
- Page 105 and 106: 86 Patterns of Mortality in Childho
Chapter11. Collection and Quality <strong>of</strong> Basic Data<br />
37<br />
TABLE 5. Sources <strong>of</strong> Medical Information for Assignment <strong>of</strong> Causes <strong>of</strong> Death <strong>of</strong> Children Under 5<br />
Years <strong>of</strong> Age in 25 Areas <strong>of</strong> 15 Projects.<br />
Area<br />
To<br />
deaths<br />
Total<br />
Clinical information<br />
Clinicl C a Autopsy<br />
AutopsyDeath<br />
Medical certificate<br />
Clinical Clinical withut ineaie or other<br />
information information information only rccord<br />
and without<br />
autopsy autopsy<br />
No. % No. % No. % No. % No. % No. %<br />
Total ..................... 35,095 24,649 70.2 4.592 13.1 20,057 57.2 1,340 3.8 6.711 19.1 2,395 6.8<br />
ARGENTINA<br />
Chaco Province<br />
Realstencia ............ 864 609 70.5 122 14.1 487 56.4 63 7.3 145 16.8 47 5.4<br />
Rural departments ..... 837 371 44.3 19 2.3 352 42.1 6 0.7 360 43.0 10 11.9<br />
San Jua- Province<br />
San Juan (city) ........ 326 300 02.0 82 25.2 218 60.9 5 1.5 17 5.2 4 1.2<br />
Suburban departments. 780 703 90.1 211 27.1 492 63.1 17 2.2 40 0.3 11 1.4<br />
Rural departments ..... 1,050 013 87.0 178 17.0 735 70.0 4 0.4 108 10.3 25 2.4<br />
BOLIVIA<br />
La Paz ................ 4,115 2,254 54.8 69 1.7 2,185 53.1 16 0.4 1,176 28.6 669 16.3<br />
Viacha ................ 161 35 21.7 - -- 35 21.7 - - 97 60.2 29 18.0<br />
BRAZIL<br />
Recife ................... 3,635 2,071 57.0 480 13.2 1,591 43.8 477 13.1 822 22.6 265 7.3<br />
Ribeirao Preto<br />
Ribeirao Preto (city) .... 464 400 86.2 146 31.5 254 54.7 45 9.7 17 3.7 2 0.4<br />
Franca ................ 434 401 92.4 8 1.8 303 90.6 3 0.7 24 5.5 0 1.4<br />
Communities .......... 228 203 89.0 22 9.6 181 70.4 4 1.8 20 8.8 1 0.4<br />
Sao Paulo ............... 4,312 3,881 00.0 578 13.4 3,303 76.0 289 6.7 02 2.1 50 1.2<br />
CANADA<br />
Sherbrooke .............. 371 323 87.1 174 46.0 140 40.2 7 1.0 34 9.2 7 1.9<br />
CHILE<br />
Santiago .............. 2,489 2,091 84.0 395 15.0 1,600 68.1 72 2.9 210 8.4 116 4.7<br />
Comunas.............. 225 172 76.4 34 15.1 138 61.3 5 2.2 35 15.0 13 5.8<br />
COLOMBIA<br />
Call .................... 1,627 1.078 60.3 153 9.4 925 56.9 9 0.0 345 21.2 195 12.0<br />
Cartagena ............... 1,255 1,011 80.6 289 23.0 722 57.5 63 5.0 123 9.8 58 4.6<br />
Medellin ................ 1,348 854 63.4 61 4.5 793 58.8 16 1.2 208 22.1 180 13.4<br />
EL SALVADOR<br />
San Salvador .......... 2,738 1,656 60.5 189 6.9 1,467 53.6 10 0.4 1,012 37.0 60 2.2<br />
Rural municipWo ....... 1,082 351 32.4 20 1.8 331 30.6 2 0.2 684 63.2 45 4.2<br />
JAMAICA<br />
Metropolitan Kingston.. 1,754 1,478 84.3 575 32.8 003 51.5 60 3.4 155 8.8 61 3.5<br />
St. Andrew, rural ....... 149 101 67.8 43 28.9 58 38.0 10 6.7 35 23.5 3 2.0<br />
MEXICO<br />
Monterrey ............... 3,953 2,635 60.7 148 3.7 2,487 62.9 18 0.5 852 21.6 448 11.3<br />
UNITED STATES<br />
San Francisco .......... 234 191 81.6 157 67.1 34 14.5 43 18.4 - - -<br />
Catifornia, suburban.... 664 567 85.4 439 66.1 128 19.3 96 14.5 1 0.2 <br />
figure also shows (in the middle portion) 10 areas. The rural areas <strong>of</strong> the projects<br />
those for which the assignment basis was in Chaco Province, El Salvador, and Bolivia<br />
the autopsy only (California had the high- had the lowest percentages <strong>of</strong> deaths with<br />
est percentages, with Recife coming sec- clinical information-44.3, 32.4, and 21.7,<br />
ond). Medical interviews in the home respectively. Also the percentages with<br />
(right portion <strong>of</strong> the figure) were necessary clihiical information were low in La Paz<br />
for more than 20 per cent <strong>of</strong> the deaths in (54.8) and Recife (57.0). These same areas


