BIBLIOGRAPHIC INPUT SHEET TEMPORARY Patterns of mortality ...
BIBLIOGRAPHIC INPUT SHEET TEMPORARY Patterns of mortality ... BIBLIOGRAPHIC INPUT SHEET TEMPORARY Patterns of mortality ...
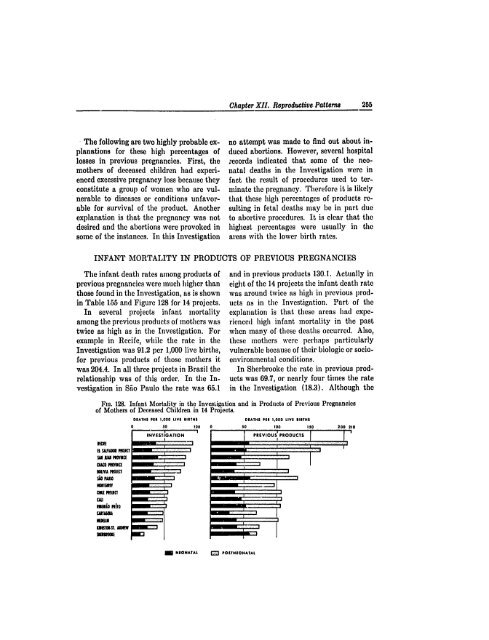
ChapterXII. Reproductive Patterns 255 The following are two highly probable explanations for these high percentages of losses in previous pregnancies. First, the mothers of deceased children had experienced excessive pregnancy loss because they constitute a group of women who are vulnerable to diseases or conditions unfavorable for survival of the product. Another explanation is that the pregnancy was not desired and the abortions were provoked in some of the instances. In this Investigation no attempt was made to find out about induced abortions. However, several hospital records indicated that some of the neonatal deaths in the Investigation were in fact the result of procedures used to terminate the pregnancy. Therefore it is likely that these high percentages of products resuiting in fetal deaths may be in part due to abortive procedures. It is clear that the highest percentages were usually in the areas with the lower birth rates. INFANT MORTALITY IN PRODUCTS OF PREVIOUS PREGNANCIES The infant death rates among products of previous pregnancies were much higher than those found in the Investigation, as is shown in Table 155 and Figure 128 for 14 projects. In several projects infant mortality among the previous products of mothers was twice as high as in the Investigation. For example in Recife, while the rate in the Investigation was 91.2 per 1,000 live births, for previous products of those mothers it was 204.4. In all three projects in Brazil the relationship was of this order. In the Investigation in Sdo Paulo the rate was 65.1 and in previous products 130.1. Actually in eight of the 14 projects the infant death rate was around twice as high in previous products as in the Investigation. Part of the explanation is that these areas had experienced high infant mortality in the past when many of these deaths occurred. Also, these mothers were perhaps particularly vulnerable because of their biologic or socioenvironmental conditions. In Sherbrooke the rate in previous products was 69.7, or nearly four times the rate in the Investigation (18.3). Although the Fia. 128. Infant Mortality in the InvesLigation and in Products of Previous Pregnancies of Mothers of Deceased Children in 14 Projects. DEATHS PER 1.000 LIVE SIRTHS DEATHS PEE 1,000 LIVE 8ITHS 0 50 t00 0 so t00 ISO 200 210 INVSTIGATION PREVIOUS PRODUCTS I StffAW WICE Si PMG (Oil rP101(1 II " 0 "ho' I il INS . MW W NEONATA POSIEONATAL
256 Patternsof Mortalityin Childhood TAnL 155. Infant Mortality in Products of Previous Pregnancies of Mothers of Deceased Children and in Investigation, by Age Group, in 17 Areas of 14 Projects. Live Area births TOl No. I No. Previous pregnancirs Infant deaths Postneonatal Investigation death rateadInfant Neonatal Post- Rate No. Rate No. Rate Total Neonatal neonatal ARGENTINA '3.9 170 38.2 159 35.7 80.1 32.3 47.8 Chaco Province............. 4,453 329 395 73.2 81.3 38.8 42.6 San Juan Province .......... 5,393 630 111.8 235 43.6 San Juan (city)........... 460 40 87.0 17 37.0) 23 50.0 50.7 29.6 21.1 .17.7 141 73.9 87.9 44.6 43.3 Suburban departmients.... 1.908 232 121.6 91 39.0 54.9 Rural departments ........ 2,925 358 121.4 127 43.4 231 70.0 94.5 492 82.6 74.2 29.0 45.2 IIOLIVIA project............. 5,955 694 11(,.5 202 33.9 BRAZI L1 91.2 55.9 Recife .................... 11,466 2,3,14 204.4 646 50.3 1.698 148.1 35.3 52.6 28.2 24.3 Ribeirfio PrOto ............ .. 2,642 275 10,:.l 136 51.5 139 52.6 Sao Paulo.................. 8,913 1,160 130.1 518 58.1 642 72.0 65.1 33.7 31.5 CANADA 588 41 69.7 34 57.8 7 11.9 18.3 13.5 4.8 Sherbrooke ................. 28.6 28.5 CHIL.E project ............... 4,171 442 105.8 146 35.0 290 70.9 55.2 CO.OM IlA 368 106.6 156 45.2 212 61.4 54.6 25.4 29.2 Call ....................... 3,451 25.9 115 42.5 47.8 22.4 25.4 Cartagena ................. 2,703 185 68.4 70 399 101.1 150 38.0 249 63.1 47.6 19.7 27.9 Medellin .................. 3,948 55.8 1,154 107.5 88.4 29.6 58.8 EI, SAIVADOR project ...... 10,733 1,753 163.3 599 28.2 53.6 San Salvador ............. 7,030 1,162 165.3 376 53.3 787 111.9 81.7 367 99.1 120.0 36.1 83.9 Rural ,nuniripios......... 3,703 591 159.6 224 60.5 JAMAICA Hingston-St. Andrew........ 2,435 177 72.7 90 39.4 81 33.3 38.8 24.2 14.6 MEXICO Monterrey................. 11,404 1,096 95.4 455 39.6 641 55.8 60.7 26.0 34.8 Htates per 1,000 live births. experience is limited, this finding was unexfant mortality in the general population. reflects in part the pattern of changing in pectcd. Unfortunately, reproductive histo- ries were not obtained in the California pro- Is ject. It may be that when infant mortality becomes low, as in the Sherbrooke project, In terms of pregnancy losses as fetal it is concentrated principally in the infants deaths and as infant deaths, these mothers of vulnerable women-those whose repro- of children who died in infancy experienced ductive hIstory is unfavorable to survival of excessive pregnancy wastage. These find the infant. ings, coupled with those on maternal age The difference between infant mortality and parity relationships to infant moramong products of previous p)regnan- tality, indicate the need for planning in cies and that found in the Investigation order to ensure healthy reproduction in was particularly marked in the postneonatal the future. Also, the many gaps in our inperiod. For the 14 projects combined, there formation point to the need for research in was a 57-per-cent reduction in the postneonatal rate, compared with a 39-per-cent re- these facts routinely for all births and all these important fields and for collection of duction in the neonatal rate. This difference infant deaths.
- Page 223 and 224: 204 Patternaof Mortalityin Childhoo
- Page 225 and 226: 208 Patternsof Mortalityin Childhoo
- Page 227 and 228: 208 Patterns of Mortality in Childh
- Page 229 and 230: '210, Patternsof Mortalityin Childh
- Page 231 and 232: 212 Patterns of Mortality in Childh
- Page 233 and 234: 214 Patterns of Mortality in Childh
- Page 235 and 236: 216 Patternsof Mortality in Childho
- Page 237 and 238: Chapter:XI Other Diseases and Exter
- Page 239 and 240: 220 Patternsof Mortalityin Childhoo
- Page 241 and 242: 222 Patternsof Mortalityin Childhoo
- Page 243 and 244: 224 Patternsof Mortalityin Childhoo
- Page 245 and 246: 226 Patterns of Mortalityin Childho
- Page 247 and 248: 228i Patterniof Mirtalityin Childho
- Page 249 and 250: 230 Patternsof Mortality in Childho
- Page 251 and 252: 232 Patternsof Mortalityin Childhoo
- Page 253 and 254: .234 i:Patternsof MortalityiwChildh
- Page 255 and 256: 236 Patternsof Mortality in Childho
- Page 257 and 258: 238 Patternh of Mortalityin Childho
- Page 259 and 260: 240 Patternsof Mortalityin Childhoo
- Page 261 and 262: 242 Pattern of Mortality in Childho
- Page 263 and 264: 244. Patternaof Mortality in Childh
- Page 265 and 266: 246 Patterns of Mortality in Childh
- Page 267 and 268: 248 Patternsof Mortality in Childho
- Page 269 and 270: 250 Patterns of Mortality in Childh
- Page 271 and 272: 252 Patternsof Mortality in Childho
- Page 273: 254 Patternsof Mortality in Childho
- Page 277 and 278: 258 Patternsof Mortality in Childho
- Page 279 and 280: 260 Paiterns of Mortality in Childh
- Page 281 and 282: 262 Pattern,of Mortalityin Childhoo
- Page 283 and 284: .2,4 Pattensof Mortality in Childho
- Page 285 and 286: 266 Patternsof Mortalityin Childhoo
- Page 287 and 288: 268 Patternsof Mortalityin Childhoo
- Page 289 and 290: 270 patternsofMortality in Childhoo
- Page 291 and 292: Chater XI.v Socioeconomic and Relat
- Page 293 and 294: 274 Patternsof Mortality in Childho
- Page 295 and 296: 276 PatternsofMortality.inChildhood
- Page 297 and 298: 278 Patterna of Mortalityin Childho
- Page 299 and 300: 280 Patternsof Mortality in Childho
- Page 301 and 302: 282 Patternsof Mortalityin Childhoo
- Page 303 and 304: 284 Patternsof Mortality in Childho
- Page 305 and 306: 286 PatternA of Mdrtality in Childh
- Page 307 and 308: 288 Patternsof Mortality in Childho
- Page 309 and 310: 290 Patternsof Mortality in Childho
- Page 311 and 312: 292 Patternsof Mortality in Childho
- Page 313 and 314: 294 Patternsof Mortality in Childho
- Page 315 and 316: 296 Patternsof Mortality in Childho
- Page 317 and 318: 298 Patternsof -Mord ity in Childho
- Page 319 and 320: 300 Patterni. of'Mortlity n C.hildh
- Page 321 and 322: 302 Patternsof Mortalityin Childhoo
- Page 323 and 324: 304 Patternsof Mortalityin Childhoo
ChapterXII. Reproductive <strong>Patterns</strong> 255<br />
The following are two highly probable explanations<br />
for these high percentages <strong>of</strong><br />
losses in previous pregnancies. First, the<br />
mothers <strong>of</strong> deceased children had experienced<br />
excessive pregnancy loss because they<br />
constitute a group <strong>of</strong> women who are vulnerable<br />
to diseases or conditions unfavorable<br />
for survival <strong>of</strong> the product. Another<br />
explanation is that the pregnancy was not<br />
desired and the abortions were provoked in<br />
some <strong>of</strong> the instances. In this Investigation<br />
no attempt was made to find out about induced<br />
abortions. However, several hospital<br />
records indicated that some <strong>of</strong> the neonatal<br />
deaths in the Investigation were in<br />
fact the result <strong>of</strong> procedures used to terminate<br />
the pregnancy. Therefore it is likely<br />
that these high percentages <strong>of</strong> products resuiting<br />
in fetal deaths may be in part due<br />
to abortive procedures. It is clear that the<br />
highest percentages were usually in the<br />
areas with the lower birth rates.<br />
INFANT MORTALITY IN PRODUCTS OF PREVIOUS PREGNANCIES<br />
The infant death rates among products <strong>of</strong><br />
previous pregnancies were much higher than<br />
those found in the Investigation, as is shown<br />
in Table 155 and Figure 128 for 14 projects.<br />
In several projects infant <strong>mortality</strong><br />
among the previous products <strong>of</strong> mothers was<br />
twice as high as in the Investigation. For<br />
example in Recife, while the rate in the<br />
Investigation was 91.2 per 1,000 live births,<br />
for previous products <strong>of</strong> those mothers it<br />
was 204.4. In all three projects in Brazil the<br />
relationship was <strong>of</strong> this order. In the Investigation<br />
in Sdo Paulo the rate was 65.1<br />
and in previous products 130.1. Actually in<br />
eight <strong>of</strong> the 14 projects the infant death rate<br />
was around twice as high in previous products<br />
as in the Investigation. Part <strong>of</strong> the<br />
explanation is that these areas had experienced<br />
high infant <strong>mortality</strong> in the past<br />
when many <strong>of</strong> these deaths occurred. Also,<br />
these mothers were perhaps particularly<br />
vulnerable because <strong>of</strong> their biologic or socioenvironmental<br />
conditions.<br />
In Sherbrooke the rate in previous products<br />
was 69.7, or nearly four times the rate<br />
in the Investigation (18.3). Although the<br />
Fia. 128. Infant Mortality in the InvesLigation and in Products <strong>of</strong> Previous Pregnancies<br />
<strong>of</strong> Mothers <strong>of</strong> Deceased Children in 14 Projects.<br />
DEATHS PER 1.000 LIVE SIRTHS<br />
DEATHS PEE 1,000 LIVE 8ITHS<br />
0 50 t00 0 so t00 ISO 200 210<br />
INVSTIGATION<br />
PREVIOUS PRODUCTS<br />
I<br />
StffAW WICE<br />
Si PMG<br />
(Oil rP101(1 II<br />
" 0 "ho' I il<br />
INS . MW<br />
W NEONATA<br />
POSIEONATAL


