- Page 1 and 2:
A'.1 ii,', r" lWAH', T , .NA ON i I
- Page 3 and 4:
PATTEiNS OF MORTALITY IN CHILnnooll
- Page 5 and 6:
PrincipalCollaborators Dr. Adela Le
- Page 7 and 8:
vi Patternsof Mortality in Childhoo
- Page 9 and 10:
DEDICATED TO ROBERT GOODWIN FIELD A
- Page 11 and 12:
CONTENTS (cont.) Page Comparisons w
- Page 13 and 14:
CONTENTS (cont.) Distribution of Li
- Page 15 and 16:
xvi Patternsof Mortality in Childho
- Page 17 and 18:
xviii Patternsof Mortalityin Childh
- Page 19 and 20:
1200 1100 1000 900 800 700 600 500
- Page 21 and 22:
2 Pattern8of Mortality in Childhood
- Page 23 and 24:
4: Patternsof Mortality in Childhoo
- Page 25 and 26:
•6 Pattern of Mortalityin,Childho
- Page 27 and 28:
8 Patterns ol Mortality in Childhoo
- Page 29 and 30:
10 Patternsof Mortalityin Childhood
- Page 31 and 32:
12 Pattermn of Mortalityin Childhoo
- Page 33 and 34:
14 Patternsof Mortality in Childhoo
- Page 35 and 36:
16 Patternso Mortality in Childhood
- Page 37 and 38:
18 Patternsof Mortality in Childhoo
- Page 39 and 40:
20 PatternsofMortality in Childhood
- Page 41 and 42:
22 Patternsof Mrtalityin (i'=LWWoo
- Page 43 and 44:
24 Patternsof Mortality in Childhoo
- Page 45 and 46:
26 Pattern8of Mortalityin Childhood
- Page 47 and 48:
28: Patterhs ol Mortality in Childh
- Page 49 and 50:
30 Patterns 01Aortalil inChildhood
- Page 51 and 52:
32, Pattern8ofMortality in Childhoo
- Page 53 and 54:
34 Patterms of Mortality in Childho
- Page 55 and 56:
36 Pattermsof Mortality in Childhoo
- Page 57 and 58:
38 Patternsof Mortalityin Childhood
- Page 59 and 60:
40 Patterns of Mortalityin Childhoo
- Page 61 and 62:
'42 Patterns of Mortality inChildho
- Page 63 and 64:
44 Patterns of Mortalitiiin'Childho
- Page 65 and 66:
46 Pattesof Mortality in Childhood
- Page 67 and 68:
48 Patternsof Mortality in Childhoo
- Page 69 and 70:
50 PatternSi of Mortalityin Childho
- Page 71 and 72:
52 Patternsof Mortality in Childhoo
- Page 73 and 74:
54,, Pattyern of Mortality in:Child
- Page 75 and 76:
*56 Patterniof Mortality in Childho
- Page 77 and 78:
Chapter IV Mortality in Childhood T
- Page 79 and 80:
60 Pattern&'oJMortalityin Childhood
- Page 81 and 82:
62 Patternsof Mortality in Childhoo
- Page 83 and 84:
64 Patternsof Mortality,in Childhbo
- Page 85 and 86:
66 Patternsof Mortalitv in Childhoo
- Page 87 and 88:
!68 Patternsof Mortalityin Childhoo
- Page 89 and 90:
70 Patterns of Mortality in Childho
- Page 91 and 92:
72 Pattern oflMortality in Childhoo
- Page 93 and 94:
74' Patternsof Mortality in Childho
- Page 95 and 96:
!78 Patterisof Mortality.in Childho
- Page 97 and 98:
78 Pdttern of Mortality in Childhoo
- Page 99 and 100:
80 Patternsof Mortalityin Childhood
- Page 101 and 102:
82 Patternsof Mortality in Childhoo
- Page 103 and 104:
84 Patternsof Mortality in Childhoo
- Page 105 and 106:
86 Patterns of Mortality in Childho
- Page 107 and 108:
-88 .. . i atten8oiMortait~i 'Child
- Page 109 and 110:
90 Patternsof Mortality in Childhoo
- Page 111 and 112:
02 Patternsof Mortalityin Childhood
- Page 113 and 114:
94 Patternsof Mortalityin Childhood
- Page 115 and 116:
96 Patters.of Mortality in Childhoo
- Page 117 and 118:
98. PatternsofMorti6ity in Childhoo
- Page 119 and 120:
100 Patternsof Mortality in Childho
- Page 121 and 122:
-.102 Patternsof Mortalityin Childh
- Page 123 and 124:
104 Patternsof Mortality in Childho
- Page 125 and 126:
106 Patternsof Mortality in Childho
- Page 127 and 128:
108" .. Patternsof Mortality in Chi
- Page 129 and 130:
110 ,Patternsof Mortality in Childh
- Page 131 and 132:
112: Pattern. of Mortality in Child
- Page 133 and 134:
114 .Pattern.of Mortality in Childh
- Page 135 and 136:
116 , patterniof. Mortality in Chil
- Page 137 and 138:
118 Patterns of Mortality in Childh
- Page 139 and 140:
120 Patternsof Mortality in Childho
- Page 141 and 142:
12. Patternsof Mortality in Childho
- Page 143 and 144:
124* Patternsof Mortality in Childh
- Page 145 and 146:
126, Patternsof Mortalityin Childho
- Page 147 and 148:
128 Patternsof Mortalityin'Childhoo
- Page 149 and 150:
130 Patterns of Mortality in Childh
- Page 151 and 152:
132 Pattenisof Mortality in Childho
- Page 153 and 154:
134i Patternsof Mortality in Childh
- Page 155 and 156:
4130 -Patternm of Mortality.in Chil
- Page 157 and 158:
138 Patternsof Mortality in Childho
- Page 159 and 160:
140. Patterisof Mortality in Childh
- Page 161 and 162:
S142 :Patternsof.Mortality in Child
- Page 163 and 164:
144 ,Patterna of Mortality in:Child
- Page 165 and 166:
.146. Patternsof Mortalityin Childh
- Page 167 and 168:
148, PalternaoJMortalityin Childhoo
- Page 169 and 170:
'150 Patternsof Mortalityin Childho
- Page 171 and 172:
152 Patternsof Mortality in Childho
- Page 173 and 174:
1 64 Patternsof Mortalityin Uhlzdh
- Page 175 and 176:
156.. Patterhei o[Mortality'inChild
- Page 177 and 178:
-158. Patternsof Mortality in Child
- Page 179 and 180:
160 Patternsof Mortality in Childho
- Page 181 and 182:
162 Pattern8of Mortalityin Childhoo
- Page 183 and 184:
164 Patternsof Mortalityin Childhoo
- Page 185 and 186:
188 Patter w8 Motalityin Childhood
- Page 187 and 188:
168 Patternaof Mortalityin Childhoo
- Page 189 and 190:
,170 Patternsof Mortalityin Childho
- Page 191 and 192:
172 Patternsof Mortalityin Childhoo
- Page 193 and 194:
174, Pat*ernof-Mortalityin Childhoo
- Page 195 and 196:
176 Patterns of Mortality in Childh
- Page 197 and 198: 178 Patternsof Mortalityin Childhoo
- Page 199 and 200: ,180 Patternsof Mortality in Childh
- Page 201 and 202: 182 Patterns of Mortality in Childh
- Page 203 and 204: 184 Patternsof Mortalityin Childhoo
- Page 205 and 206: Chapter X Congenital Anomalies Know
- Page 207 and 208: 188 Patternsof Mortality in Childho
- Page 209 and 210: 190 Patternsof Mortalityin Childhoo
- Page 211 and 212: 192 Patternlof Mortality in Childho
- Page 213 and 214: 194 Pattern of Mortality in Childho
- Page 215 and 216: 196 Patternsof Mortality in Childho
- Page 217 and 218: 0819 Patternsof Mortality in Childh
- Page 219 and 220: 200 Patternsof Mortality in Childho
- Page 221 and 222: :202 ,Pattern8of Mortality in Child
- Page 223 and 224: 204 Patternaof Mortalityin Childhoo
- Page 225 and 226: 208 Patternsof Mortalityin Childhoo
- Page 227 and 228: 208 Patterns of Mortality in Childh
- Page 229 and 230: '210, Patternsof Mortalityin Childh
- Page 231 and 232: 212 Patterns of Mortality in Childh
- Page 233 and 234: 214 Patterns of Mortality in Childh
- Page 235 and 236: 216 Patternsof Mortality in Childho
- Page 237 and 238: Chapter:XI Other Diseases and Exter
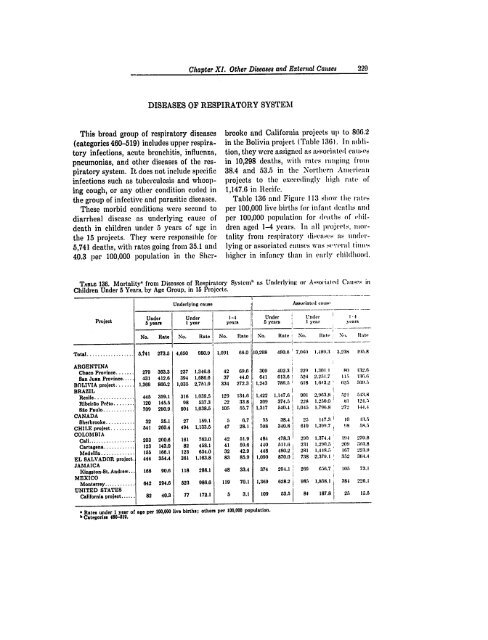
- Page 239 and 240: 220 Patternsof Mortalityin Childhoo
- Page 241 and 242: 222 Patternsof Mortalityin Childhoo
- Page 243 and 244: 224 Patternsof Mortalityin Childhoo
- Page 245 and 246: 226 Patterns of Mortalityin Childho
- Page 247: 228i Patterniof Mirtalityin Childho
- Page 251 and 252: 232 Patternsof Mortalityin Childhoo
- Page 253 and 254: .234 i:Patternsof MortalityiwChildh
- Page 255 and 256: 236 Patternsof Mortality in Childho
- Page 257 and 258: 238 Patternh of Mortalityin Childho
- Page 259 and 260: 240 Patternsof Mortalityin Childhoo
- Page 261 and 262: 242 Pattern of Mortality in Childho
- Page 263 and 264: 244. Patternaof Mortality in Childh
- Page 265 and 266: 246 Patterns of Mortality in Childh
- Page 267 and 268: 248 Patternsof Mortality in Childho
- Page 269 and 270: 250 Patterns of Mortality in Childh
- Page 271 and 272: 252 Patternsof Mortality in Childho
- Page 273 and 274: 254 Patternsof Mortality in Childho
- Page 275 and 276: 256 Patternsof Mortalityin Childhoo
- Page 277 and 278: 258 Patternsof Mortality in Childho
- Page 279 and 280: 260 Paiterns of Mortality in Childh
- Page 281 and 282: 262 Pattern,of Mortalityin Childhoo
- Page 283 and 284: .2,4 Pattensof Mortality in Childho
- Page 285 and 286: 266 Patternsof Mortalityin Childhoo
- Page 287 and 288: 268 Patternsof Mortalityin Childhoo
- Page 289 and 290: 270 patternsofMortality in Childhoo
- Page 291 and 292: Chater XI.v Socioeconomic and Relat
- Page 293 and 294: 274 Patternsof Mortality in Childho
- Page 295 and 296: 276 PatternsofMortality.inChildhood
- Page 297 and 298: 278 Patterna of Mortalityin Childho
- Page 299 and 300:
280 Patternsof Mortality in Childho
- Page 301 and 302:
282 Patternsof Mortalityin Childhoo
- Page 303 and 304:
284 Patternsof Mortality in Childho
- Page 305 and 306:
286 PatternA of Mdrtality in Childh
- Page 307 and 308:
288 Patternsof Mortality in Childho
- Page 309 and 310:
290 Patternsof Mortality in Childho
- Page 311 and 312:
292 Patternsof Mortality in Childho
- Page 313 and 314:
294 Patternsof Mortality in Childho
- Page 315 and 316:
296 Patternsof Mortality in Childho
- Page 317 and 318:
298 Patternsof -Mord ity in Childho
- Page 319 and 320:
300 Patterni. of'Mortlity n C.hildh
- Page 321 and 322:
302 Patternsof Mortalityin Childhoo
- Page 323 and 324:
304 Patternsof Mortalityin Childhoo
- Page 325 and 326:
306 Patternsof Mortalityin Childhoo
- Page 327 and 328:
308 Patterns of Mortality in Childh
- Page 329 and 330:
310 Patterns of Mortalityin Childho
- Page 331 and 332:
312 Patternsof Mortality in Childho
- Page 333 and 334:
314 Patternsof Mortality in Childho
- Page 335 and 336:
310' Pattern8 of Mortality in Child
- Page 337 and 338:
318 Pattern8.ofMortalityin Childhoo
- Page 339 and 340:
320 PatterisoflMortality in Childho
- Page 341 and 342:
322 Potterne of Mortality,in Childh
- Page 343 and 344:
324 Pattems of Mortality in Childho
- Page 345 and 346:
326 Patternsof Mortality in Childho
- Page 347 and 348:
328 . Pattern ofMortality in Childh
- Page 349 and 350:
330 Pattern of, Mortality in Childh
- Page 351 and 352:
332 Patternsof Mortality,in Childho
- Page 353 and 354:
334 Patterna of Moitalityin Childho
- Page 355 and 356:
33V_ Patternm.ofMortality iMChildho
- Page 357 and 358:
138, .Patter8 of Mortality in Child
- Page 359 and 360:
340, Patternsof Mortalityin Childho
- Page 361 and 362:
3421. Patterp of.MortalityImnuntano
- Page 363 and 364:
344 Pattern of.Mortality in Childho
- Page 365 and 366:
346 Patternsof Mortalityin Childhoo
- Page 367 and 368:
348 Patterna,Oe4MortalityinChildhoo
- Page 369 and 370:
350 Patternaof Mortalityin Childhoo
- Page 371 and 372:
352 Paternsof Mortalityin Childhood
- Page 373 and 374:
354 . patteens of Mortality*in Chil
- Page 375 and 376:
356' Pattirn 'ofMortality in Childh
- Page 377 and 378:
APPENDICES
- Page 380 and 381:
APPENDIX 1 STANDARD FORM OF QUESTIO
- Page 382 and 383:
Appendix 1 363 Confidential INTER-A
- Page 384 and 385:
Appendix 1 365 INTER-AMERICAN INVES
- Page 386 and 387:
o- ~-: ' 4vApendix'1 367 Confidenti
- Page 388 and 389:
Appendiz 1 369 Confidential INTER-A
- Page 390 and 391:
APPENDIX 2 UNDERLYING AND ASSOCIATE
- Page 392 and 393:
Appendix 2 373 DEATH RATES Chaco Pr
- Page 394 and 395:
Appendix 2 375 DEATH RATES Resisten
- Page 396 and 397:
Appendix 8 377 DEATH RATES Rural De
- Page 398 and 399:
DEATH RATES San Juan Province-ARGEN
- Page 400 and 401:
Appendii 2 381 DEATH RATES City of
- Page 402 and 403:
4ppendiz2 383 DEATH RATES Suburban
- Page 404 and 405:
Appendiz 2 385 DEATH RATES Rural De
- Page 406 and 407:
ppendix 2 087 DEATH-RATES La Paz-BO
- Page 408 and 409:
Appendix 8 389 DEATH RATES Viacha-B
- Page 410 and 411:
Appendix 2 391 DEATH RATES Recife-B
- Page 412 and 413:
Appendix 9 393 DEATH RATES City of
- Page 414 and 415:
dppendix 8 395 DEATH RATES Franca,
- Page 416 and 417:
Appendix'$ :397 DEATH RATES Ribeiri
- Page 418 and 419:
Appendix B 399 Cause DEATH RATES S
- Page 420 and 421:
Appendix . 401 DEATH RATES Sherbroo
- Page 422 and 423:
Appendiz 8 403 DEATH RATES Santiago
- Page 424 and 425:
Appendix 9 405 nfective and parasit
- Page 426 and 427:
Appendiz 2 407 DEATH RATES Cali-COL
- Page 428 and 429:
Appendix 2 409 DEATH RATES Cartagen
- Page 430 and 431:
Appendiz, 411 DEATH RATES MedellIn-
- Page 432 and 433:
Appendix 2 413 DEATH RATES San Salv
- Page 434 and 435:
Appendix 2 415 DEATH RATES Rural
- Page 436 and 437:
Appendix 9 417 DEATH RATES Kingston
- Page 438 and 439:
1pPendix2 419 Cause 5 years Total D
- Page 440 and 441:
Appendix 8 421 DEATH RATES Rural St
- Page 442 and 443:
Appendirs 423 DEATH RATES Monterrey
- Page 444 and 445:
AppendixlB 425 DEATH RATES San Fran
- Page 446 and 447:
Appmdx 427 DEATH RATES Suburban Cou
- Page 448 and 449:
APPENDIX 4 HOME INTERVIEWS OF FAMIL
- Page 450 and 451:
Appenam a Sol APPENDIX 5 (cont.) NU
- Page 452 and 453:
-Appendix 6 433 Miguel A. Garcia Ce
- Page 454 and 455:
Appenae uO Denise Bernier Cleuza Ma
- Page 456 and 457:
REFERENCES-' American Society of Cl
- Page 458 and 459:
References, 439 rof,Differing Socio
- Page 460 and 461:
References 441 Pan American Health
- Page 462 and 463:
References 4 Verhoestuaete, L.J. an
- Page 464 and 465:
Index Accidents, 234-238 Age of mo
- Page 466 and 467:
447 Bolivia project, La Paz (cont.)
- Page 468 and 469:
Index 449 California project, Unite
- Page 470 and 471:
Index 451 Chaco Province project, A
- Page 472 and 473:
Index 453 'bile, City of Santiago (
- Page 474 and 475:
El Salvador project (cont.) Nutrit
- Page 476 and 477:
Inter American Investigation (cont.
- Page 478 and 479:
Index 459 Maternal infection, 99-10
- Page 480 and 481:
ItidI 481 Monterrey project, mexico
- Page 482 and 483:
irurcx 463 Recife project, Brazil (
- Page 484 and 485:
Index 465 Ribeirfo Pr~to, communiti
- Page 486 and 487:
Index 467 San Juan Provin,e project
- Page 488 and 489:
Index- 469 Sheehy, T. W., 149, 442