Segmentation of heterogeneous document images : an ... - Tel
Segmentation of heterogeneous document images : an ... - Tel Segmentation of heterogeneous document images : an ... - Tel
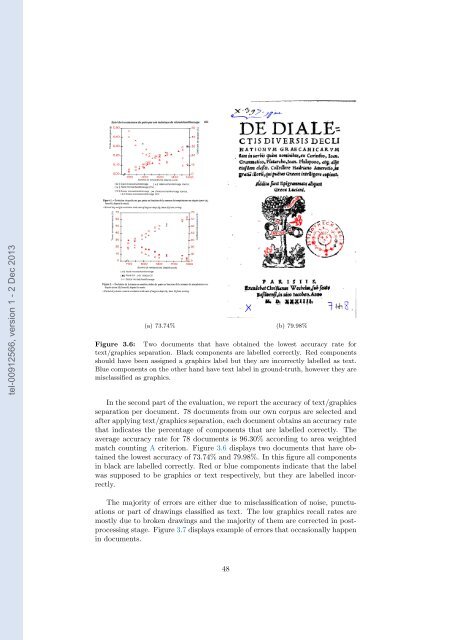
tel-00912566, version 1 - 2 Dec 2013 (a) 73.74% (b) 79.98% Figure 3.6: Two documents that have obtained the lowest accuracy rate for text/graphics separation. Black components are labelled correctly. Red components should have been assigned a graphics label but they are incorrectly labelled as text. Blue components on the other hand have text label in ground-truth, however they are misclassified as graphics. In the second part of the evaluation, we report the accuracy of text/graphics separation per document. 78 documents from our own corpus are selected and after applying text/graphics separation, each document obtains an accuracy rate that indicates the percentage of components that are labelled correctly. The average accuracy rate for 78 documents is 96.30% according to area weighted match counting A criterion. Figure 3.6 displays two documents that have obtained the lowest accuracy of 73.74% and 79.98%. In this figure all components in black are labelled correctly. Red or blue components indicate that the label was supposed to be graphics or text respectively, but they are labelled incorrectly. The majority of errors are either due to misclassification of noise, punctuations or part of drawings classified as text. The low graphics recall rates are mostly due to broken drawings and the majority of them are corrected in postprocessing stage. Figure 3.7 displays example of errors that occasionally happen in documents. 48
tel-00912566, version 1 - 2 Dec 2013 Figure 3.7: Some of the misclassified components gathered from our own documents. Black components are labelled correctly. Red components should have been assigned a graphics label but they are incorrectly labelled as text. Blue components on the other hand have text label in ground-truth, however they are misclassified as graphics. A serious challenge in some documents is a problem that arises due to underlines. Underlines that appear in the middle of a text region as shown in figure 3.7, pose two problems. These underlines are treated as graphical components and are removed from the set of text components, but in text region detection, they are utilized to separate region of text. This behavior is expected from a true graphical component, but an underline in the middle of a text region may split the region into two which is an understandable side effect in this situation. Moreover, in some situations where text characters are attached to the underline, not only the underline disappear from the text region, it takes some characters with it and leaves large gaps in the middle of a text region. This has a negative effect on our region detection stage when it happens. Here is another comparison between the results of the method , described here and the results of text and graphics separation from Tesseract-OCR and EPITA methods. The classifier for our method is trained on 26 documents, selected from both ICDAR2011 and our corpus datasets. Tables 3.4,3.5 and 3.6 show the results. In conclusion, this chapter provides a method for separating text/graphics components with good separation accuracy. 49
- Page 7 and 8: 4.3.2 Text components . . . . . . .
- Page 9 and 10: 3.6 Two documents that have obtaine
- Page 11 and 12: 6.1 PARAGRAPH DETECTION SUCCESS RAT
- Page 13 and 14: tel-00912566, version 1 - 2 Dec 201
- Page 15 and 16: detection and we conclude that the
- Page 17 and 18: tel-00912566, version 1 - 2 Dec 201
- Page 19 and 20: tel-00912566, version 1 - 2 Dec 201
- Page 21 and 22: Figure 1.8: A screen shot that show
- Page 23 and 24: Chapter 2 Related work tel-00912566
- Page 25 and 26: tel-00912566, version 1 - 2 Dec 201
- Page 27 and 28: them. In such circumstances, it wou
- Page 29 and 30: tel-00912566, version 1 - 2 Dec 201
- Page 31 and 32: [21] is another texture-based metho
- Page 33 and 34: Figure 2.4: Part of a document in o
- Page 35 and 36: • Degraded quality due to ageing
- Page 37 and 38: 2.3.2 Handwritten text line detecti
- Page 39 and 40: (a) Divided strips and their projec
- Page 41 and 42: (a) Five zones 1-5 (b) Projection p
- Page 43 and 44: would be difficult to draw a conclu
- Page 45 and 46: The proposed methods by Xiao [102],
- Page 47 and 48: tel-00912566, version 1 - 2 Dec 201
- Page 49 and 50: is assigning a label to a region of
- Page 51 and 52: fixed range. When the elongation ap
- Page 53 and 54: tel-00912566, version 1 - 2 Dec 201
- Page 55 and 56: The second method calculates the co
- Page 57: 3. Repeat for m = 1, 2, ..., M •
- Page 61 and 62: Chapter 4 Region detection tel-0091
- Page 63 and 64: The next advantage of using CRFs is
- Page 65 and 66: weights that are assigned to edge a
- Page 67 and 68: { 1 if ys = text and y f 1 (y s , y
- Page 69 and 70: (a) Document (b) Filled text compon
- Page 71 and 72: tel-00912566, version 1 - 2 Dec 201
- Page 73 and 74: tel-00912566, version 1 - 2 Dec 201
- Page 75 and 76: f = [y c = 0] × [y tl = 0] f = [y
- Page 77 and 78: (a) Ground-truth (b) y c = 0 tel-00
- Page 79 and 80: ∂l λ = ∑ ( ∑y∈Y f k (y s ,
- Page 81 and 82: incorrect [100]. Several sufficient
- Page 83 and 84: tel-00912566, version 1 - 2 Dec 201
- Page 85 and 86: tel-00912566, version 1 - 2 Dec 201
- Page 87 and 88: tel-00912566, version 1 - 2 Dec 201
- Page 89 and 90: tel-00912566, version 1 - 2 Dec 201
- Page 91 and 92: Table 4.3: TION COUNT WEIGHTED SUCC
- Page 93 and 94: tel-00912566, version 1 - 2 Dec 201
- Page 95 and 96: tel-00912566, version 1 - 2 Dec 201
- Page 97 and 98: Chapter 5 Text line detection tel-0
- Page 99 and 100: tel-00912566, version 1 - 2 Dec 201
- Page 101 and 102: tel-00912566, version 1 - 2 Dec 201
- Page 103 and 104: Having specified the model, a verti
- Page 105 and 106: • The fifth step is to remove ext
- Page 107 and 108: tel-00912566, version 1 - 2 Dec 201
tel-00912566, version 1 - 2 Dec 2013<br />
(a) 73.74% (b) 79.98%<br />
Figure 3.6: Two <strong>document</strong>s that have obtained the lowest accuracy rate for<br />
text/graphics separation. Black components are labelled correctly. Red components<br />
should have been assigned a graphics label but they are incorrectly labelled as text.<br />
Blue components on the other h<strong>an</strong>d have text label in ground-truth, however they are<br />
misclassified as graphics.<br />
In the second part <strong>of</strong> the evaluation, we report the accuracy <strong>of</strong> text/graphics<br />
separation per <strong>document</strong>. 78 <strong>document</strong>s from our own corpus are selected <strong>an</strong>d<br />
after applying text/graphics separation, each <strong>document</strong> obtains <strong>an</strong> accuracy rate<br />
that indicates the percentage <strong>of</strong> components that are labelled correctly. The<br />
average accuracy rate for 78 <strong>document</strong>s is 96.30% according to area weighted<br />
match counting A criterion. Figure 3.6 displays two <strong>document</strong>s that have obtained<br />
the lowest accuracy <strong>of</strong> 73.74% <strong>an</strong>d 79.98%. In this figure all components<br />
in black are labelled correctly. Red or blue components indicate that the label<br />
was supposed to be graphics or text respectively, but they are labelled incorrectly.<br />
The majority <strong>of</strong> errors are either due to misclassification <strong>of</strong> noise, punctuations<br />
or part <strong>of</strong> drawings classified as text. The low graphics recall rates are<br />
mostly due to broken drawings <strong>an</strong>d the majority <strong>of</strong> them are corrected in postprocessing<br />
stage. Figure 3.7 displays example <strong>of</strong> errors that occasionally happen<br />
in <strong>document</strong>s.<br />
48


