Intelligent Integration Using Cobra and SmartPeaks - Dionex
Intelligent Integration Using Cobra and SmartPeaks - Dionex
Intelligent Integration Using Cobra and SmartPeaks - Dionex

You also want an ePaper? Increase the reach of your titles
YUMPU automatically turns print PDFs into web optimized ePapers that Google loves.
<strong>Intelligent</strong> <strong>Integration</strong> <strong>Using</strong> <strong>Cobra</strong><br />
<strong>and</strong> <strong>SmartPeaks</strong><br />
Technical Note 70698<br />
1. Introduction<br />
Peak detection <strong>and</strong> integration are fundamental tasks in<br />
chromatography, most often done using a chromatography<br />
data system (CDS). Enabling software to detect <strong>and</strong><br />
integrate the peaks as desired (or as required by laboratory<br />
rules) is challenging <strong>and</strong> time-consuming. Common<br />
challenges in peak detection include:<br />
• Distinguishing peaks from noise<br />
• Correctly identifying the underlying baseline<br />
• Maintaining correct peak <strong>and</strong> baseline detection<br />
throughout a sequence of chromatograms<br />
• Correctly h<strong>and</strong>ling rider peaks <strong>and</strong> other<br />
unresolved peaks<br />
Ideally, these challenges should be addressed using<br />
detection parameters in the processing method so that<br />
the same treatment can be applied across multiple<br />
chromatograms automatically, thereby minimizing<br />
variations introduced by different operators. However,<br />
finding parameter combinations that produce the desired<br />
results has often been a tedious process, causing many<br />
chromatographers to give up <strong>and</strong> resort to manual<br />
integration, which is subjective <strong>and</strong> labor-intensive.<br />
2. Peak <strong>Integration</strong><br />
Reliable chromatographic quantification depends upon<br />
accurate <strong>and</strong> reproducible peak integration. <strong>Integration</strong><br />
of chromatographic peaks determines the area under the<br />
peak, the height of the peak <strong>and</strong> the peak’s retention time.<br />
This information is used for all subsequent calculations,<br />
such as calibration or analysis of unknowns.<br />
In simplistic terms, integration involves summing the<br />
detector output from peak start to peak end. To achieve<br />
this, integration is composed of two distinct events: it is<br />
started <strong>and</strong> then terminated. Peak start <strong>and</strong> end points<br />
define where integration commences <strong>and</strong> terminates <strong>and</strong><br />
are identified by significant changes in detector output<br />
or by the rate of change of the detector output. Defining<br />
peak boundaries however is extremely challenging.<br />
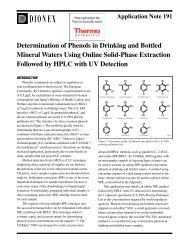
In an ideal world chromatographic peaks (Figure 1)<br />
would be perfectly symmetrical with pronounced detector<br />
signal changes that clearly identify peak start <strong>and</strong> end.<br />
Figure 1. Idyllic chromatographic peak<br />
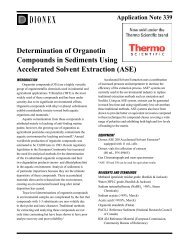
In reality, integration is extremely complex <strong>and</strong> diverse.<br />
Chromatographic data systems have to decipher many<br />
different variants <strong>and</strong> effects such as peaks of varying<br />
symmetries, overlapping peaks, valleys, varying sizes of<br />
peaks <strong>and</strong> size ratios, shallow peak rises <strong>and</strong> declines,<br />
extreme fronting or tailing, shifting apexes <strong>and</strong> valleys of<br />
unresolved peaks, baselines with large sloping background<br />
absorption <strong>and</strong> background noise, etc. (Figure 2).<br />
Figure 2. Typical chromatography
<strong>Intelligent</strong> <strong>Integration</strong> <strong>Using</strong> <strong>Cobra</strong><br />
<strong>and</strong> <strong>SmartPeaks</strong><br />
Technical Note 70698<br />
Contents<br />
1. Introduction<br />
........................................................................................................................................................................................................................ 1<br />
2. Peak <strong>Integration</strong><br />
........................................................................................................................................................................................................................ 1<br />
3. <strong>Cobra</strong> Peak Detection Algorithm<br />
........................................................................................................................................................................................................................ 4<br />
4. <strong>Cobra</strong> Wizard<br />
........................................................................................................................................................................................................................ 5<br />
5. Common <strong>Integration</strong> Issues<br />
........................................................................................................................................................................................................................ 7<br />
6. <strong>SmartPeaks</strong> <strong>Integration</strong> Assistant<br />
........................................................................................................................................................................................................................ 9<br />
7. <strong>Cobra</strong> Detection Parameters<br />
...................................................................................................................................................................................................................... 10<br />
8. Adding <strong>and</strong> Editing <strong>Cobra</strong> Detection Parameters<br />
...................................................................................................................................................................................................................... 18<br />
9. Summary<br />
...................................................................................................................................................................................................................... 20
4 3. <strong>Cobra</strong> Peak Detection Algorithm<br />
Thermo Scientific <strong>Dionex</strong> Chromeleon Chromatography<br />
Data System software version 7’s <strong>Cobra</strong> peak<br />
detection algorithm simplifies integration for all chromatographers<br />
<strong>and</strong> enables the processing of chromatograms<br />
with minimal effort providing consistent <strong>and</strong> reliable<br />
peak detection across multiple chromatograms.<br />
You can see that the difference between the pure<br />
analyte chromatogram (grey) <strong>and</strong> the chromatogram<br />
with interference (blue) is reduced. This effect is considerably<br />
enhanced in the second derivative (Figure 5).<br />
In this case, the chromatogram of the pure analyte <strong>and</strong><br />
the chromatogram with interference are almost identical.<br />
The <strong>Cobra</strong> algorithm uses advanced signal processing<br />
to distinguish true peaks from noise, <strong>and</strong> sophisticated<br />
curve-fitting techniques to accurately locate peak maxima<br />
<strong>and</strong> inflection points. It can integrate all types of chromatograms<br />
using just a few simple parameters. Values<br />
for these parameters are set quickly <strong>and</strong> easily using an<br />
intelligent wizard <strong>and</strong> the <strong>Cobra</strong> algorithm then instantly<br />
integrates every chromatogram in the sequence.<br />
A fundamental requirement of <strong>Cobra</strong> is having an optimal<br />
number of data points of the order of 10 to 40 per peak<br />
to sufficiently characterize the chromatography detection<br />
signal of a component peak. For this reason, it is not<br />
advisable to use <strong>Cobra</strong> to re-integrate data imported from<br />
Chromeleon 6 that was recorded using a data collection<br />
rate set to ‘Auto’.<br />
<strong>Cobra</strong> uses a series of algorithms to analyze the chromatogram<br />
<strong>and</strong> determine the true underlying baseline <strong>and</strong><br />
correctly identify peak starts <strong>and</strong> ends. These algorithms<br />
are only used in the integration of the chromatogram <strong>and</strong><br />
do not affect the underlying data, they are described in<br />
Section 7.1.<br />
Figure 3. Overlaid of chromatograms<br />
Figure 4. First derivative<br />
In short, <strong>Cobra</strong> uses an adaptive Savitsky-Golay smoothing<br />
function followed by transformation into a second<br />
derivative, assessing this second derivative against<br />
automatic thresholds based on signal characteristics.<br />
Since the noise is amplified when derivatives are calculated,<br />
it is important that sufficient smoothing is used<br />
to optimize the signal-to-noise ratio <strong>and</strong> ensure correct<br />
identification of peak starts <strong>and</strong> ends. <strong>Cobra</strong> adopts an<br />
adaptive Savitsky-Golay smoothing function to remove<br />
the noise without losing valuable information.<br />
<strong>Cobra</strong> uses the second derivative of a chromatographic<br />
signal as this can recognize compound peaks. Also,<br />
assessing the second derivative of a peak reduces the<br />
effects of background absorption <strong>and</strong> ensures that<br />
points of inflection <strong>and</strong> peak maxima are accurately<br />
<strong>and</strong> consistently identified wherever the background<br />
has lower curvature than the analyte peak.<br />
For example, the following two chromatograms show<br />
a peak of the same analyte, but one has a large sloping<br />
background absorption (Figure 3). The first derivative<br />
of these two signals is shown in the center (Figure 4).<br />
Figure 5. Second derivative<br />
In the second derivative of the chromatogram, noise<br />
thresholds are automatically determined (as represented<br />
by the red dashed lines in Figures 6 <strong>and</strong> 7). The local<br />
minimum below the threshold’s lower limit is the peak<br />
apex. The points of inflection or local maxima above<br />
the threshold are the peak start <strong>and</strong> end (Figure 6). The<br />
baseline is interpolated between the points where the<br />
curvature crosses the upper noise threshold limit (Figure 7).<br />
Figure 6. Local minimum <strong>and</strong><br />
maximum<br />
Figure 7. Baseline interpolation
4. <strong>Cobra</strong> Wizard<br />
The <strong>Cobra</strong> Wizard intelligently improves the analyst’s<br />
experience with minimal user input. The Wizard is<br />
provided to guide the operator in correctly assigning<br />
initial peak detection parameters to help refine the<br />
integration if required. <strong>Integration</strong> is more constructive<br />
<strong>and</strong> intuitive, <strong>and</strong> can be performed with confidence,<br />
thus eliminating trial-<strong>and</strong>-error methods <strong>and</strong> manual<br />
integration. Details on how Chromeleon CDS determines<br />
the values used for the settings of these parameters can be<br />
found in section 7.1.<br />
The <strong>Cobra</strong> Wizard assists the analyst in defining the four<br />
key parameters required by <strong>Cobra</strong>:<br />
<strong>Integration</strong> Range<br />
By default the entire chromatogram will be integrated unless<br />
the analyst specifies otherwise. Simply clicking dragging the<br />
mouse across the chromatogram will highlight the area that<br />
should be integrated (as shown in Figure 8). Three detection<br />
setting parameters are created: Inhibit On, Inhibit Off, <strong>and</strong> a<br />
second Inhibit On.<br />
Baseline Noise Range<br />
<strong>Cobra</strong> will automatically try to select a quiet, ‘peak-free’<br />
area of the chromatogram to measure the baseline noise<br />
(see Section 7.1 for more information). However the<br />
analyst may specify a different range by simply clicking<br />
<strong>and</strong> dragging to highlight the area that should be used. In<br />
most cases the default selection is acceptable (as shown in<br />
Figure 9). Two detection setting parameters are created:<br />
BLNoiseStart <strong>and</strong> BLNoiseEnd.<br />
5<br />
Figure 9. Defining baseline noise range<br />
Figure 8. Defining integration range<br />
<strong>Cobra</strong> Smoothing Width<br />
<strong>Cobra</strong> will automatically determine the width of the<br />
narrowest peak in the chromatogram <strong>and</strong> use this value to<br />
set the <strong>Cobra</strong> smoothing width (see section 7.1 for more<br />
information). However the user may specify a different<br />
value by simply selecting another peak in the chromatogram<br />
(as shown in Figure 10) or by clicking <strong>and</strong> dragging<br />
to highlight the width that should be used. In most cases<br />
the automatic selection is acceptable. One detection<br />
parameter setting is created: Smoothing.<br />
For ion chromatography an additional chromatographic<br />
problem exists in the so-called ‘water dip’ or ‘void peak’.<br />
This negative peak (related to water) may immediately<br />
precede peaks of interest <strong>and</strong> special h<strong>and</strong>ling may be<br />
required to avoid interference with these other peaks.<br />
The user can define whether to consider a void peak or<br />
not via the checkbox.<br />
Figure 10. Defining <strong>Cobra</strong> Smoothing Width
6 Minimum Area<br />
<strong>Cobra</strong> will automatically determine the area of the<br />
smallest integrated peak <strong>and</strong> set the minimum area<br />
accordingly (see section 7.1 for more information).<br />
However the operator can easily specify a different value<br />
Finally the user can decide to apply these <strong>Cobra</strong> detection<br />
parameters to all or only specified channels or injection<br />
types (Figure 12). This gives the ability to easily <strong>and</strong><br />
quickly apply different detection parameters to different<br />
detectors or injection types..<br />
by simply selecting the smallest peak in the chromatogram<br />
that should be integrated (as shown in Figure 11). In most<br />
cases the automatically determined value is acceptable.<br />
One detection parameter is added to the detection table:<br />
Minimum Area. The detection settings support more than<br />
one minimum area setting at different retention times<br />
however, the Wizard sets <strong>and</strong> supports the first one only.<br />
Figure 12. Defining Channel <strong>and</strong> Injection Type<br />
Figure 11. Defining Minimum Area<br />
<strong>Using</strong> these simple steps any analyst can quickly, easily,<br />
<strong>and</strong> confidently assign initial peak detection parameters<br />
to ensure consistent <strong>and</strong> accurate integration without<br />
going through laborious trial-<strong>and</strong>-error processes, thus<br />
eliminating the need for manual integration.
5. Common <strong>Integration</strong> issues<br />
There are some common integration issues that occur where baselines are unstable or peaks are poorly separated. For<br />
example, in Figure 13A, the data system chose to draw the baseline from the bottom of the dip before the first peak to the<br />
baseline after the peak. The problem, of course, is that the negative peak just before the peak of interest is falsely identified<br />
as true baseline. This easily corrected using the ‘Consider Void Peak’ option in the <strong>Cobra</strong> algorithm (Figure 13B).<br />
7<br />
Figure 13. A) Incorrect baselinedue to negative dip, B) Correct integration with <strong>Cobra</strong><br />
Another common integration error is shown in Figure 14A. Here the peak endpoint is mis-identified causing the<br />
baseline of the peak to be drawn incorrectly. This often occurs when the peak tails strongly, the peak is small, <strong>and</strong> the<br />
baseline drifts. When this situation exists, not only can the peak be integrated improperly, but also, the peak endpoint<br />
may vary significantly from one run to the next. The <strong>Cobra</strong> algorithm achieves consistent proper integration by<br />
automatically calculating a threshold value based on the slope of the peak baseline, as can be seen in Figure 14B.<br />
Figure 14. A) Incorrect baseline due to negative dipon tailing peak, B) Correct integration with <strong>Cobra</strong><br />
A further source of integration issues is unresolved peak groups where there are several choices for determining the<br />
location of the chromatogram’s baseline profile. The most common options for drawing the baseline between two peaks<br />
are drop perpendicular, valley to valley, tangential skim, exponential skim, <strong>and</strong> Gaussian skim (Figure 15). Each option<br />
has benefits <strong>and</strong> limitations.
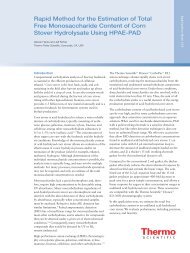
Drop Perpendicular<br />
The Drop Perpendicular method (Figure 15A) involves<br />
the addition of a vertical line from the valley between<br />
the peaks to the horizontal baseline. If the peaks are<br />
approximately the same size <strong>and</strong> there is no tailing or<br />
fronting, the calculated peak areas should be reasonably<br />
accurate.<br />
8 Several variations of the skim procedure are possible:<br />
• A tangential skim; a straight line is drawn from the valley<br />
to the end (or start) of the peak (Figure 15C). There are<br />
commonly two options: Tangential at the lower peak end<br />
or tangential at both peak ends.<br />
However, if there is significant tailing of the first peak or<br />
fronting of the second peak, the areas will be distorted,<br />
with corresponding errors in the integrated areas. Also,<br />
if the peak ratio is large, e.g. 20:1, the smaller peak will<br />
have significant excess area contributed by the major peak.<br />
In this case, the accuracy for the larger peak would be<br />
much better than for the minor peak. Finally, when the<br />
resolution between the peaks is so small that a clear valley<br />
is not present, the perpendicular drop method will grossly<br />
over-integrate the smaller ‘shoulder’ peak. In these situations,<br />
one of the other options may be more appropriate.<br />
Valley to Valley<br />
The Valley to Valley method (Figure 15B) sets start <strong>and</strong><br />
stop points at the valley between the peaks, thus integrating<br />
each peak separately. This method is not normally the best<br />
approach as it often underestimates the true peak area,<br />
however it can be used if there is a known baseline<br />
disturbance present under a set of eluted peaks or, in the<br />
case of some gradient runs, there is a small, consistent,<br />
broad rise in the baseline.<br />
Tangential or Exponential Skim<br />
The 2 skim procedures in Figure 15 (C <strong>and</strong> D) separate the<br />
second peak from the first with individual baselines. The<br />
first peak is integrated from its starting point to the<br />
apparent end of the peak group. The second peak’s baseline<br />
starts at the valley between the peaks <strong>and</strong> ends when the<br />
signal nears the baseline. The area “under” the skimmed<br />
peak is added to the first peak, not the skimmed peak. This<br />
approach has been described also as a tangent integration<br />
method <strong>and</strong> the small peak variously labeled a skim,<br />
shoulder, or rider peak.<br />
- Tangential at the lower peak end means that the line<br />
is drawn tangentially to the chromatogram at the<br />
peak start for ascending rider peaks, or at the peak<br />
end for descending rider peaks i.e. the part of the<br />
peak with the lowest signal.<br />
- Tangential at both peak ends means that both the<br />
peak start <strong>and</strong> peak end are determined such that<br />
the line is tangential to the chromatogram.<br />
• An exponential skim; an exponential function is used<br />
to create curvature in the skim line in an attempt to<br />
approximate the underlying baseline of the first peak<br />
(Figure 15D).<br />
Whichever skim is used, it is always an estimate of the<br />
peak area <strong>and</strong>, in general, consistency of integration<br />
methodology is more important than whether the skim<br />
is tangential or curved. As a rule of thumb, if the minor<br />
peak is 10% of the height of the major one, a<br />
perpendicular drop is usually best.<br />
Underst<strong>and</strong>ing all these different methods <strong>and</strong> techniques<br />
<strong>and</strong> being able to assign the correct detection parameters<br />
to achieve the desired integration are extremely difficult<br />
tasks, even for the most experienced chromatographer.<br />
Chromeleon CDS addresses these issues by providing<br />
chromatographers with the <strong>SmartPeaks</strong> <strong>Integration</strong><br />
Assistant.<br />
Figure 15. Defining Channel <strong>and</strong> Injection Type.Baseline Profiles. A) Drop Perpendicular, B) Valley to Valley,<br />
C) Tangential Skim, D) Exponential Skim
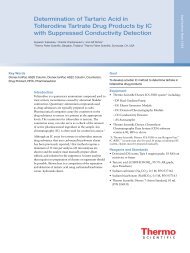
6. <strong>SmartPeaks</strong> <strong>Integration</strong> Assistant<br />
The <strong>SmartPeaks</strong> <strong>Integration</strong> Assistant provides analysts with the simplest of interfaces to integrate unresolved peak<br />
groups quickly <strong>and</strong> intuitively. The user simply activates the <strong>SmartPeaks</strong> tool <strong>and</strong> selects a region of the chromatogram.<br />
<strong>SmartPeaks</strong> then graphically displays the available integration options, such as valley-to-valley baselines or exponential<br />
skims (Figure 16).<br />
9<br />
Figure 16. <strong>SmartPeaks</strong> <strong>Integration</strong> Assistant – displays integration options<br />
The user then selects the desired option <strong>and</strong> <strong>SmartPeaks</strong> adds the corresponding parameters <strong>and</strong> values to the processing<br />
method so that the required integration is automatically applied to all chromatograms in the sequence (Figure 17).<br />
Further options (via the Advanced side bar, Figure 16) allow the user to define which parts of the chromatogram,<br />
detection channels <strong>and</strong>/or injection types these parameters will be applied to.<br />
Figure 17. <strong>SmartPeaks</strong> <strong>Integration</strong> Assistant – displays integration options<br />
This process takes just a few seconds, eliminating the trial-<strong>and</strong>-error process of adjusting integration <strong>and</strong> enabling any<br />
user to set appropriate parameters to ensure correct integration of unresolved peaks.
10<br />
7. <strong>Cobra</strong> Detection Parameters<br />
<strong>Integration</strong> is extremely complex <strong>and</strong> challenging but<br />
critical to accurate quantitative analysis. <strong>Cobra</strong> detection<br />
algorithm, <strong>Cobra</strong> Wizard, <strong>and</strong> the <strong>SmartPeaks</strong> integration<br />
assistant simplify the peak detection <strong>and</strong> integration<br />
process. However, with some complex chromatograms in<br />
may still be necessary to provide even more integration<br />
parameters to achieve correct integration. Chromeleon<br />
CDS, version 7 provides a comprehensive set of adaptable<br />
<strong>and</strong> flexible parameters to assist chromatographers in<br />
achieving their integration goals.<br />
These parameters can be classed into 4 categories:<br />
• Those that inhibit the integration of unwanted peaks<br />
• Those that influence the baseline<br />
• Those that help define the peak start <strong>and</strong> peak end<br />
• Those that influence the detection of rider peaks <strong>and</strong><br />
shoulders<br />
The detection parameters influence the integration of<br />
all chromatograms to which they apply. Each detection<br />
parameter has a default value assigned <strong>and</strong> even those<br />
that are not explicitly defined in the Processing Method<br />
are always applied to the chromatogram using this default<br />
value. Each parameter can assume new values at any time<br />
but only the value that was defined last will take effect,<br />
however, only for the duration of the chromatogram. The<br />
parameters are reset to their default values afterwards.<br />
Underst<strong>and</strong>ing the purpose <strong>and</strong> application of these<br />
parameters is essential for any chromatographer to be<br />
able to successfully apply these to a processing method<br />
to achieve the best results.<br />
7.1 <strong>Using</strong> the ‘Auto’ Setting of <strong>Cobra</strong> Parameters<br />
<strong>Cobra</strong> Smoothing Width<br />
If the user has enabled the “Auto” option, the smoothing<br />
width is dynamically set over the whole chromatogram,<br />
so that for each data point a separate width is used. The<br />
following algorithm is executed to automatically calculate<br />
an initial filter width which is then used in further<br />
calculations:<br />
• First <strong>Cobra</strong> estimates the slope for each data point by<br />
using the current signal value <strong>and</strong> subtracting the signal<br />
value of a previous data, e.g. signal value of data point<br />
4 – signal value of data point 1, etc.<br />
• Next <strong>Cobra</strong> analyzes this set of slopes <strong>and</strong> looks for<br />
maxima that are closely followed by minima. If there is<br />
a zero-crossing between the two (i.e. the maxima value<br />
is above 0 <strong>and</strong> the minima value is below 0), a point is<br />
computed that corresponds to a peak apex. This point<br />
gives an estimate of the width of the peak between its two<br />
inflection points (w) <strong>and</strong> also the height of the peak (h).<br />
• These points are then sorted according to their width (w)<br />
<strong>and</strong> a line connecting the point with the smallest width<br />
to the one with largest width is constructed as shown in<br />
Figure 18. The point with largest deviation below this<br />
line is identified (j) <strong>and</strong> all smaller points are ignored<br />
as these points are probably related to signal noise. The<br />
mean width weighted by height (h) is computed for the<br />
remaining points (shaded area Figure 18).<br />
• Finally, the filter width is computed by multiplying this<br />
mean width by a factor (the default is 1.5).<br />
This filter width is then used in 2 further steps:<br />
Resampling <strong>and</strong> smoothing.<br />
Figure 18. Selection of filter width from peak estimates<br />
Resampling<br />
The resampling has several purposes:<br />
• The removal or suppression of noise<br />
• To reduce the amount of data, speeding up further<br />
processing<br />
• To ensure equidistant data points, which is a requirement<br />
of subsequent algorithms<br />
<strong>Cobra</strong> takes the minimum time gap (step) between<br />
the existing data points <strong>and</strong> calculates a new step. A<br />
resampling factor is used to limit the number of data<br />
points considered (the default is 50):<br />
New step = original step ÷ resampling factor<br />
x maximum of either filter width/original step or 3<br />
If the original data is not equidistant or the calculated<br />
new step is larger than the original step, the chromatogram<br />
is then resampled using a cubic interpolation to<br />
compute the new signal values at the new step distance.
Smoothing<br />
The detection of the baseline <strong>and</strong> the peaks is based on<br />
the curvature of the (resampled) chromatogram, but the<br />
chromatogram may contain a significant amount noise<br />
so an additional processing step to smooth the data is<br />
required to differentiate the signal from the noise.<br />
<strong>Cobra</strong> uses a Savitzky-Golay algorithm to smooth the<br />
data. This algorithm applies a second degree polynomial<br />
to a set of data points (defined by the previously calculated<br />
filter width <strong>and</strong> (possibly new) step size) neighboring<br />
the current data point. However, using a fixed filter<br />
width has the effect that some peaks can be smoothed too<br />
much or the smoothed signal can overshoot, as shown in<br />
Figure 19. This is especially problematic for the skimming<br />
of peaks because these processes use slopes <strong>and</strong> the<br />
smoothed signal intensively. As can be seen, the skimmed<br />
baseline (red) stops prematurely because the tangent<br />
becomes parallel to the baseline at the minimum of the<br />
smoothed signal.<br />
In Figure 20, the blue curves show several smoothed<br />
signals with fixed filter widths that are blended together<br />
for the adaptive smoothed signal (red) of the chromatogram<br />
(black). The weighting for blending is shown in the<br />
small boxes for 3 different points in time of the chromatogram,<br />
the weighted mean filter width is marked as vertical<br />
blue line.<br />
11<br />
Figure 20. Overview of the adaptive smoothing process<br />
Figure 21 shows how the filter (or smoothing) width is<br />
automatically adapted to smooth the chromatogram. This<br />
is also applied to the first <strong>and</strong> second derivatives.<br />
Figure 19. Selection of filter width from peak estimatesThe original<br />
signal (black) is not reproduced by the smoothed one (gray)<br />
Reducing the filter width to avoid this problem may lead<br />
to small peaks being missed during peak detection because<br />
smaller filter widths lead to much higher noise which can<br />
hide the curvature of real peaks. The solution is therefore<br />
to detect overshooting <strong>and</strong> adapt the filter width accordingly<br />
for each data point in the chromatogram. The filter<br />
width is therefore dynamically set over the whole<br />
chromatogram, so that for the evaluation (slope <strong>and</strong><br />
curve) of each data point a separate width is used.<br />
Figure 21. Variation of the mean smoothing width (blue) across a chromatogram (black,<br />
almost hidden by the red curve of the smoothed signal). The bounds of the noise level<br />
are shown in orange<br />
In conclusion, if the user has enabled the “Auto” option,<br />
the smoothing width is dynamically set over the whole<br />
chromatogram. It is important to note that the smoothing<br />
of the chromatogram <strong>and</strong> the derivatives is only used<br />
internally during peak detection <strong>and</strong> integration. All other<br />
integration results, e.g. height or area, are always computed<br />
against the original signal.
12 Baseline Noise Range<br />
If the user selects the “Auto” option, an algorithm is used<br />
to automatically compute a suitable time range. <strong>Using</strong> the<br />
American Society for Testing <strong>and</strong> Materials (ASTM)<br />
method E 685-93, the signal noise of the chromatogram<br />
is computed multiple times in windows with a width that<br />
is a multiple of the calculated <strong>Cobra</strong> Smoothing Width<br />
(dt in Figure 22), giving a series of estimates for the level<br />
of signal noise that are contaminated with outliers for<br />
cases where a window overlaps with an actual peak.<br />
Figure 22. ASTM E 685-93 for signal to noise calculation<br />
Statistically a significant proportion of these estimates<br />
belong to the baseline, so a value with a configurable<br />
percentage or ‘rank’ (e.g. 50% for the median) can be<br />
used as a robust estimate of the level of the signal noise.<br />
This rank requires that the given percentage of the<br />
chromatogram is not covered by peaks. However, this<br />
percentage varies with the length of the chromatogram,<br />
e.g. short chromatograms have a lower percentage of<br />
peak-free time.<br />
To compensate for this, the following formula is used to<br />
compute the rank:<br />
rank = 30 x chromatogram length(min)/10.0 (min. 30, max. 100)<br />
By applying this rank to the set of signal noise estimates,<br />
<strong>Cobra</strong> can calculate a robust number for the signal noise.<br />
<strong>Cobra</strong> next uses a Ramer - Douglas - Peucker algorithm<br />
to approximate the chromatogram (Figure 23). This<br />
algorithm recursively divides the chromatogram ‘line’.<br />
Initially it includes all the data points between the first<br />
<strong>and</strong> last points (Figure 23A). It automatically marks<br />
the first <strong>and</strong> last point as ones to be kept. It then<br />
finds the point that is furthest from the line segment<br />
with the first <strong>and</strong> last points as end points (marked<br />
in green). If this point is further from the line<br />
segment than the previously calculated signal<br />
noise (blue area) then that point must be kept.<br />
The algorithm then restarts with the first point <strong>and</strong><br />
the worst point (Figure 23B). If the most deviant<br />
point is now closer than the previously calculated signal<br />
noise to the line segment, any points not currently marked<br />
as ‘kept’ between these points can be discarded (marked in<br />
red) without the approximated line being worse than the<br />
signal noise.<br />
The algorithm continues with the worst point <strong>and</strong> the last<br />
point (Figure 23C) <strong>and</strong> acts recursively until the entire<br />
chromatogram is processed (Figure 23D to G). When<br />
the recursion is complete a new chromatogram can be<br />
generated consisting of only those points that have been<br />
marked as kept (blue line Figure 23G).<br />
Finally the time range (start <strong>and</strong> finish times) of the<br />
longest segment computed by this algorithm is taken as<br />
the range for the <strong>Cobra</strong> Baseline Noise Range.<br />
Figure 23. Ramer - Douglas - Peucker algorithm
Minimum Area<br />
If the ‘Use Auto Minimum Area’ option is selected in the<br />
<strong>Cobra</strong> Wizard, the ‘Minimum Signal to Noise Ratio’<br />
parameter is used to determine the limit of detection. In<br />
this case, Chromeleon CDS calculates the threshold value<br />
for the Minimum Area by using the following formula:<br />
Minimum Signal to Noise Ratio x baseline signal noise<br />
x Minimum Width<br />
The baseline signal noise value is derived from the portion<br />
of the chromatogram specified in the <strong>Cobra</strong> Baseline<br />
Noise Range. If no Minimum Width is specified, the<br />
<strong>Cobra</strong> Smoothing Width parameter is used instead.<br />
Minimum Height<br />
If this parameter is set to ‘Auto’, the ‘Minimum Signal to<br />
Noise Ratio’ parameter is used to determine the limit of<br />
detection. In this case, Chromeleon CDS calculates the<br />
threshold value for the Minimum Height by using the<br />
following formula:<br />
Minimum Signal to Noise Ratio x baseline signal noise<br />
The baseline signal noise value is derived from the portion<br />
of the chromatogram specified in the <strong>Cobra</strong> Baseline<br />
Noise Range.<br />
7.2 Parameters for Inhibiting <strong>Integration</strong><br />
of Unwanted Peaks<br />
Detect Negative Peaks<br />
The Detect Negative Peaks parameter enables <strong>and</strong><br />
disables detection of negative peaks. When the parameter<br />
is enabled, negative as well as positive peaks are detected<br />
(Figure 24). There are 3 options for this parameter:<br />
• Off: Negative peaks are not detected (default).<br />
• On: Negative peaks are detected <strong>and</strong> the Lock Baseline<br />
parameter is automatically enabled. In the results table,<br />
the area of negative peaks is indicated as a positive<br />
value.<br />
• On Don't Label: Negative peaks are detected but the<br />
peaks are not labeled or included in the results.<br />
Detect Shoulder Peaks<br />
This parameter can be used to enable/disable shoulder<br />
peak detection. While there is no strict numerical way to<br />
describe a shoulder peak, most chromatographers would<br />
recognize that a shoulder peak is a type of rider peak<br />
where there is no valley between the major <strong>and</strong> minor<br />
peaks (i.e. the minor peak apex is below its peak start,<br />
Figure 25). There are only two options available:<br />
• On: Shoulder peaks are treated like normal peaks<br />
(default).<br />
• Off: No identification of shoulder peaks occurs.<br />
Switching shoulder detection off does not disable all<br />
rider peak detection.<br />
If a shoulder peak is detected, how the integration is<br />
(or is not) performed is determined by the settings of<br />
the various rider <strong>and</strong> minimum parameters. For more<br />
information on rider peak parameters see Section 7.5.<br />
Figure 25. Detect Shoulder Peaks. A) On, B) Off<br />
Inhibit <strong>Integration</strong><br />
The Inhibit <strong>Integration</strong> parameter is used to exclude<br />
certain chromatogram areas from integration. This can be<br />
useful to ignore areas of the chromatogram that are not of<br />
interest or contain peaks that do not require analysis, such<br />
as a large solvent peak at the start or a gradient wash at<br />
the end of an injection. There are two options available:<br />
• On: Peak detection is disabled.<br />
• Off: Peak detection is enabled (default).<br />
When set to On, peak detection will only be re-activated<br />
when the parameter is reset to Off. In the area between<br />
Inhibit <strong>Integration</strong> = On <strong>and</strong> Inhibit <strong>Integration</strong> = Off,<br />
peak detection is disabled, that is, no peaks are recognized<br />
in this area. The chromatogram is displayed on screen, but<br />
it is not integrated (Figure 26).<br />
13<br />
Figure 24. Detect negative peaks. A) Off, B) On, C) On Don't Label<br />
Figure 26. Inhibit <strong>Integration</strong>
14<br />
Minimum Area<br />
This detection parameter is used to determine the<br />
minimum area threshold below which peaks are ignored<br />
<strong>and</strong> is the most commonly used parameter for eliminating<br />
small peaks from the integrated chromatogram. It is one<br />
of the parameters used by the <strong>Cobra</strong> algorithm <strong>and</strong> the<br />
settings available are:<br />
• Auto: If auto is selected (default), Chromeleon<br />
automatically calculates a detection limit as<br />
described in section 7.1.<br />
• 0 – 1E+15: Sets an absolute threshold in <br />
x minutes (e.g. mAU*min)<br />
Minimum Relative Area<br />
Peaks are rejected if their area is below a particular<br />
threshold. The peak area is measured, on a first pass<br />
basis, relative to the sum of all peaks (total area) in<br />
the chromatogram. This parameter can be useful<br />
within a sequence where the analyte concentration can<br />
vary <strong>and</strong> the main analyte peaks area could drop below<br />
an absolute Minimum Area threshold (used to reject<br />
smaller, unwanted peaks). <strong>Using</strong> the Minimum Relative<br />
Area parameter, peaks of interest that drop below the<br />
prescribed Minimum Area value will still be detected <strong>and</strong><br />
integrated because they are greater than the Minimum<br />
Relative Area threshold of the current chromatograms<br />
total area. The settings available are:<br />
• Off: All peaks are detected (default).<br />
• 0 – 100 in percent (%).<br />
Figure 27. Minimum Area<br />
Minimum Height<br />
The Minimum Height detection parameter is used<br />
to determine the minimum height threshold below<br />
which peaks are ignored. The peak height of each peak<br />
is measured relative to its own individual baseline. For<br />
rider peaks, this means the height measurement is relative<br />
to the skim baseline <strong>and</strong> therefore the baseline type of<br />
unresolved peaks can strongly influence the height. The<br />
settings available are:<br />
• Auto: If auto is selected (default), the detection limit is<br />
calculated as described in section 7.1.<br />
• 0 – 1E+12: Sets an absolute threshold in <br />
(e.g. mAU)<br />
Figure 29. Minimum Relative Area<br />
Minimum Relative Height<br />
Peaks are rejected if their minimum relative height is<br />
below a particular threshold. The minimum height is<br />
measured relative to the highest peak in the chromatogram<br />
<strong>and</strong> the height is measured as per the Minimum<br />
Height. This parameter can be used in a similar way to<br />
Minimum Relative Area. The settings available are:<br />
• Off: All peaks are detected (default).<br />
• 0 – 100 percent (%).<br />
Figure 28. Minimum Height<br />
Figure 30. Minimum Relative Height
Minimum Signal-to-Noise Ratio<br />
This parameter sets the signal-to-noise ratio required<br />
for calculating the limit of detection <strong>and</strong> is used in the<br />
Minimum Area <strong>and</strong> Minimum Height parameters. The<br />
limit of detection is the lowest signal height that is just<br />
distinguishable from zero. The lower the Minimum Signal<br />
to Noise Ratio, the lower are the detection limits, <strong>and</strong><br />
thus, the more peaks are identified. This parameter is<br />
automatically effective if Minimum Area or Minimum<br />
Height = Auto. The settings available are:<br />
• 1 – 100: (Default = 2).<br />
7.3. Parameters that influence the baseline<br />
Baseline Point<br />
The Baseline Point detection parameter is used to set<br />
a baseline point at a specific time. Modification of the<br />
baseline may be required if integration starts too early<br />
or if the peak end is delayed. In these cases, you can force<br />
the peak to start later or to end earlier by inserting an<br />
appropriate baseline point. The settings available are:<br />
• Fixed: A fixed baseline point is added at the selected<br />
retention time (default).<br />
15<br />
Figure 31. Minimum Signal to Noise Ratio<br />
Maximum Width<br />
The Maximum Width detection parameter defines the<br />
maximum peak width in minutes <strong>and</strong> any peaks wider<br />
than this will be ignored during peak detection. The peak<br />
width is measured on the baseline. For peaks that do not<br />
reach the baseline, the width is extrapolated. The settings<br />
available are:<br />
• Off: All peaks are considered (default).<br />
• 0 -1000: Value in minutes for maximum width.<br />
Figure 32. Maximum Width<br />
Minimum Width<br />
The Minimum Width detection parameter defines<br />
the minimum width below which peaks are ignored<br />
during peak detection. The peak width is measured<br />
on the baseline. In the case of peaks that do not reach<br />
the baseline, the width is extrapolated. The settings<br />
available are:<br />
• Off: All peaks with width > 0 minutes are<br />
detected (default).<br />
• 0 – 1000 minutes.<br />
Figure 34. Baseline Point<br />
Baseline Type<br />
The Baseline Type parameter combines the functions of<br />
the Valley-to-Valley <strong>and</strong> Lock Baseline parameters. The<br />
settings available are:<br />
• Valley to Valley: Enables baseline treatment from<br />
valley-to-valley, that is, from peak minimum to peak<br />
minimum, in a series of unresolved peaks.<br />
• Drop Perpendicular: (Default) For unresolved peaks, the<br />
baseline is drawn from the start to the end of the peak<br />
group <strong>and</strong> the not pulled up to the relative minima<br />
(valleys). The baseline connects the start of the first with<br />
the end of the last unresolved peak. If one of the valleys<br />
in between is located below the baseline, the baseline is<br />
connected with this minimum to avoid cutting off a<br />
peak foot.<br />
• Lock at current level: The baseline is fixed at the current<br />
signal level <strong>and</strong> is extrapolated horizontally to the right<br />
(Figure 35A).<br />
• Lock at global minimum: Chromeleon searches to the<br />
right for the minimum absolute signal value in the<br />
chromatogram. The search is performed either to the<br />
end of the chromatogram or to the next Baseline Point<br />
(see previous parameter) <strong>and</strong> the baseline is locked<br />
horizontally at the found minimum level (Figure 35B).<br />
Figure 35. Baseline Type. A) Lock at current level, B) Lock at global minimum<br />
Figure 33. Minimum Relative Width
Minimum Baseline Box Width<br />
A crucial part of the whole peak detection process is the<br />
determination of the parts of the chromatogram that are<br />
baseline (i.e. outside of the peaks). In order to do this an<br />
additional algorithm, that is independent of the main<br />
peak detection algorithm, is used to identify which parts<br />
of the chromatogram are baseline. This additional<br />
algorithm calculates a threshold on the second derivative<br />
of the chromatogram to select regions with low absolute<br />
curvature. To avoid spurious detections, only regions with<br />
a width above the threshold that is set by the "Minimum<br />
Baseline Box Width" parameter are used. Setting the<br />
parameter to Off turns off the peak-independent detection<br />
of baseline segments. As shown in Figure 36, the start<br />
<strong>and</strong> end points of the baseline detected in this way are<br />
used to construct the line segments of the baseline under<br />
each peak.<br />
16 7.4. Parameters for Defining the Peak Start<br />
<strong>and</strong> Peak End<br />
Peak Group Start/Peak Group End<br />
The Peak Group Start <strong>and</strong> Peak Group End detection<br />
parameters are used to identify several successive peaks<br />
as one peak group. The peak group is then treated as<br />
one single peak. Within the group, any other detection<br />
parameters, for example for detecting rider peaks, do not<br />
apply. The peak maximum of the largest peak becomes<br />
the peak maximum of the entire group. Chromeleon CDS<br />
displays only one name <strong>and</strong> number in the chromatogram<br />
<strong>and</strong> component table. Results, for example, area value <strong>and</strong><br />
peak height, are calculated for the entire group.<br />
The settings available are:<br />
• Off (default).<br />
• 0 – 1000 minutes.<br />
The Peak Group Start parameter marks the beginning of a<br />
peak group, while the Peak Group End parameter marks<br />
the end of the group. The settings available are:<br />
• Auto: The baseline of the peak group is drawn from<br />
the peak start of the first peak to the peak end of the<br />
last peak (Figure 38A). The peak delimiters <strong>and</strong> the<br />
level of the baseline are determined by the peak<br />
detection algorithm.<br />
• Fixed: The baseline is drawn from the signal value at<br />
the retention time of the Peak Group Start to the signal<br />
value at the retention time of the Peak Group End<br />
(Figure 38B).<br />
Figure 38 . Peak Group Start/End. A) Auto. B) Fixed<br />
Figure 36. Detection of baseline segments (blue regions – 2 nd derivative) <strong>and</strong><br />
filling the gaps between by linear segments (red, solid lines – chromatogram)<br />
Snap Baseline<br />
When set to On, the baseline is automatically ‘pulled up’<br />
to connect the start <strong>and</strong> end points of the selected peak<br />
when a neighboring peak is no longer integrated. As can<br />
be seen in Figure 37A, the first peak is not integrated <strong>and</strong><br />
the baseline of second peak is connected (or snapped) to<br />
the peak start. With the parameter set to off (Figure 37B),<br />
the original baseline is maintained. The settings available<br />
are:<br />
• On: Baseline is snapped to peak start (default).<br />
• Off: Baseline is maintained at original level.<br />
Fronting/Tailing Sensitivity Factor<br />
The Fronting Sensitivity Factor <strong>and</strong> Tailing Sensitivity<br />
Factor are implicit thresholds for setting the peak start<br />
<strong>and</strong> end, respectively. If the peak start is set too early or<br />
the peak end is too late (usually seen in the case of peaks<br />
with significant fronting or tailing), these parameters can<br />
be set to modify the sensitivity for detecting peak start<br />
<strong>and</strong>/or end.<br />
The larger the value of the Fronting/Tailing Sensitivity<br />
Factor, the closer the peak start/end will be to the peak<br />
apex. The settings available are:<br />
• Off: The peak start <strong>and</strong> end are detected automatically<br />
(default).<br />
• 1 - 100: A value of 1 is often an appropriate starting<br />
point for finding the best Fronting/Tailing Sensitivity<br />
Factor.<br />
Figure 37. Snap baseline. A) On. B) Off<br />
Figure 39. A) Fronting Sensitivity Factor. B) Tailing Sensitivity Factor
7.5. Parameters that Influence Detection of Rider<br />
Peaks <strong>and</strong> Shoulders<br />
Maximum Rider Ratio<br />
If one or more peaks (h1 to h4, Figure 40) are above<br />
the Minimum Rider Ratio (see below) in a series of<br />
unresolved peaks, the Maximum Rider Ratio detection<br />
parameter is used to determine whether a peak is to be<br />
classified as main peak or rider peak.<br />
The height of the peak to classify (e.g. h2) is compared<br />
to the height of the tallest peak in the series (i.e. b in<br />
Figure 40). If this ratio produces a value larger than the<br />
maximum rider ratio, the peak is a main peak. If the ratio<br />
produces a value smaller, the peak is a rider peak. Starting<br />
with the largest peak in the series, all adjacent peaks are<br />
then classified.<br />
The settings available are:<br />
• 0 - 100 percent (%). (Default = 20).<br />
Figure 40 . Maximum Rider Ratio<br />
Rider Detection<br />
This parameter simply enables or disables rider detection.<br />
The settings available are:<br />
• On: All riders are detected that match the Minimum/<br />
Maximum Rider Ratio parameters (default).<br />
• Off: Disables rider detection <strong>and</strong> identifies all peaks as<br />
main peaks.<br />
• Front Only: Only riders at the leading edge of a peak<br />
are identified.<br />
• Tail Only: Only riders at the tailing edge of a peak are<br />
identified.<br />
Rider Skimming<br />
The Rider Skimming parameter determines how rider<br />
peaks are skimmed. The settings available are:<br />
• Tangential at lower peak end: Depending on whether<br />
the peak is ascending or descending, either the peak<br />
start or end is defined such that rider skimming is<br />
tangential to the chromatogram.<br />
• Tangential at both peak ends: Peak start <strong>and</strong> peak end<br />
are determined such that rider skimming is tangential at<br />
both chromatogram ends.<br />
• Exponential: The chromatogram is approximated by an<br />
exponential function. In most cases, Exponential maps<br />
the actual course of the curve very accurately <strong>and</strong> the<br />
rider peak will usually receive a more realistic area.<br />
17<br />
Minimum Rider Ratio<br />
The ratio between the heights of the single peaks (h1 to<br />
h5 in Figure 41) <strong>and</strong> the height of the largest peak (b in<br />
Figure 41) determines whether a peak is classified as rider<br />
peak or main peak. If the result of the height ratio is<br />
below the defined Minimum Rider Ratio, the peak is<br />
defined as a main peak. In Figure 41, this is the case for<br />
only the h5 peak. If the result of the height ratio is above<br />
the defined minimum ratio, the Maximum Rider Ratio<br />
parameter is calculated <strong>and</strong> the resulting value is used to<br />
classify the remaining peaks as rider peaks or main peaks<br />
The settings available are:<br />
• 0 - 100 percent (%). (Default = 10).<br />
Figure 42. A) Tangential at lower peak end, B) Tangential at both peak ends, C) Exponential<br />
Figure 41 . Minimum Rider Ratio
18 8. Adding <strong>and</strong> Editing <strong>Cobra</strong> Detection<br />
Parameters<br />
<strong>Cobra</strong> detection parameters are used to determine how<br />
chromatograms are integrated, for example, in which<br />
areas peaks are suppressed or how peak starts <strong>and</strong> peak<br />
ends are detected. Thus, the integration can be adapted as<br />
required by the analyst to virtually eliminate the need for<br />
manual re-integration effort for individual<br />
chromatograms.<br />
Chromeleon CDS automatically determines <strong>and</strong> integrates<br />
peak areas, based on the <strong>Cobra</strong> detection parameters<br />
defined in the processing method. However, adding or<br />
editing parameters in the processing method can present<br />
chromatographers with some challenges:<br />
• How to ensure parameters are added at the correct<br />
retention time (e.g. between two peaks)?<br />
• How to see the effects on the chromatogram of adding<br />
or changing a parameter?<br />
• How to determine a sensible value for the parameter<br />
rapidly <strong>and</strong> effortlessly?<br />
8.1. Adding Detection Parameters<br />
Detection parameters can be added through direct<br />
graphical interaction with the chromatogram. This<br />
significantly facilitates the procedure for defining<br />
detection parameters.<br />
In order to add detection parameters directly in the<br />
chromatogram, the analyst simply selects the ‘Insert’<br />
option in the Detection Parameters group of the<br />
Processing ribbon (Figure 43A). The most commonly used<br />
parameters are then directly available in a drop down<br />
menu (Figure 43B). The analyst selects the parameter to<br />
be inserted <strong>and</strong> the mouse pointer changes its appearance<br />
to look as follows:<br />
The analyst then moves the pointer exactly to the location<br />
where the parameter is required <strong>and</strong> clicks in the chromatogram<br />
(Figure 43C). The defined parameter is directly<br />
added to the processing method <strong>and</strong> is also displayed as a<br />
flag in the chromatogram at the selected retention time.<br />
Dynamic data linking ensures that this new parameter is<br />
instantly applied to all chromatograms in the sequence.<br />
Chromeleon provides a simple <strong>and</strong> intuitive interface to<br />
aid the analyst in adding <strong>and</strong> editing detection parameters<br />
directly in the chromatogram. This ensures the adding,<br />
positioning, <strong>and</strong> editing of parameters can be achieved<br />
with minimal effort <strong>and</strong> delay.<br />
Figure 43. A) Insert option on the Processing ribbon, B) List of parameters, C) Click to insert
An alternative method to add detection parameters directly in the chromatogram would be for the analyst to simply<br />
move the mouse pointer to the location where the parameter is to be inserted <strong>and</strong> click the right mouse button. A popup<br />
menu then offers the option to insert a detection parameter (Figure 44A). On selection of this option, the analyst has<br />
immediate access to all available detection parameters <strong>and</strong> can specify the required settings (Figure 44B). Again, the<br />
defined parameter is directly added to the processing method <strong>and</strong> is also displayed as a flag in the chromatogram at the<br />
selected retention time (Figure 44C).<br />
19<br />
Figure 44. A) Right click to insert a detection parameter, B) Define parameter, C) Parameter applied<br />
By using the right mouse button <strong>and</strong> dragging a box over an area of the chromatogram it is possible to add other<br />
detection parameters. For example, setting the baseline noise range is as simple as dragging a box over an area of<br />
baseline (Figure 45A) <strong>and</strong> selecting the relevant parameter (Figure 45B) in order to add the parameters (Figure 45C).<br />
Figure 45. A) Select region, B) Select parameter, C) Parameters are inserted<br />
If after adding parameters the result is not as expected, the settings can simply be removed using the undo button on the<br />
quick access toolbar:<br />
This allows the operator to sequentially step back through all changes made.
20 8.2. Editing Detection Parameters<br />
Editing of existing detection parameters can be performed<br />
directly in the chromatogram, that is, modification of<br />
parameter values or moving a parameter to a different<br />
location in the chromatogram are possible.<br />
Editing Parameter Values<br />
To edit an existing parameter, the analyst simply doubleclicks<br />
the flag of the required detection parameter (Figure<br />
46A <strong>and</strong> B). As the parameter value in the flag is changed,<br />
Chromeleon CDS instantly updates the chromatogram<br />
view to visualize the effect that the changing value would<br />
have (Figure 46C) without the user needing to commit this<br />
change, allowing the analyst to quickly find the correct<br />
value to achieve the desired integration <strong>and</strong> simultaneously<br />
avoiding unnecessary versions of the processing<br />
method. Pressing the Escape key will discard any changes<br />
while, to commit the new value, the analyst simply hits<br />
Enter or clicks away from the flag (Figure 46D).<br />
Editing Parameter Locations<br />
In order to change the retention time of a particular<br />
parameter, it is simply a case of moving the mouse over<br />
the dotted line of the flag, <strong>and</strong> the mouse pointer changes<br />
its appearance to look as follows:<br />
Then just click <strong>and</strong> drag the parameter to a new retention<br />
time (Figure 48). Chromeleon updates the retention time<br />
in the processing method <strong>and</strong> instantly shows the revised<br />
chromatogram.<br />
Figure 48. Moving a single parameter<br />
If there are several parameters at the same retention time,<br />
it is possible to move either all or individual parameters.<br />
To move all the parameters together use the procedure<br />
described above to select the dotted line <strong>and</strong> drag to the<br />
required retention time (Figure 49).<br />
Figure 46. A) Detection parameter flag, B) Double-click to edit, C) Instant update before commit,<br />
D) New value committed<br />
For some parameters there are fixed options for the value<br />
that can be accessed by clicking the arrow of the flag<br />
(which can be seen in Figure 46B) <strong>and</strong> selecting a parameter<br />
value from the dropdown list (Figure 47).<br />
Figure 49. Moving a group of parameters<br />
To move only one flag from the group, move the mouse<br />
over the required flag until it changes color, then simply<br />
click <strong>and</strong> drag to reposition the parameter (Figure 50).<br />
Figure 47. Dropdown list in flag<br />
Figure 50. Moving one parameter from a group
9. Summary<br />
The powerful <strong>and</strong> intelligent peak detection <strong>and</strong><br />
integration features of Chromeleon CDS address the<br />
common challenges in peak detection:<br />
• The <strong>Cobra</strong> algorithm successfully distinguishes peaks<br />
from noise <strong>and</strong> correctly identifies the underlying<br />
baseline.<br />
• The <strong>Cobra</strong> Wizard guides the operator through<br />
correctly assigning initial peak detection parameters.<br />
• The <strong>SmartPeaks</strong> <strong>Integration</strong> Assistant aids <strong>and</strong> guides<br />
the chromatographer through correctly h<strong>and</strong>ling rider<br />
peaks <strong>and</strong> other unresolved peaks.<br />
• <strong>Using</strong> simple in-chromatogram editing tools, any<br />
chromatographer can easily, intuitively, <strong>and</strong> quickly<br />
insert new <strong>and</strong> modify existing parameters<br />
Technical Note 70698<br />
All of these integration tasks can be performed without<br />
the chromatographer needing to open the processing<br />
method - although the parameters are added to the<br />
processing method, thereby maintaining correct peak<br />
<strong>and</strong> baseline detection throughout a sequence of<br />
chromatograms <strong>and</strong> minimizing variations introduced by<br />
different operators <strong>and</strong> manual integration manipulations.<br />
<strong>Using</strong> Chromeleon CDS, laboratories gain a significant<br />
boost in overall efficiency <strong>and</strong> productivity.<br />
www.thermoscientific.com/chromeleon<br />
©2013 Thermo Fisher Scientific Inc. All rights reserved. ISO is a trademark of the International St<strong>and</strong>ards Organization.<br />
All other trademarks are the property of Thermo Fisher Scientific Inc. <strong>and</strong> its subsidiaries. This information is presented as<br />
an example of the capabilities of Thermo Fisher Scientific Inc. products. It is not intended to encourage use of these products<br />
in any manners that might infringe the intellectual property rights of others. Specifications, terms <strong>and</strong> pricing are subject to<br />
change. Not all products are available in all countries. Please consult your local sales representative for details.<br />
Thermo Fisher Scientific, Sunnyvale, CA<br />
USA is ISO 9001:2008 Certified.<br />
Australia +61 3 9757 4486<br />
Austria +43 1 333 50 34 0<br />
Belgium +32 53 73 42 41<br />
Brazil +55 11 3731 5140<br />
China +852 2428 3282<br />
Denmark +45 70 23 62 60<br />
France +33 1 60 92 48 00<br />
Germany +49 6126 991 0<br />
India +91 22 6742 9494<br />
Italy +39 02 51 62 1267<br />
Japan +81 6 6885 1213<br />
Korea +82 2 3420 8600<br />
Netherl<strong>and</strong>s +31 76 579 55 55<br />
Singapore +65 6289 1190<br />
Sweden +46 8 473 3380<br />
Switzerl<strong>and</strong> +41 62 205 9966<br />
Taiwan +886 2 8751 6655<br />
UK/Irel<strong>and</strong> +44 1442 233555<br />
USA <strong>and</strong> Canada +847 295 7500<br />
TN70698_E 06/13S