Oxidation of Sputtered Thin Films of Molybdenum Alloys at Ambient ...
Oxidation of Sputtered Thin Films of Molybdenum Alloys at Ambient ...
Oxidation of Sputtered Thin Films of Molybdenum Alloys at Ambient ...

You also want an ePaper? Increase the reach of your titles
YUMPU automatically turns print PDFs into web optimized ePapers that Google loves.
List, Mitterer, Mori et al. 17th Plansee Seminar 2009, Vol. 1 RM 12/1<br />
<strong>Oxid<strong>at</strong>ion</strong> <strong>of</strong> <strong>Sputtered</strong> <strong>Thin</strong> <strong>Films</strong> <strong>of</strong> <strong>Molybdenum</strong> <strong>Alloys</strong> <strong>at</strong> <strong>Ambient</strong><br />
Abstract<br />
Conditions<br />
A. List* ,<br />
**, C. Mitterer*, G. Mori**, J. Winkler***, N. Reinfried*** and<br />
W. Knabl***<br />
* Department <strong>of</strong> Physical Metallurgy and M<strong>at</strong>erials Testing, Montanuniversität, Leoben, Austria<br />
** Department <strong>of</strong> General, Analytical and Physical Chemistry, Montanuniversität, Leoben, Austria<br />
*** PLANSEE Metall GmbH, Reutte, Austria<br />
Room temper<strong>at</strong>ure oxid<strong>at</strong>ion <strong>of</strong> Mo in the presence <strong>of</strong> humidity may deterior<strong>at</strong>e its properties in thin film<br />
applic<strong>at</strong>ions like thin film transistor liquid crystal displays or photovoltaic cells. To improve their oxid<strong>at</strong>ion<br />
resistance, Mo films <strong>of</strong> 200 nm thickness, alloyed with the elements Ti, Cr, Ni, Nb, Ta, or W, respectively,<br />
have been grown by magnetron co-sputtering from Mo mosaic targets with the respective alloying<br />
element inserts. All co<strong>at</strong>ings show single-phase solid solutions. The respective alloying content is<br />
determined by the number <strong>of</strong> target inserts, their respective sputter yield and the sc<strong>at</strong>tering probability<br />
during transport from the target to the substr<strong>at</strong>e, and could be confirmed by SRIM calcul<strong>at</strong>ions. Electrical<br />
resistivity values are comparable to those <strong>of</strong> unalloyed Mo. Corrosion properties have been determined<br />
in 85 % humidity <strong>at</strong> 85°C by use <strong>of</strong> exposure tests in a clim<strong>at</strong>ic chamber. Potentiodynamic and<br />
electrochemical impedance spectroscopy were additionally done in 0.9 % NaCl aqueous solution <strong>at</strong><br />
room temper<strong>at</strong>ure. Cr was identified as the alloying element resulting in the highest corrosion resistance<br />
due to form<strong>at</strong>ion <strong>of</strong> a passive layer.<br />
Keywords<br />
Molybenum films, alloying, sputtering, oxid<strong>at</strong>ion, corrosion<br />
Introduction<br />
<strong>Molybdenum</strong> thin films are widely used for photovoltaic cells and thin film transistor liquid crystal displays<br />
(TFT-LCD) due to their rel<strong>at</strong>ively low electrical resistance and easy chemical p<strong>at</strong>terning. It has been<br />
frequently observed th<strong>at</strong> their storage in moist air leads to superficial oxid<strong>at</strong>ion <strong>of</strong> Mo. Although its<br />
oxid<strong>at</strong>ion behavior has been intensively investig<strong>at</strong>ed <strong>at</strong> high temper<strong>at</strong>ures [1], little has been reported<br />
about the oxid<strong>at</strong>ion <strong>of</strong> Mo in air <strong>at</strong> room temper<strong>at</strong>ure. For high-purity bulk Mo, the most decisive<br />
parameter for oxid<strong>at</strong>ion <strong>at</strong> a temper<strong>at</strong>ure <strong>of</strong> 40°C and rel<strong>at</strong>ive humidity <strong>of</strong> 98 % seems to be the pretre<strong>at</strong>ment<br />
and the surface roughness, where oxide layers with a thickness <strong>of</strong> 15-20 nm are formed after<br />
168 hours <strong>of</strong> exposure [2]. These intensively colored oxide films cause optical irrit<strong>at</strong>ion and reduce the<br />
electrical conductivity, thus limiting the applic<strong>at</strong>ion <strong>of</strong> Mo films in TFT-LCDs.
RM 12/2 17th Plansee Seminar 2009, Vol. 1 List, Mitterer, Mori et al.<br />
Consequently, several studies have been done to improve the low-temper<strong>at</strong>ure oxid<strong>at</strong>ion and corrosion<br />
properties <strong>of</strong> Mo films. Park et al. report on spontaneous passiv<strong>at</strong>ion <strong>of</strong> sputtered Mo-Ti alloy films in 12<br />
M HCl, where corrosion r<strong>at</strong>es lower than those <strong>of</strong> the pure components have been observed for the<br />
range between 20 and 60 <strong>at</strong>.-% Ti [3]. Also Tomachuk et al. mention a superior corrosion behavior <strong>of</strong><br />
Mo-Ti films compared to Mo-Nb [4].<br />
The aim <strong>of</strong> this study was to evalu<strong>at</strong>e the effect <strong>of</strong> low contents <strong>of</strong> the alloying elements Ti, Cr, Ni, Nb,<br />
Ta, or W, respectively, in sputter deposited Mo films on their oxid<strong>at</strong>ion and corrosion resistance. In<br />
pursuit <strong>of</strong> this goal, rel<strong>at</strong>ions between thin film synthesis conditions, resulting film structure and<br />
composition have been established. Electrical, oxid<strong>at</strong>ion and corrosion properties have been determined<br />
by a four-point method, by exposure in a clim<strong>at</strong>ic test chamber and by potentiodynamic polariz<strong>at</strong>ion<br />
experiments and electrochemical impedance spectroscopy in 0.9 % NaCl aqueous solution.<br />
Experimental details<br />
Mo thin films have been grown in a labor<strong>at</strong>ory-scale unbalanced magnetron sputtering system described<br />
in detail in ref. [5]. A Mo target with a purity <strong>of</strong> ≥ 99.97 wt.-% and 152 mm diameter, mounted to an<br />
unbalanced Gencoa PP150 magnetron, has been used. For depositing alloyed films, 24 inserts <strong>of</strong> 5 mm<br />
diameter <strong>of</strong> the elements Ti, Cr, Ni, Nb, Ta, or W, respectively, have been placed in blind holes evenly<br />
distributed over the erosion track <strong>of</strong> the Mo “mosaic” target. The target-to-substr<strong>at</strong>e distance was 7.5 cm.<br />
As substr<strong>at</strong>es, alkaline earth boro-aluminosilic<strong>at</strong>e glass sheets for display technologies (Corning<br />
EAGLE2000TM AMLCD) <strong>of</strong> dimension 50.8 × 50.8 × 0.7 mm have been used, which have been cleaned<br />
before deposition using a commercial detergent from Borer Chemistry for glass cleaning. For thin film<br />
deposition, the sputtering power was 1 kW and the Ar pressure 0.3 Pa. The substr<strong>at</strong>e temper<strong>at</strong>ure was<br />
set to 120°C, and a bias voltage <strong>of</strong> -50 V was applied to the substr<strong>at</strong>es. After pre-sputtering <strong>of</strong> the target<br />
for 10 min and substr<strong>at</strong>e ion etching for 5 min <strong>at</strong> -1250 V, films with thicknesses <strong>of</strong> ~2.5 µm (deposition<br />
time, 20 min) and ~200 nm (deposition time, 100 sec) were grown. The thicker films have been used for<br />
determining the chemical composition and the growth r<strong>at</strong>e, while structural investig<strong>at</strong>ions as well as<br />
characteriz<strong>at</strong>ion <strong>of</strong> electrical, corrosion and oxid<strong>at</strong>ion properties has been done on the thinner films.<br />
The film thickness was characterized using scanning electron microscopy (SEM, Zeiss EVO-50) on<br />
fractured cross-sections and 3D optical pr<strong>of</strong>ilometry (Wyko NT1000) on the steps <strong>of</strong> partly masked and<br />
thus unco<strong>at</strong>ed substr<strong>at</strong>e areas. The chemical composition was determined using energy-dispersive Xray<br />
spectroscopy (EDS, Oxford Instruments INCA) <strong>at</strong>tached to the SEM. The efficiency <strong>of</strong> sputtering <strong>at</strong><br />
the target was simul<strong>at</strong>ed using the SRIM code (The Stopping and Range <strong>of</strong> Ions in M<strong>at</strong>ter, version<br />
2008.05 [6]). For estim<strong>at</strong>ion <strong>of</strong> thermaliz<strong>at</strong>ion behavior <strong>of</strong> energetic species sputtered from the target, the<br />
sc<strong>at</strong>tering characteristics during the transport phase from the target to the substr<strong>at</strong>e was characterized<br />
by the energy transfer coefficient ε [7]<br />
4⋅<br />
m ⋅m<br />
=<br />
( ) 2<br />
1 2<br />
ε (1)<br />
m1<br />
+ m2<br />
There, m1 is the mass <strong>of</strong> <strong>at</strong>oms sputtered from the target and m2 is the mass <strong>of</strong> Ar. X-ray diffraction<br />
(XRD) was done using a Bruker-AXS D8 Advance diffractometer with Cu Kα radi<strong>at</strong>ion in Bragg-Brentano<br />
geometry. The macro-strain in the films was calcul<strong>at</strong>ed via the XRD peak shift, while the micro-strain<br />
was estim<strong>at</strong>ed via peak broadening using a Pseudo-Voigt function. The film resistivity was measured by<br />
a four-point probe method using a MDC Multiheight Probe.<br />
The oxid<strong>at</strong>ion and corrosion properties <strong>of</strong> the films were evalu<strong>at</strong>ed by three different tests. Exposure<br />
tests were done in a clim<strong>at</strong>ic test chamber <strong>at</strong> 85 % humidity <strong>at</strong> 85°C for 168 h (1 week). Potentiodynamic<br />
and electrochemical impedance spectroscopy were additionally done in 0.9 % NaCl aqueous solution <strong>at</strong><br />
room temper<strong>at</strong>ure. As reference electrode, a s<strong>at</strong>ur<strong>at</strong>ed calomel electrode (SCE) <strong>at</strong> a potential <strong>of</strong> 241<br />
mVSHE<br />
(standard hydrogen electrode) was used. The starting potential was 100 mV lower than the open
List, Mitterer, Mori et al. 17th Plansee Seminar 2009, Vol. 1 RM 12/3<br />
circuit potential (OCP). The scan r<strong>at</strong>e was 600 mV/h and the reverse potential was 200 mVSCE.<br />
Electrochemical impedance spectroscopy was done by applic<strong>at</strong>ion <strong>of</strong> a tube cell onto the specimens<br />
surface. Measurements were done <strong>at</strong> OCP after 0, 4 and 24 h <strong>of</strong> immersion with an altern<strong>at</strong>ing voltage <strong>of</strong><br />
±10 mV in a frequency range between 1 mHz and 500 kHz. After exposure in the clim<strong>at</strong>ic test chamber,<br />
the corroded film surfaces were characterized using a Jobin-Yvon LabRam confocal Raman<br />
spectrometer (Nd–YAG laser; wavelength, 532.2 nm; power, 10 mW).<br />
Results and discussion<br />
The film growth r<strong>at</strong>e was calcul<strong>at</strong>ed from film thickness measurements and the corresponding deposition<br />
time to ~2.1 nm/sec, and was not significantly affected by the alloying elements. The alloying content as<br />
determined by EDS was in the range between 3.2 and 5.2 <strong>at</strong>.-% (see Table I). The observed differences<br />
between the used alloying elements can be explained by their different sputter yields and sc<strong>at</strong>tering<br />
characteristics. SRIM calcul<strong>at</strong>ions <strong>of</strong> the sputter yield gave a low value for Ti, which means th<strong>at</strong> these<br />
inserts are less efficiently sputtered than Mo. Thus, for the Mo-Ti system the flux <strong>of</strong> sputtered species<br />
leaving the mosaic target shows a lower alloying element concentr<strong>at</strong>ion as compared to the target<br />
composition in the erosion track. In addition, Ti shows a high energy transfer coefficient, due to its <strong>at</strong>omic<br />
mass comparable to Ar, indic<strong>at</strong>ing quick thermaliz<strong>at</strong>ion <strong>of</strong> sputtered Ti <strong>at</strong>oms, thus explaining the<br />
rel<strong>at</strong>ively low alloying content <strong>of</strong> the film (see Table I). On the other hand, Cr with the highest sputter<br />
yield observed as well as Ta and W with also rel<strong>at</strong>ively high yields, high energies per sputtered <strong>at</strong>om and<br />
low energy transfer coefficients show significantly higher alloying concentr<strong>at</strong>ions. The concentr<strong>at</strong>ion<br />
observed for Ni is rel<strong>at</strong>ively low, which might be due to its ferromagnetic n<strong>at</strong>ure providing a short-circuit<br />
for the magnetic field lines <strong>of</strong> the magnetron. The reasons for the high Nb alloying content are presently<br />
unclear, and it has to be mentioned th<strong>at</strong> the Mo and Nb peaks overlap in EDS, giving rise to a higher<br />
uncertainty in determining the Nb content. It has also to be noted th<strong>at</strong> we did not consider the likely<br />
different condens<strong>at</strong>ion behavior <strong>of</strong> the individual <strong>at</strong>oms <strong>at</strong> the substr<strong>at</strong>e, due to lacking liter<strong>at</strong>ure d<strong>at</strong>a.<br />
Table I: Summary <strong>of</strong> investig<strong>at</strong>ed Mo alloy film systems with their respective alloying content, <strong>at</strong>omic mass, sputter yield,<br />
energy per sputtered <strong>at</strong>om and energy transfer coefficient.<br />
Alloying<br />
element<br />
Alloying<br />
content<br />
[<strong>at</strong>.-%]<br />
Atomic mass Sputter yield Energy per<br />
sputtered <strong>at</strong>om<br />
[eV]<br />
Energy<br />
transfer<br />
coefficient<br />
Mo 100 96 1.11 34.3 0.83<br />
Ti 3.4 ± 0.2 48 0.64 28.1 0.99<br />
Cr 4.7 ± 0.7 52 1.43 18.3 0.98<br />
Ni 3.2 ± 0.1 59 1.97 21.0 0.96<br />
Nb 5.2 ± 1 93 0.77 40.9 0.84<br />
Ta 3.8 ± 0.5 181 0.96 29.7 0.59<br />
W 4.0 ± 0.1 184 1.04 31.8 0.59<br />
All co<strong>at</strong>ings deposited show well-defined peaks <strong>of</strong> the Mo phase in the XRD p<strong>at</strong>terns, indic<strong>at</strong>ing the<br />
form<strong>at</strong>ion <strong>of</strong> a single-phase Mo-based solid solution for all alloying elements. This is <strong>at</strong>tributed to the film<br />
growth conditions in magnetron sputtering, which are far away from thermodynamic equilibrium [8] and<br />
allow form<strong>at</strong>ion <strong>of</strong> supers<strong>at</strong>ur<strong>at</strong>ed solid solutions. No significant effect <strong>of</strong> the alloying elements on the<br />
grain size <strong>of</strong> the Mo-based solid solution was observed (see Table II).
RM 12/4 17th Plansee Seminar 2009, Vol. 1 List, Mitterer, Mori et al.<br />
Nevertheless, a more detailed analysis <strong>of</strong> the XRD peaks indic<strong>at</strong>ed slight changes, as summarized in<br />
Table II. For Cr, Ni and W, representing smaller or similar-sized <strong>at</strong>oms as Mo, macro-strains which are<br />
lower than those <strong>of</strong> unalloyed Mo films are observed, whereas for the larger Nb and Ta <strong>at</strong>oms higher<br />
macro-strains have been obtained. Similar arguments hold for the micro-strain induced by the elements<br />
Cr, Nb and Ta. While these simple interpret<strong>at</strong>ions are well suited to explain the strain gener<strong>at</strong>ed by<br />
alloying <strong>of</strong> Mo films with most <strong>of</strong> the elements used in this study, Ti does not seem to follow this trend.<br />
However, it has to be admitted th<strong>at</strong> in explaining solid solutions not only the effect <strong>of</strong> l<strong>at</strong>tice distortion has<br />
to be taken into account, but also the change in elastic properties and the chemical interaction between<br />
the individual <strong>at</strong>oms.<br />
Table II also shows the electrical resistivity <strong>of</strong> the films as determined by the four-point probe. The<br />
resistivity <strong>of</strong> the unalloyed Mo film agrees well to liter<strong>at</strong>ure d<strong>at</strong>a [9,10,11]. While alloying with Ti, Cr, Nb,<br />
Ta, and W does not affect the values significantly, the addition <strong>of</strong> Ni results in a three times higher<br />
resistivity.<br />
Table II: Summary <strong>of</strong> investig<strong>at</strong>ed alloying systems with the <strong>at</strong>omic radius <strong>of</strong> the respective alloying element, the film grain size,<br />
the diffraction angle 2 θ <strong>of</strong> the (110) XRD peak, the determined l<strong>at</strong>tice spacing, the macro-strain calcul<strong>at</strong>ed from the<br />
XRD peak shift <strong>of</strong> the (110) peak, the micro-strain calcul<strong>at</strong>ed from the broadening <strong>of</strong> the (110) peak using a Pseudo-<br />
Voigt fitting function, and the determined electrical resistivity <strong>of</strong> the films.<br />
Alloy<br />
system<br />
Atomic<br />
radius<br />
[pm]<br />
Grain size<br />
[nm]<br />
2 θ (110)<br />
[°]<br />
L<strong>at</strong>tice<br />
spacing<br />
[nm]<br />
Macrostrain <br />
Microstrain<br />
Electrical<br />
resistivity<br />
[µΩcm]<br />
Mo 136 42 40.41 0.2230 0.00223 0.00279 11<br />
Mo-Ti 144 37 40.48 0.2226 0.00057 0.00233 15<br />
Mo-Cr 125 45 40.53 0.2224 -0.00061 0.00263 14<br />
Mo-Ni 125 43 40.44 0.2229 0.00152 0.00293 33<br />
Mo-Nb 142 37 40.33 0.2234 0.00413 0.00295 14<br />
Mo-Ta 143 48 40.37 0.2232 0.00318 0.00288 14<br />
Mo-W 137 54 40.49 0.2226 0.00033 0.00261 12<br />
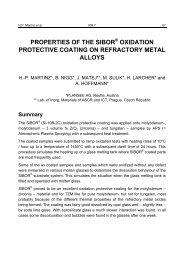
The c<strong>at</strong>hodic and the anodic electrochemical behavior <strong>of</strong> Mo and Mo alloy films, as measured in a 0.9 %<br />
NaCl aqeous solution against a s<strong>at</strong>ur<strong>at</strong>ed calomel electrode, is shown in Fig. 1. It can clearly be seen<br />
th<strong>at</strong> there are only small differences in the corrosion potentials and the corrosion current density <strong>of</strong> the<br />
individual films. The corrosion current density was measured to 0.13 µA/cm 2 for the Mo samples alloyed<br />
with Cr and Ni, 0.17 µA/cm 2 for the Mo-Nb film and 0.24 µA/cm 2 for those films alloyed with Ti, Ta and<br />
W. All these values are lower compared to the current density measured for Mo, i.e. 0.26 µA/cm 2 .<br />
However, it has to be mentioned th<strong>at</strong> the differences between the alloy systems for both, the corrosion<br />
potential and the corrosion current density, are rel<strong>at</strong>ively small and close to the st<strong>at</strong>istical measurement<br />
error. To illustr<strong>at</strong>e this, additional measurements were done for three film samples <strong>of</strong> the Mo-Cr system,<br />
being co<strong>at</strong>ed in the same deposition run. There, a corrosion potential <strong>of</strong> -270 ± 40 mVSCE and a<br />
corrosion current density <strong>of</strong> 0.13 ± 0.03 µA/cm 2 was obtained. This means th<strong>at</strong> the sc<strong>at</strong>tering <strong>of</strong> d<strong>at</strong>a for<br />
the corrosion potential is almost in the same order <strong>of</strong> magnitude as the differences measured (see Fig.<br />
1). Nevertheless, from the corrosion current density one can conclude th<strong>at</strong> Cr and Ni are most efficient in<br />
improving the corrosion r<strong>at</strong>e, whereas Ti, Ta and especially W do not affect the corrosion current density<br />
significantly compared to the unalloyed Mo film.
List, Mitterer, Mori et al. 17th Plansee Seminar 2009, Vol. 1 RM 12/5<br />
Fig. 1: C<strong>at</strong>hodic and anodic polariz<strong>at</strong>ion curves <strong>of</strong> the Mo alloy thin film systems investig<strong>at</strong>ed.<br />
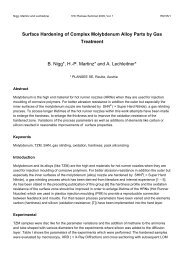
To determine the polariz<strong>at</strong>ion resistance <strong>of</strong> the samples <strong>at</strong> the corrosion potential without disturbing the<br />
system significantly, electrochemical impedance spectroscopy in a 0.9 % NaCl aqueous solution was<br />
used. The polariz<strong>at</strong>ion resistance was calcul<strong>at</strong>ed from the Nyquist plots shown in Fig. 2 after 24 h <strong>of</strong><br />
immersion. Already the Nyquist plots indic<strong>at</strong>e th<strong>at</strong> alloying the Mo films with Ti, Ni, Nb, Ta, and W only<br />
results in small changes, and likewise also the polariz<strong>at</strong>ion resistance is only slightly affected (see Fig.<br />
2). However, adding Cr results in a dram<strong>at</strong>ic change <strong>of</strong> the Nyquist plot and an increase <strong>of</strong> the<br />
polariz<strong>at</strong>ion resistance from values around 20 to 116 kΩ. The lowest polariz<strong>at</strong>ion resistance (equal to the<br />
highest corrosion r<strong>at</strong>e) was obtained for Mo and Mo-W films.<br />
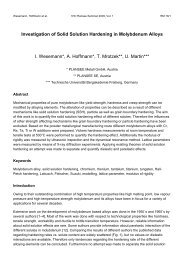
Fig. 3 shows the specific mass gain as obtained after 168 h exposure <strong>of</strong> the co<strong>at</strong>ed samples in a clim<strong>at</strong>ic<br />
test chamber <strong>at</strong> 85°C and 85 % rel<strong>at</strong>ive humidity. It has to be noted th<strong>at</strong> the measured mass changes<br />
are in the range <strong>of</strong> 10 to 320 µg, where the lower values are close to the resolution limit <strong>of</strong> the precision<br />
balance used. Nevertheless, it can be seen from Fig. 3 th<strong>at</strong> essentially no specific mass gain was<br />
obtained for those Mo films alloyed with Ti and Ta, whereas the highest values have been observed for<br />
the unalloyed Mo film and for alloying with Ni and W. This corresponds also to the visual appearance <strong>of</strong><br />
the film surfaces after exposure, where intense blue color<strong>at</strong>ions are seen for Mo, Mo-Ni and Mo-W, while<br />
the other films show yellowish to brownish colors.
RM 12/6 17th Plansee Seminar 2009, Vol. 1 List, Mitterer, Mori et al.<br />
Fig. 2: Nyquist-diagram <strong>of</strong> Mo alloy thin films in 0.9 % NaCl aqeous solution (room temper<strong>at</strong>ure, open circuit potential, ±10<br />
mV, 1 mHz – 500 kHz) after 24 h <strong>of</strong> exposure to the test solution. The respective polariz<strong>at</strong>ion resistance is also given.<br />
Fig. 3: Specific mass gain <strong>of</strong> the Mo alloy thin film systems investig<strong>at</strong>ed as determined by corrosion tests <strong>at</strong> 85°C and 85 %<br />
rel<strong>at</strong>ive humidity.
List, Mitterer, Mori et al. 17th Plansee Seminar 2009, Vol. 1 RM 12/7<br />
The oxide films formed during exposure in the clim<strong>at</strong>ic test chamber are too thin to be detected by XRD<br />
and in SEM cross-sections [2]. To obtain more inform<strong>at</strong>ion about their n<strong>at</strong>ure, Raman spectroscopy<br />
investig<strong>at</strong>ions have been done on the oxidized film surfaces. Usually, metals are not Raman active,<br />
whereas oxides <strong>of</strong>ten show intense Raman bands [12]. This is in good agreement with Fig. 4, where no<br />
significant intensity <strong>of</strong> Raman peaks is observed for the as-deposited Mo film surface. The surfaces after<br />
exposure to the clim<strong>at</strong>ic test chamber show peaks indic<strong>at</strong>ive for form<strong>at</strong>ion <strong>of</strong> MoO2 and MoO3 [ 13,14],<br />
as<br />
confirmed by the Raman spectra <strong>of</strong> MoO2 and MoO3 powders also shown in Fig. 4. It has to be noted<br />
th<strong>at</strong> the peaks found on the surfaces <strong>of</strong> the oxidzed films are less sharp and broader, as compared to the<br />
powder standards. This might be due to the low thickness and high structural disorder <strong>of</strong> the oxide layers<br />
formed during low-temper<strong>at</strong>ure oxid<strong>at</strong>ion.<br />
The low intensity observed for the Mo-Ta film correl<strong>at</strong>es well with the low specific mass gain shown in<br />
Fig. 3. While the positions <strong>of</strong> the Raman peaks do not show significant differences for the unalloyed film<br />
and for alloying with Ti, Ni, Nb, and W, the Mo-Cr film shows – in addition to the peaks origin<strong>at</strong>ing from<br />
MoO2<br />
and MoO3 – a pronounced Raman peak <strong>at</strong> ~880 cm -1<br />
, which is rel<strong>at</strong>ed to the form<strong>at</strong>ion <strong>of</strong><br />
chromium oxides [ 15,16].<br />
It can thus be concluded th<strong>at</strong> these chromium oxides show a passiv<strong>at</strong>ing<br />
n<strong>at</strong>ure, explaining the excellent performance <strong>of</strong> Mo-Cr films in electrochemical impedance spectroscopy<br />
(see Fig. 2) and during exposure in the clim<strong>at</strong>ic test chamber (see Fig. 3). It is surprising th<strong>at</strong> already<br />
such low Cr contents <strong>of</strong> 4.7 <strong>at</strong>.-% (Table I, corresponding to 2.6 wt.-% Cr ) in the Mo film are sufficiently<br />
high to form a Cr-rich oxide layer <strong>at</strong> the surface. In stainless steels, this threshold Cr value is 12 wt.-%.<br />
The reason for this is not clear yet, however, investig<strong>at</strong>ions on Cr-containing cemented carbides proved<br />
th<strong>at</strong> also Cr-concentr<strong>at</strong>ions in the binder alloy <strong>of</strong> only 5 wt.-% are sufficient to improve the corrosion<br />
resistance significantly [15]. These binders also contain high amounts <strong>of</strong> W th<strong>at</strong> acts chemically similar<br />
like Mo.<br />
Fig. 4: Raman spectra <strong>of</strong> the as-deposited Mo film and the Mo alloy systems oxidized <strong>at</strong> 85°C and 85 % rel<strong>at</strong>ive humidity. The<br />
Raman spectra <strong>of</strong> MoO2 and MoO3 powders are given for comparison.
RM 12/8 17th Plansee Seminar 2009, Vol. 1 List, Mitterer, Mori et al.<br />
Conclusions<br />
<strong>Molybdenum</strong> thin films, alloyed with Ti, Cr, Ni, Nb, Ta, or W, respectively, have been synthesized on<br />
glass substr<strong>at</strong>es by magnetron sputtering from mosaic targets. In all cases, the content <strong>of</strong> the alloying<br />
elements was below 5.2 <strong>at</strong>.-% and single-phase Mo-based solid solutions are formed. The observed<br />
differences in corrosion and oxid<strong>at</strong>ion behavior are rel<strong>at</strong>ively small, nevertheless, some general<br />
tendencies can be drawn from the combin<strong>at</strong>ion <strong>of</strong> tests performed. Alloying with Cr results in the lowest<br />
corrosion current density in electrochemical polariz<strong>at</strong>ion experiments, the highest polariz<strong>at</strong>ion resistance<br />
in electrochemical impedance spectroscopy and the Mo-Cr sample is within the top three ones in the<br />
exposure test in the clim<strong>at</strong>ic test chamber. These excellent corrosion properties are rel<strong>at</strong>ed to the<br />
change <strong>of</strong> oxide film structure from pure Mo oxide towards a Cr-enriched oxide film. While Ti, Ni, Nb, and<br />
Ta show a corrosion and oxid<strong>at</strong>ion performance better than the unalloyed Mo films, alloying by W does<br />
not show a benefical effect. This is most probably due to the similar chemical behavior and oxide<br />
structure <strong>of</strong> Mo and W.<br />
Acknowledgement<br />
A part <strong>of</strong> this work has been supported by the Austrian Research Promotion Agency (FFG) under the<br />
framework <strong>of</strong> the Research Studio Austria Surface Engineering.<br />
References<br />
1. N. Birks, G.H. Meier and F.S. Pettit, Introduction <strong>of</strong> the High-Temper<strong>at</strong>ure <strong>Oxid<strong>at</strong>ion</strong> <strong>of</strong> Metals, 2 nd<br />
Ed., Cambridge University Press, Cambridge, (2006)<br />
2. M. Gr itsch, C . B runner, K . P iplits, H . H utter, P . Wilhartitz, A . S chintlmeister a nd H .P. M artinz,<br />
Fresenius J. Anal. Chem. 365 [1-3], 188-194, (1999)<br />
3. P.Y. Park, E. Akiyama, H. Habazaki, A. Kawashima, K. Asami and K . Hashimoto, Corros. Sci. 38<br />
[10], 1649-1667, (1996)<br />
4. C.R. Tomachuk, D.B. Mitton, J. Springer, T. Monetta and F. Bellucci, M<strong>at</strong>er. Corros. 57 [5], 394-<br />
399, (2006)<br />
5. P. Losbichler and C. Mitterer, Surf. Co<strong>at</strong>. Technol. 97 [1-3], 567-573, (1997)<br />
6. http://www.srim.org<br />
7. M. Ohring, M<strong>at</strong>erials Science <strong>of</strong> <strong>Thin</strong> <strong>Films</strong>, p. 164, Academic Press, San Diego (2002)<br />
8. I. Petrov, P.B. Barna, L. Hultman and J. E. Greene, J. Vac. Sci. Technol. A 21 [5], 5117-5128,<br />
(2003)<br />
9. K.Y. Ahn, J.M. E. Harper, P.M. Fryer, B. Davari, L. Krusin-Elbaum and J. Karasinski, Proceedings<br />
3 rd<br />
Workshop on Tungsten and other Refractory Metals for VLSI Applic<strong>at</strong>ions, M<strong>at</strong>erials Research<br />
Society, Warrandale, pp. 317-326, (1988)<br />
10. F. Martin, P. Muralt and M.-A. Dubois, J. Vac. Sci. Technol. A 24 [4], 946-952, (2006)<br />
11. F. Klabunde, M. Löhmann, J. Blasinq and T. Drüsedau, J. Appl. Phys. 80 [11], 6266-6273, (1966)<br />
12. W.H. Weber, Raman Sc<strong>at</strong>tering in M<strong>at</strong>erials Science, Springer, Berlin, (2000)<br />
13. M. Dieterle, G. Weinberg and G. Mestl, Phys. Chem. Chem. Phys. 4 [5], 812-821, (2002)<br />
14. M. Dieterle and G. Mestl, Phys. Chem. Chem. Phys. 4 [5], 822-826, (2002)
List, Mitterer, Mori et al. 17th Plansee Seminar 2009, Vol. 1 RM 12/9<br />
15. D. S tanoi, G . S ocol, C . Grigorescu, F . G uinneton, O . M onnereau, L. T ortet, T. Z hangd and I.N.<br />
Mihailescu, M<strong>at</strong>er. Sci. Engin. B 118, 74-78, (2005)<br />
16. B.M. Weckhuysen and I.E. Wachs, J. Phys. Chem. B 101, 2793-2796, (1997)<br />
17. S. Sutthiruangwong, G. Mori and R. Koesters, Int. J. Refract. Met. Hard M<strong>at</strong>er. 23, 129-136, (2005)