Technical Paper 9 Slim-profile double glazing - Historic Scotland
Technical Paper 9 Slim-profile double glazing - Historic Scotland
Technical Paper 9 Slim-profile double glazing - Historic Scotland

You also want an ePaper? Increase the reach of your titles
YUMPU automatically turns print PDFs into web optimized ePapers that Google loves.
Annex 7 - Freight Transport Conversion Tables !"#$%&'(&)$*+' ,--./0011123&)$*24"52#60&758$"79&7-0:#!87&!!0$&."$-8740%"75&$!8"7;)*%-"$!2,-9<br />
passengers without <strong>double</strong>-counting.<br />
The allocation of aircraft CO2 emissions between passengers and freight on these aircraft is complex and for the purposes of these emission<br />
1<br />
CO2<br />
CD2<br />
CO2<br />
CO2<br />
CO2<br />
CO2<br />
CO2<br />
CO2<br />
CO2<br />
CH4<br />
CH4<br />
CH4<br />
CO2<br />
CO2<br />
CO2<br />
Last updated:<br />
DIESEL DENSITY 870.2 kg/m3 SOURCE UNFCCC<br />
DIESEL CALORIFIC VALUE 46 MJ/kg SOURCE http://www.kayelaby.npl.co.uk/chemistry/3_11/3_11_4.html<br />
KEROSENE 71.4 t CO2 / SOURCE sustinable energy authority of ireland http://www.sustainableenergyireland.com/Publications/Statistics_Publications/Emission_Factors/<br />
How to use this Annex TJ<br />
DIESEL 73.3 t CO2 / TJ SOURCE sustinable energy authority of ireland http://www.sustainableenergyireland.com/Publications/Statistics_Publications/Emission_Factors/<br />
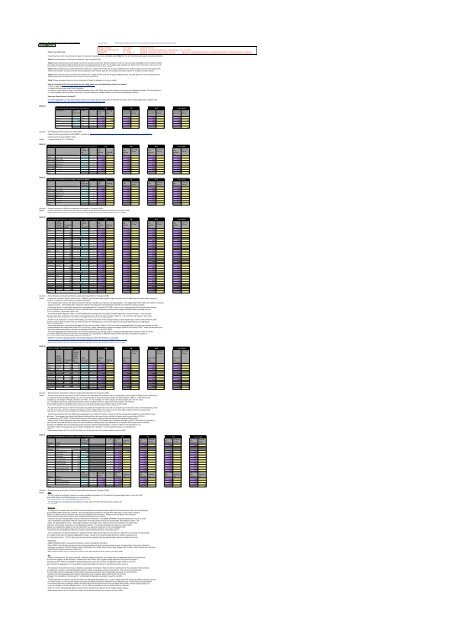
If you know how much of a particular fuel type is consumed, emissions can be calculated using Table 7a. This is the most accurate way to calculate emissions.<br />
Table 7b gives emissions for distance travelled for vans and small trucks<br />
Table 7c gives emissions per tonne freight carried for vans and small trucks. Emission factors for vans in tonne km were calculated from the emission factors<br />
per vehicle km provided in Table 6i (Annex 6) and an average load factor of 40%. The average cargo capacity was taken to be 0.5 tonnes for vans up to 1.25<br />
tonnes gross vehicle weight, and 2 tonnes for vans up to 3.5 tonnes gross vehicle weight.<br />
Table 7d gives emissions per vehicle kilometre travelled for a range of HGV sizes with a range of different loads. Use this table if you know the distance the<br />
vehicle has travelled. If you do not know the load capacity of your vehicle, apply the UK average load which is given for a range of vehicle classes.<br />
Table 7e gives emissions per tonne kilometre travelled for a range of HGV sizes with a range of different loads. Use this table if you know the distance the<br />
freight has travelled and what the mass (in tonnes) of the freight was.<br />
Table 7f gives emissions factors for tonne kilometres of freight for shipping, rail, and air freight<br />
How do I determine UK rail travel distances (in miles) where start and destination stations are known?<br />
1. Click on web link: http://www.networkrail.co.uk/aspx/3828.aspx<br />
2. Select the Route Index under Train Timetables<br />
3. Use your mouse cursor to click on the appropriate train route in the 'Table' column that matches your starting and destination stations. This should open a<br />
4. In the timetable, refer to the 'Miles' columns on the left to determine mileage between your starting and destination stations.<br />
How were these factors calculated?<br />
For further explanation on how these emission factors have been derived, please refer to the GHG conversion factor methodology paper available here:<br />
http://www.defra.gov.uk/environment/business/reporting/conversion-factors.htm<br />
Table 7a<br />
5<br />
Standard Road Transport Fuel Conversion Factors CO2 CH4 N2O<br />
F#&@'#!&3<br />
?"-*@'<br />
?"-*@'64'<br />
?"-*@'64'<br />
?"-*@'64'<br />
A78-! B 64'CD2'.&$'<br />
64'CD2eq'<br />
64'CD2eq'<br />
#78-!'#!&3<br />
#78-<br />
.&$'#78- CD2eq<br />
.&$'#78- CD2eq<br />
Total GHG<br />
64'CD2eq' ?"-*@'64'<br />
.&$'#78- CD2eq<br />
Petrol<br />
Diesel<br />
Compressed Natural Gas (CNG)<br />
Liquid Petroleum Gas (LPG)<br />
Total<br />
litres x 2.3035 0.00470 0.02260 2.33070<br />
86.5 litres x 2.6391 228.28 0.00190 0 0.02830 2 2.66940 231<br />
kg x 2.7278 0.00415 0.00161 2.73356<br />
litres x 1.4951 0.00060 0.00110 1.49680<br />
228 0 2 231<br />
Sources UK Greenhouse Gas Inventory for 2007 (AEA)<br />
Digest of UK Energy Statistics 2008 (BERR), available at: http://www.berr.gov.uk/whatwedo/energy/statistics/publications/dukes/page45537.html<br />
Carbon factors for fuels (UKPIA, 2004)<br />
Notes 1 imperial gallon (UK) = 4.546 litres<br />
Table 7b<br />
12<br />
Van/Light Commercial Vehicle Road Freight Conversion Factors: Vehicle CO2 km Basis<br />
Total<br />
kg CO2<br />
vehicle<br />
per<br />
km<br />
vehicle Total kg<br />
Type of vanGross Vehicle Weight (tonnes)<br />
travelled x km<br />
kg CO2eq<br />
per<br />
vehicle<br />
km<br />
?"-*@'64'<br />
CD2eq<br />
N2O<br />
kg CO2eq<br />
?"-*@'64'<br />
per<br />
CD2eq<br />
vehicle<br />
km<br />
Total GHG<br />
kg CO2eq<br />
?"-*@'64'<br />
per<br />
CD2eq<br />
vehicle<br />
km<br />
Petrol<br />
up to 1.25t<br />
x 0.22439 0.00034 0.00351 0.22824<br />
Diesel (Class I)up to 1.305t x 0.16086 0.00004 0.00107 0.16197<br />
Diesel (Class II)1.305t to 1.74t x 0.22492 0.00004 0.00149 0.22645<br />
Diesel (Class III) 1.74t to 3.5t x 0.29933 0.00004 0.00199 0.30136<br />
Diesel (average) up to 3.5t<br />
x 0.27162 0.00004 0.00180 0.27347<br />
LPG or CNG<br />
up to 3.5t<br />
x 0.27185 0.00034 0.00351 0.27570<br />
Average up to 3.5t<br />
x 0.26660 0.00008 0.00198 0.26866<br />
Total 0 0 0 0<br />
Table 7c<br />
12<br />
Van/Light Commercial Vehicle Road Freight Conversion<br />
Factors (UK Average Vehicle Loads): Tonne.km Basis<br />
Total<br />
tonne km<br />
Gross Vehicle Weight (tonnes)<br />
travelled x<br />
kg CO2<br />
per<br />
tonne.km<br />
Total kg<br />
kg CO2eq<br />
per<br />
tonne.km<br />
?"-*@'64'<br />
CD2eq<br />
N2O<br />
kg CO2eq ?"-*@'64'<br />
per<br />
CD2eq<br />
tonne.km<br />
Total GHG<br />
kg CO2eq ?"-*@'64'<br />
per<br />
CD2eq<br />
tonne.km<br />
Petrol<br />
up to 1.25t<br />
x 0.92856 0.00141 0.01454 0.94450<br />
Diesel (Class I)up to 1.305t x 0.66567 0.00018 0.00442 0.67027<br />
Diesel (Class II)1.305t to 1.74t x 0.55845 0.00011 0.00370 0.56226<br />
Diesel (Class III) 1.74t to 3.5t x 0.37160 0.00005 0.00246 0.37412<br />
Diesel (average) up to 3.5t<br />
x 0.33721 0.00005 0.00224 0.33950<br />
LPG or CNG<br />
up to 3.5t<br />
x 0.33749 0.00042 0.00436 0.34227<br />
Average up to 3.5t<br />
x 0.40006 0.00020 0.00354 0.40380<br />
Total 0 0 0 0<br />
Sources<br />
Notes<br />
Table 7d<br />
13<br />
Factors developed by AEA and agreed with Department for Transport (2009)<br />
Emission factors for vans in tonne km were calculated from the emission factors per vehicle km provided in Table<br />
New emission factors for CH4 and N2O are based on UK Greenhouse Gas Inventory default values for 2007<br />
Diesel HGV Road Freight Conversion Factors: Vehicle km Basis CO2 CH4 N2O Total GHG<br />
Gross<br />
Total<br />
kg CO2<br />
kg CO2eq ?"-*@'64'<br />
kg CO2eq ?"-*@'64'<br />
kg CO2eq ?"-*@'64'<br />
Vehicle<br />
vehicle<br />
per<br />
per<br />
per<br />
per<br />
CD2eq<br />
CD2eq<br />
CD2eq<br />
Weight % weight<br />
km<br />
vehicle Total kg<br />
vehicle<br />
vehicle<br />
vehicle<br />
(tonnes) laden<br />
travelled x km<br />
km<br />
km<br />
km<br />
Rigid >3.5-7.5t 0% x 0.50878 0.00030 0.00590 0.51499<br />
50% x 0.55302 0.00030 0.00590 0.55923<br />
100% x 0.59727 0.00030 0.00590 0.60347<br />
40% (UK average load) x 0.54417 0.00030 0.00590 0.55038<br />
Rigid >7.5-17t 0% x 0.65780 0.00030 0.00789 0.66599<br />
50% x 0.75177 0.00030 0.00789 0.75996<br />
100% x 0.84574 0.00030 0.00789 0.85393<br />
37% (UK average load) x 0.72734 0.00030 0.00789 0.73553<br />
Rigid >17t 0% x 0.75129 0.00030 0.01013 0.76172<br />
50% x 0.91621 0.00030 0.01013 0.92664<br />
100% x 1.08113 0.00030 0.01013 1.09156<br />
55% (UK average load) x 0.93362 0.00030 0.01013 0.94405<br />
All rigids UK average 53% x 0.79311 0.00030 0.00860 0.80201<br />
Articulated >3.5-33t 0% x 0.68943 0.00153 0.00908 0.70004<br />
50% x 0.86179 0.00153 0.00908 0.87240<br />
100% x 1.03415 0.00153 0.00908 1.04476<br />
43% (UK average load) x 0.83766 0.00153 0.00908 0.84827<br />
Articulated >33t 0% x 0.67407 0.00153 0.01023 0.68583<br />
50% x 0.89876 0.00153 0.01023 0.91052<br />
100% x 1.12345 0.00153 0.01023 1.13521<br />
60% (UK average load) x 0.94370 0.00153 0.01023 0.95546<br />
All artics UK average 59% x 0.93190 0.00153 0.01011 0.94353<br />
Sources<br />
ALL HGVs UK average 56% x 0.85754 0.00092 0.00930 0.86776<br />
Total 0 0 0 0<br />
Revised factors developed by AEA and agreed with Department for Transport (2009)<br />
Notes Factors are provided in kgCO2/vehicle.km for 3 different gross vehicle weight ranges of rigid-axled HGVs and 2 different gross vehicle weight ranges of<br />
articulated HGVs. A vehicle km is the distance travelled by the HGV.<br />
The % weight laden refers to the extent to which the vehicle is loaded to its maximum carrying capacity. A 0% weight laden HGV means the vehicle is travelling<br />
carrying no loads. 100% weight laden means the vehicle is travelling with loads bringing the vehicle to its maximum carrying capacity.<br />
Factors are based on road freight statistics from the Department for Transport (DfT, 2008), from a survey on the average miles per gallon and average<br />
loading factor for different sizes of rigid and artic HGVs in the 2007 fleet, combined with test data from the European ARTEMIS project showing how fuel<br />
efficiency, and hence CO2 emissions, varies with vehicle load.<br />
The miles per gallon figures in Table 1.9 of DfT (2008) were converted into CO2 factors using the diesel fuel conversion factors. Then using the<br />
ARTEMIS data, these were corrected to CO2 factors corresponding to 0%, 50% and 100% loading in Table 7d. The correction was based on the current<br />
percent lading for different sizes of HGVs in the national fleet in 2007 given in Table 1.16 of DfT (2008).<br />
As well as CO2 factors for 0, 50 and 100% loading, CO2 factors are shown for the average loading of each weight class of HGV in the UK fleet in 2005.<br />
These should be used as default values if the user does not know the loading factor to use and are based on the actual laden factors and mpg figures<br />
from tables 1.16 and 1.9 in DfT (2008).<br />
UK average factors for all rigid and articulated HGVs are also provided in Table 7d if the user requires aggregate factors for these main classes of HGVs,<br />
perhaps because the weight class of the HGV is not known. Again, these factors represent averages for the UK HGV fleet in 2005. These are derived directly<br />
from the average mpg values for all rigid and articulated HGVs in Table 1.9 of DfT (2008).<br />
At a more aggregated level still are factors for all HGVs representing the average mpg for all rigid and articulated HGV classes in Table 1.9 of DfT<br />
(2008). This factor should be used if the user has no knowledge of or requirement for different classes of HGV and may be suitable for analysis of<br />
HGV CO2 emissions in, for example, inter-modal freight transport comparisons.<br />
Reference: Transport Statistics Bulletin: Road Freight Statistics 2005, DfT SB (06) 27, June 2006<br />
http://www.dft.gov.uk/162259/162469/221412/221522/222944/coll_roadfreightstatistics2005in/rfs05comp.pdf<br />
New emission factors for CH4 and N2O are based on UK Greenhouse Gas Inventory default values for 2007<br />
Table 7e<br />
13<br />
Diesel HGV Road Freight Conversion Factors (UK Average<br />
Vehicle Loads): Tonne.km Basis CO2 CH4 N2O<br />
UK<br />
?"-*@'64'<br />
?"-*@'64'<br />
average<br />
tonnes<br />
CD2eq<br />
CD2eq<br />
Gross<br />
goods<br />
kg CO2<br />
kg CO2eq<br />
kg CO2eq<br />
Vehicle<br />
carried Total<br />
Weight % weight per tonne km<br />
per Total kg<br />
per<br />
per<br />
(tonnes) laden vehicle travelled x tonne.km<br />
tonne.km<br />
tonne.km<br />
Total GHG<br />
?"-*@'64'<br />
CD2eq<br />
kg CO2eq<br />
per<br />
tonne.km<br />
Rigid >3.5-7.5t 40% 0.81 x 0.67115 0.00038 0.00728 0.67880<br />
Rigid >7.5-17t 37% 2.31 x 0.31518 0.00013 0.00342 0.31873<br />
Rigid >17t 55% 5.25 x 0.17797 0.00006 0.00193 0.17996<br />
All rigids UK average 53% 3.42 x 0.23167 0.00009 0.00251 0.23427<br />
Articulated >3.5-33t 43% 6.00 x 0.13961 0.00025 0.00151 0.14138<br />
Articulated >33t 60% 11.46 x 0.08237 0.00013 0.00089 0.08340<br />
All articulatedsUK average 59% 10.97 x 0.08492 0.00014 0.00092 0.08598<br />
ALL HGVs UK average 56% 7.23 19.61 x 0.11857 2.33 0.00012 0 0.00167 0 0.12036 2<br />
Total 2 0 0 2<br />
Sources Revised factors developed by AEA and agreed with Department for Transport (2009)<br />
Notes The user may want to use factors in kgCO2/tonne.km for calculating the emissions due to transporting a given weight of freight a given distance for<br />
comparison with other modes of freight transport, e.g. for comparing road vs rail using tonne.km factors for other modes in Table 7f. A tonne.km is the<br />
distance travelled multiplied by the weight of freight carried by the HGV. So, for example, an HGV carrying 5 tonnes freight over 100 km has a<br />
tonne.km value of 500 tonne.km. As different users may require CO2 factors for HGVs in different levels of detail of HGV type, factors are provided<br />
in kgCO2/tonne.km for: 3 different gross vehicle weight ranges of rigid-axled HGVs (most amount of detail possible) and 2 different gross vehicle weight<br />
ranges of articulated HGVs; fleet averaged factors for all types of rigids and articulated HGVs; factor averaged for all types of HGVs (least amount of<br />
The gCO2/tonne.km factors in Table 7e have been calculated on the basis that a lorry will run empty for part of the time in the overall transporting of the<br />
freight. Thus the user does not need to <strong>double</strong> the distance of their freight tonne km for parts of a trip done empty loaded, as this has already been<br />
considered in the calculations. The distance should refer to the overall distance that the goods are moved.<br />
The factors are derived from the 2005 fleet average kgCO2 per vehicle km factors in Table 7d and the average tonne freight per vehicle lifted by each<br />
HGV weight class. The average tonne freight lifted figures are derived from the tonne.km and vehicle.km figures given for each class of HGV in<br />
Tables 1.12 and 1.13, respectively, in DfT (2008). Dividing the tonne.km by the vehicle.km figures gives the average tonnes freight lifted by each<br />
Tables 7d and 7e are provided as alternative methods for calculating CO2 emissions from movement of freight by HGVs. The factors in g/vehicle.km<br />
(Table 7d) are sufficient (and with the ability to take into account different loading factors are preferential) for an operator who simply wants to calculate<br />
and compare CO2 emissions for different ways of transporting goods around by optimising freight logistics. Factors in Table 7e may be better to use<br />
when comparing road freight with other modes for transporting a given weight of freight a given distance. To avoid <strong>double</strong>-counting, it is important that<br />
calculations DO NOT USE BOTH methods.<br />
New emission factors for CH4 and N2O are based on UK Greenhouse Gas Inventory default values for 2007<br />
Table 7f<br />
14 Other Freight Mileage Conversion Factors: Tonne.km Basis<br />
Total<br />
B<br />
tonne km<br />
E"3& Detail<br />
travelled<br />
kg CO2<br />
per<br />
tonne.km<br />
kg CO2eq<br />
Total kg<br />
per<br />
tonne.km<br />
?"-*@'64'<br />
CD2eq<br />
N2O<br />
Total GHG<br />
kg CO2eq ?"-*@'64'<br />
kg CO2eq ?"-*@'64'<br />
per<br />
per<br />
CD2eq<br />
CD2eq<br />
tonne.km<br />
tonne.km<br />
Rail Diesel x 0.02850 0.00007 0.00332 0.03190<br />
Shipping Type Vessel deadweight, tonnes<br />
Large RoPax Ferry - 0.0006 0.38434 0.000231 0.00013 0 0.00299 0 0.38746 0<br />
Small tanker 844 x 0.02000 0.00001 0.00016 0.02016<br />
Large tanker 18,371 352 x 0.00500 1.76 0.00000 0 0.00004 0 0.00504 2<br />
Very large tanker 100,000 x 0.00400 0.00000 0.00003 0.00403<br />
Small bulk carrier 1,720 x 0.01100 0.00000 0.00009 0.01109<br />
Large bulk carrier 14,201 x 0.00700 0.00000 0.00005 0.00706<br />
Very large bulk carrier 70,000 x 0.00600 0.00000 0.00005 0.00605<br />
Small container vessel 2,500 x 0.01500 0.00001 0.00012 0.01512<br />
E"3&<br />
Large container vessel 20,000 x 0.01300 0.00000 0.00010 0.01311<br />
Total B km uplift B<br />
kg CO2<br />
kg CO2eq<br />
kg CO2eq<br />
kg CO2eq<br />
tonne km<br />
per Total kg<br />
per Total kg<br />
per Total kg<br />
per Total kg<br />
factor 1<br />
Detail<br />
travelled<br />
tonne.km<br />
tonne.km<br />
tonne.km<br />
tonne.km<br />
Air Domestic x 109% x 1.91593 0.00144 0.01886 1.93623<br />
Short-haul international x 109% x 1.40441 0.00008 0.01382 1.41831<br />
Long-haul international 352 x 109% x 0.59487 228 0.00003 0 0.00585 2 0.60076 230<br />
Total 230 0 2 232<br />
Sources<br />
Notes<br />
Revised factors developed by AEA and agreed with Department for Transport (2009)<br />
Rail:<br />
The CO2 value for rail freight is based on currently available information on CO2 emissions by diesel freight trains in the UK in 2007<br />
produced by ORR (Office of the Rail Regulator) and is available at:<br />
http://www.rail-reg.gov.uk/upload/pdf/rolling-c9-environ.pdf<br />
The rail freight CH4 and N2O factors are based on those used in the UK Greenhouse Gas Inventory for<br />
diesel rail for 2007.<br />
Shipping:<br />
The freight CO2 emission factor for RoPax Ferries was derived from data provided by Best Foot Forward based on work for the Passenger<br />
Shipping Association (PSA) carried out in 2007/8. The calculated figure assumes an average HGV load factor of 13.6 tonnes, based on<br />
information in Table 2.6 of Road Transport Statistics 2005 (from the Department for Transport). RoPax Ferries are Roll-on Roll-off ferries<br />
that carry both road vehicles and their passengers as well as having additional passenger-only capacity.<br />
Factors for the other representative ships are derived from information in the EMEP-CORINAIR Handbook (2003) and a report by Entec<br />
(2002). This included fuel consumption rates for engine power and speed while cruising at sea associated with different vessels. The<br />
factors refer to kgCO2 per deadweight tonne km. Deadweight tonnage is the weight of the cargo etc which when added to the weight of the<br />
ship's structure and equipment, will bring the vessel down to its designated waterline. This implies the factors are based on a fully loaded<br />
vessel. Because the ship's engines are propelling the weight of the ship itself which is a significant proportion of the overall weight of the<br />
vessel and its cargo, reducing the cargo load from the deadweight tonnage will not lead to a proportionate reduction in the amount of fuel<br />
required to move the vessel a given distance. For example, decreasing the cargo load to half the ship's deadweight will not reduce the ship's<br />
As a consequence, the factors expressed in kgCO2/tonne.km freight will be higher than the figures in Table 6k for ships that are only partially<br />
loaded (i.e. loaded to less than the vessel's deadweight tonnage). Figures on the typical loading factors for different vessels are not<br />
currently available in the public domain. The CO2 factors will be reviewed and updated when the loading factors become available to provide<br />
factors that are more representative of vessel movements from UK ports. Meanwhile, the factors in Table 6k should be regarded as lower<br />
References:<br />
EMEP/CORINAIR (2007), Atmospheric Emission Inventory Guidebook, 5th Edition.<br />
Entec (2002), Quantification of emissions from ships associated with ship movements between ports in the European Community, Report for<br />
European Commission, DG ENV. Belgium; Main Contributors Chris Whall, Karen Archer, Layla Twigger, Neil Thurston, David Ockwell, Alun McIntyre,<br />
Alistair Ritchie (Entec) and David Cooper (IVL).<br />
New emission factors for CH4 and N2O are based on the UK Greenhouse Gas Inventory for 2007 (AEA)<br />
Air:<br />
Freight is transported by two types of aircraft - dedicated cargo aircraft which carry freight only, and passenger aircraft which carry both<br />
passengers and their luggage, as well as freight. Statistics from the CAA for 2007 suggest a large proportion of long haul air freight is<br />
transported on passenger aircraft. While it is possible to estimate freight CO2 factors per tonne.km for dedicated cargo aircraft in much the<br />
same way as the passenger.km factors for passengers, it is more difficult to generate freight CO2 factors for aircraft that are also carrying<br />
factors the allocation is carried out by treating freight carried on cargo or passenger services as equivalent. This is done by assuming the<br />
incorporation of the lost cargo capacity of passenger aircraft relative cargo-only equivalents into the passenger weighting. It is assumed this<br />
difference in freight cargo capacity is due to passenger-service specific equipment (such as seating, galley, toilets, food) and air frame<br />
modifications. The reference aircraft used in this calculation is the Boeing 747, as the freight configuration equivalent is used for over 90%<br />
of long-haul dedicated cargo transport from the UK.<br />
The 9% uplift factor comes from the IPCC Aviation and the global Atmosphere 8.2.2.3 , which states that 9-10% should be added to take into account<br />
non-direct routes (i.e. not along the straight line great circle distances between destinations) and delays/circling. Airline industry representatives<br />
have indicated that the percentage uplift for short-haul flights will be higher and for long-haul flights will be lower, however specific data is not<br />
currently available to provide separate factors. This is under investigation for future versions of these guidelines.<br />
Notes 10-12 from the passenger flights emission factors (Annex 6) also apply to the air freight emission factors.<br />
New emission factors for CH4 and N2O are based on the UK Greenhouse Gas Inventory for 2007 (AEA)


![Elgin Cathedral Wedding Brochure [pdf, 544kb] - Historic Scotland](https://img.yumpu.com/22301571/1/190x151/elgin-cathedral-wedding-brochure-pdf-544kb-historic-scotland.jpg?quality=85)