Regd. Office : 17, Jamshedji Tata Road, Mumbai - 400 - Hindustan ...
Regd. Office : 17, Jamshedji Tata Road, Mumbai - 400 - Hindustan ...
Regd. Office : 17, Jamshedji Tata Road, Mumbai - 400 - Hindustan ...

Create successful ePaper yourself
Turn your PDF publications into a flip-book with our unique Google optimized e-Paper software.
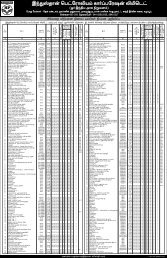
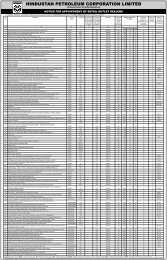
HINDUSTAN PETROLEUM CORPORATION LIMITED<br />
(A GOVERNMENT OF INDIA ENTERPRISE)<br />
<strong>Regd</strong>. <strong>Office</strong> : <strong>17</strong>, <strong>Jamshedji</strong> <strong>Tata</strong> <strong>Road</strong>, <strong>Mumbai</strong> - <strong>400</strong> 020<br />
AUDITED FINANCIAL RESULTS FOR THE YEAR ENDED 31ST MARCH 2006<br />
Particulars<br />
(Provisional<br />
(Unaudited)<br />
(Audited)<br />
Unaudited)<br />
(Audited)<br />
Nine Months<br />
Ended<br />
Three Months Ended<br />
Year Ended<br />
Consolidated Results<br />
Year Ended<br />
31.12.2005 31.03.2006 31.03.2005 31.03.2006 31.03.2005 31.03.2006 31.03.2005<br />
FINANCIAL PERFORMANCE (Rs. in Crores)<br />
1 Gross Sales 53,787.51 20,256.60 <strong>17</strong>,377.44 74,044.11 64,689.51 78,881.98 68,239.88<br />
2 Sales/Income from Operations 54,181.25 22,739.01 <strong>17</strong>,518.01 76,920.26 65,218.33 81,758.13 68,768.70<br />
Less : Excise Duty Paid 3,979.24 1,903.10 1,069.12 5,882.34 5,359.59 6,443.18 5,735.27<br />
Net Sales/Income from Operations 50,202.01 20,835.91 16,448.89 71,037.92 59,858.74 75,314.95 63,033.43<br />
3 Other Income 147.47 180.98 116.85 328.45 329.53 337.93 371.38<br />
4 Total Expenditure<br />
(Increase) / Decrease in Inventory (1,253.40) (155.56) 18.28 (1,408.96) (34.87) (1,359.64) (68.43)<br />
Consumption of Raw Materials <strong>17</strong>,707.05 7,875.13 4,874.96 25,582.18 20,576.22 29,481.32 23,359.55<br />
Staff Cost 477.92 211.59 241.42 689.51 712.41 701.12 723.08<br />
Purchase of Products for Resale 32,167.93 10,010.19 9,977.93 42,<strong>17</strong>8.12 33,842.86 42,180.80 33,843.49<br />
Other Expenditure 2,249.64 941.81 879.88 3,191.45 2,709.82 3,311.22 2,805.86<br />
51,349.14 18,883.16 15,992.46 70,232.30 57,806.44 74,314.82 60,663.55<br />
5 Interest 100.90 57.84 16.61 158.74 81.64 203.77 133.28<br />
6 Depreciation 515.77 <strong>17</strong>4.46 187.75 690.23 659.59 760.81 736.73<br />
7 Profit /(Loss) before Tax (2+3-4-5-6) (1,616.33) 1,901.43 368.91 285.10 1,640.60 373.48 1,871.25<br />
8 Provision for Taxation - Current (Net) - (141.60) (<strong>17</strong>.45) (141.60) 442.60 (134.34) 454.92<br />
9 Profit/(Loss) after Current Tax (7 - 8) (1,616.33) 2,043.03 386.36 426.70 1,198.00 507.82 1,416.33<br />
10 Provision for Taxation - Deferred Liability/(Asset) (16.89) 26.58 (113.44) 9.69 (79.33) 44.07 0.69<br />
11 Fringe Benefit Tax 8.34 3.04 - 11.38 - 11.68 -<br />
12 Net Profit / (Loss) ( 9 - 10-11) (1,607.78) 2,013.41 499.80 405.63 1,277.33 452.07 1,415.64<br />
13 Paid up Equity Share Capital (Face value Rs.10) 338.94 338.94 338.93 338.94 338.93 338.94 338.93<br />
14 Reserves excluding Revaluation Reserves 8,396.80 8,101.92 8,318.00 7,977.50<br />
15 Earnings Per Share (Rs.) (47.44) 59.40 14.75 11.97 37.69 13.34 41.77<br />
16 Cash Earnings Per Share (Rs.) (32.72) 65.33 16.94 32.62 54.81 37.08 63.53<br />
<strong>17</strong> Aggregate of Non -Promoter Shareholding (Non -Govt.)<br />
No. of Shares 166,253,250 166,253,250 166,253,250 166,253,250 166,253,250 166,253,250 166,253,250<br />
Percentage of Shareholding (%) 48.99 48.99 48.99 48.99 48.99 48.99 48.99<br />
PHYSICAL PERFORMANCE ( in MMT )<br />
Crude Thruput 9.71 4.11 3.19 13.82 13.94<br />
Market Sales (Including Exports) 14.41 5.07 5.12 19.48 20.09<br />
Pipeline Thruput 4.15 1.50 1.44 5.65 6.05<br />
0<br />
Notes :<br />
1 The Board has recommended a dividend of 30%.<br />
2 The Audited Accounts are subject to review by the Comptroller & Auditor General of India under section 619(4) of the Companies Act 1956.<br />
3 The Gross Refining Margins during the year ended 31st March 2006 were US $ 3.22 per BBL (2004-05 US $ 5.60 per BBL) for <strong>Mumbai</strong> Refinery and US $ 2.56 per BBL (2004-05 US<br />
$ 5.06 per BBL) for Visakh Refinery.<br />
4 The prices of LPG (Domestic) and SKO (PDS) are subsidised as per the scheme approved by the Government in January 2003. Subsidy for the current year has been accounted at 1/3rd<br />
of the subsidy rates for 2002-03 as approved by the Government of India.<br />
5 Financial results of the year have been adversely affected due to impact on account of high crude and product prices which could not be fully passed on to the consumers. The under<br />
recovery on HSD, MS, SKO (PDS) and LPG (Domestic) was partially compensated by the upstream oil companies as advised by the Government of India. Accordingly, an amount of Rs.<br />
3221.59 crores (2004-05 : Rs.1278.34 crores) has been accounted for during the year towards discount received from ONGC/GAIL on purchase of Crude Oil / LPG / SKO. Further,<br />
Oil Bonds issued by the Government of India towards under-recoveries suffered by OMCs on sale of sensitive products during 2005-06 for Rs.2344.86 crores (2004-05 : Nil) have been<br />
accounted under ‘Sales/Income from Operations’<br />
6 A net amount of Rs. 435 crores (2004-05: Nil) has been accounted during the current year as discount on MS, HSD, SKO (PDS) and LPG (Domestic) on purchase from refineries.<br />
7 The Consolidated Financial Results have been prepared in line with the requirement of Accounting Standard 21 - 'Consolidated Financial Statements' and Accounting Standard 27 -<br />
'Financial Reporting of Interests in Joint Ventures'.<br />
8 Investor Complaints : Balance as on 01-01-2006 : Nil, Received during the quarter : 3 , Disposed off during the quarter : 2 , Balance as on 31-03-2006 : 1<br />
9 Previous year's figures have been regrouped/reclassified wherever necessary.
SEGMENT-WISE RESULTS<br />
Rs. in Crores<br />
Particulars<br />
(Provisional<br />
(Unaudited) (Unaudited) (Audited)<br />
Unaudited)<br />
(Audited)<br />
Nine Months<br />
Ended<br />
Three Months Ended<br />
Year Ended<br />
Consolidated Results<br />
Year Ended<br />
31.12.2005 31.03.2006 31.03.2005 31.03.2006 31.03.2005 31.03.2006 31.03.2005<br />
1 SEGMENT REVENUE<br />
a) Downstream Petroleum 50,276.97 20,932.70 16,566.85 71,209.67 60,062.60 75,493.25 63,283.91<br />
b) Exploration & Production<br />
of Hydrocarbons - - - - - - -<br />
Sub-Total 50,276.97 20,932.70 16,566.85 71,209.67 60,062.60 75,493.25 63,283.91<br />
Less: Inter-Segment Revenue - - - - - - -<br />
TOTAL REVENUE 50,276.97 20,932.70 16,566.85 71,209.67 60,062.60 75,493.25 63,283.91<br />
2 SEGMENT RESULTS<br />
a) Profit before Tax, Interest<br />
Income, Interest Expenditure<br />
and Dividend from each Segment<br />
i) Downstream Petroleum (1,618.55) 1,919.20 345.60 300.64 1,600.03 431.27 1,879.22<br />
ii) Exploration & Production of<br />
Hydrocarbons (3.50) (8.92) (3.45) (12.42) (3.45) (12.44) (3.45)<br />
Sub-Total of (a) (1,622.05) 1,910.27 342.15 288.22 1,596.58 418.83 1,875.77<br />
b) Interest Expenditure 100.90 57.84 16.61 158.74 81.64 203.77 133.28<br />
c) Other Un-allocable Expenditure<br />
Net of Un-allocable Income (106.62) (49.00) (43.37) (155.62) (125.66) (158.42) (128.76)<br />
Profit before Tax (a-b-c) (1,616.33) 1,901.43 368.91 285.10 1,640.60 373.48 1,871.25<br />
3 CAPITAL EMPLOYED<br />
(Segment Assets- Segment Liabilities)<br />
a) Downstream Petroleum 10,936.06 5,978.47 8,240.32 5,978.47 8,240.32 6,755.33 8,960.52<br />
b) Exploration & Production<br />
of Hydrocarbons (6.95) (15.87) (3.45) (15.87) (3.45) (15.89) (3.45)<br />
c) Others (Unallocated-Corporate) (4,095.78) 2,773.14 203.98 2,773.14 203.98 1,947.46 (616.68)<br />
Total 6,833.33 8,735.74 8,440.85 8,735.74 8,440.85 8,686.90 8,340.39<br />
Notes:<br />
1. The Company is engaged in the following business segments:<br />
a) Downstream i.e. Refining and Marketing of Petroleum Products<br />
b) Exploration and Production of Hydrocarbons<br />
Segments have been identified taking into account the nature of activities and the nature of risks and returns.<br />
2. Segment Revenue comprises the following:<br />
a) Turnover (Net of Excise Duties)<br />
b) Subsidy from Government of India<br />
c) Net Claim/(surrender to) PPAC/GOI<br />
d) Other income (excluding interest income, dividend income and investment income)<br />
3. There are no geographical segments.<br />
The above results have been reviewed and recommended by the Audit Committee and taken on record by the Board of Directors at its meeting held on<br />
May 25, 2006.<br />
By order of the Board<br />
Place : New Delhi<br />
C. Ramulu<br />
Date : May 25, 2006 Director (Finance)