The perception of articulation rate
The perception of articulation rate
The perception of articulation rate

Create successful ePaper yourself
Turn your PDF publications into a flip-book with our unique Google optimized e-Paper software.
3. RESULTS AND DISCUSSION<br />
In order to evaluate whether <strong>rate</strong> <strong>perception</strong> is affected<br />
by the measured <strong>rate</strong>s, the 15 stimulus pair categories are<br />
divided into four sets according to their intended and<br />
realised phone <strong>rate</strong>s (cf. Fig. 1). In set A, both the<br />
intended and the realised phone <strong>rate</strong>s <strong>of</strong> the two phrases<br />
in a stimulus pair differ. In set B, the two phrases differ<br />
only in their realised <strong>rate</strong>, while in set C there is only a<br />
difference in intended <strong>rate</strong>. In set D, finally, both the<br />
intended and realised phone <strong>rate</strong>s are the same (see<br />
Table 1).<br />
75% n=656<br />
50%<br />
25%<br />
n=19<br />
0%<br />
75%<br />
A<br />
n=125<br />
C<br />
n=138<br />
n=23<br />
B<br />
n=139<br />
D<br />
cond.<br />
int.<br />
<strong>rate</strong><br />
real.<br />
<strong>rate</strong><br />
#judgements<br />
compared <strong>rate</strong> categories<br />
A diff diff 800 FC-NCf, FC-NCs, FC-NS,<br />
FC-SC, FS-NS, FS-SC, NCf-<br />
SC, NCs-SC<br />
B same diff 300 FC-FS, NCf-NS, NCs-NS<br />
C diff same 300 FS-NCf, FS-NCs, NS-SC<br />
D same same 100 NCf-NCs<br />
Table 1: Intended and realised <strong>rate</strong>s for 4 conditions<br />
(see text), with the number <strong>of</strong> listener judgements<br />
and the compared <strong>rate</strong> conditions (cf. Fig. 1)<br />
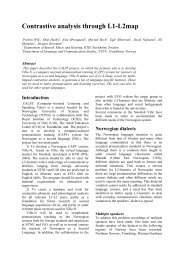
<strong>The</strong> perceived <strong>rate</strong> distinctions are shown in Fig. 2 for<br />
each <strong>of</strong> the four sets. <strong>The</strong> responses were recoded so that<br />
the first stimulus <strong>of</strong> each pair always represents a faster<br />
intended and/or realised phone <strong>rate</strong>, although the actual<br />
order was always cross-balanced in the experiment. <strong>The</strong><br />
response "first stimulus faster" (black columns) should<br />
therefore be expected if one <strong>of</strong> the measured phone <strong>rate</strong>s<br />
determines <strong>rate</strong> <strong>perception</strong>, except in Fig. 2D, where<br />
there is no <strong>rate</strong> difference between the stimuli. Fig. 2A<br />
shows that listeners clearly perceive the expected <strong>rate</strong><br />
difference if both the intended and realised <strong>rate</strong>s <strong>of</strong> the<br />
two IP's differ (82% "stim1 faster" responses), with<br />
relatively few "equal" responses (16%). More "equal"<br />
and fewer "stim1 faster" responses are given when only<br />
one <strong>of</strong> the two measured phone <strong>rate</strong>s differs for the two<br />
IP's (Fig. 2B and 2C), with somewhat more "equal" and<br />
fewer "stim1 faster" responses when there is a difference<br />
in realised rather than intended <strong>rate</strong>. <strong>The</strong> lower realised<br />
<strong>rate</strong> <strong>of</strong> the (recoded) second stimulus in each <strong>of</strong> the pairs<br />
represented in Fig. 2B causes it to be perceived as slower<br />
than the first stimulus, despite equal intended <strong>rate</strong>s. This<br />
shows that there is an effect <strong>of</strong> surface <strong>rate</strong>. In Fig. 2C,<br />
the first stimulus has a higher intended phone <strong>rate</strong> than<br />
the second stimulus and is perceived as faster, despite<br />
equal realised <strong>rate</strong>s. This therefore shows that there is<br />
also an underlying <strong>rate</strong> effect. Articulator speed,<br />
reflected in the surface or realised <strong>rate</strong>, and knowledge<br />
<strong>of</strong> the underlying or canonical form, reflected in the<br />
intended <strong>rate</strong>, therefore play a role in the <strong>perception</strong> <strong>of</strong><br />
speaking <strong>rate</strong>.<br />
<strong>The</strong> relative differences between Figs. 2B and 2C (more<br />
"stim1 faster" and fewer "equal" responses in Fig. 2C)<br />
should not be taken as an indication that the intended<br />
50%<br />
25%<br />
0%<br />
n=165<br />
n=25<br />
stim1 faster stim2 faster<br />
response<br />
n=110<br />
equal<br />
n=21<br />
n=32<br />
stim1 faster stim2 faster<br />
response<br />
n=47<br />
equal<br />
Figure 2: Listener responses (percentages) to<br />
stimuli with different intended and realised <strong>rate</strong>s<br />
(A), only different realised <strong>rate</strong>s (B) or intended<br />
<strong>rate</strong>s (C), or with both equal (D).<br />
<strong>rate</strong> is <strong>of</strong> greater importance for <strong>rate</strong> <strong>perception</strong> than the<br />
realised <strong>rate</strong>, since the differences in <strong>rate</strong> values in terms<br />
<strong>of</strong> their variation (i.e. in terms <strong>of</strong> z-scores) are not<br />
identical in this study. As expected, when both the<br />
intended and the realised <strong>rate</strong>s <strong>of</strong> the two phrases in the<br />
stimulus pair are the same (Fig. 2D), the highest<br />
percentage <strong>of</strong> "equal" reponses are given 2 (comparable to<br />
when there is only a difference in realised <strong>rate</strong>), and<br />
there is no clear tendency for one <strong>of</strong> the stimuli to be<br />
perceived as faster.<br />
<strong>The</strong> clear perceptual effect <strong>of</strong> differences in intended and<br />
realised <strong>rate</strong>s is consistently reproduced when we<br />
compare each two <strong>rate</strong> categories in Fig. 3 (next page).<br />
<strong>The</strong>re are no qualitative differences in <strong>rate</strong> <strong>perception</strong> in<br />
the upper half <strong>of</strong> the intended <strong>rate</strong> range (dashed graphs)<br />
compared to the lower half <strong>of</strong> the range (dotted graphs).<br />
This seems to indicate that the stronger system-oriented<br />
constraints in fast hyperspeech do not lead the listener to<br />
judge speaking <strong>rate</strong> differently at high <strong>articulation</strong> <strong>rate</strong>s<br />
from clear speech at normal and slow intended <strong>rate</strong>s. <strong>The</strong><br />
deletion <strong>of</strong> phones at normal speaking <strong>rate</strong>, too, has no<br />
qualitatively different effect on the <strong>perception</strong> <strong>of</strong><br />
speaking <strong>rate</strong> from phone deletion at fast speaking <strong>rate</strong>s,<br />
although sloppiness at normal intended <strong>rate</strong>s can be<br />
considered as a clear indication <strong>of</strong> extremely lax system<br />
constraints.<br />
2 <strong>The</strong> reason why there are many "stim1 faster" and "stim2<br />
faster" responses instead <strong>of</strong> only "equal" responses is<br />
probably that the listeners are induced by the task to choose<br />
one <strong>of</strong> the two stimulus as faster.