The perception of articulation rate
The perception of articulation rate
The perception of articulation rate

Create successful ePaper yourself
Turn your PDF publications into a flip-book with our unique Google optimized e-Paper software.
FS<br />
NCf<br />
phone <strong>rate</strong>s, with a low phone deletion <strong>rate</strong><br />
(maximally 8%). <strong>The</strong> realised phone <strong>rate</strong>s <strong>of</strong><br />
these phrases were about 2-3 standard deviations<br />
above the mean.<br />
<strong>The</strong> intended phone <strong>rate</strong>s for the fast but sloppy<br />
phrases were similar to those <strong>of</strong> the clear phrases,<br />
but 35–40% <strong>of</strong> the intended phones were not<br />
realised. <strong>The</strong> realised phone <strong>rate</strong> was therefore<br />
much lower than in the fast, clear category,<br />
namely within one standard deviation <strong>of</strong> the mean<br />
(all above the mean, except for two phrases).<br />
A third category <strong>of</strong> clearly spoken phrases was<br />
selected, with intended and realised phone <strong>rate</strong>s<br />
similar to the realised phone <strong>rate</strong>s <strong>of</strong> the fast,<br />
sloppy speech. <strong>The</strong> percentage <strong>of</strong> phone deletions<br />
was comparable to that in the FC category. <strong>The</strong><br />
intended phone <strong>rate</strong>s were within about 0.5<br />
standard deviation from the mean. This category<br />
is named normal, clear phrases for comparison<br />
with fast intended phrases (NCf).<br />
As we noted above, output-oriented constraints can lead<br />
a speaker to slow his speech down or increase articulator<br />
speed in order to prevent undershoot [12]. Since at fast<br />
intended <strong>articulation</strong> <strong>rate</strong>s the inertia <strong>of</strong> the articulators<br />
(which itself is constant) creates a strong force to slow<br />
down or reduce phones, the lack <strong>of</strong> phone deletions in<br />
category FC is taken as a sign <strong>of</strong> strong output-oriented<br />
constraints and therefore a clear case <strong>of</strong> hyperspeech.<br />
Conversely, the deletion <strong>of</strong> phones at slower speaking<br />
<strong>rate</strong>s is a sign <strong>of</strong> extremely lax output constraints,<br />
allowing system-oriented constraints to induce<br />
hypospeech (category NS below). In order to evaluate<br />
whether the different relative weight <strong>of</strong> output and<br />
system constraints is taken into account by the listener in<br />
his judgment <strong>of</strong> speaking <strong>rate</strong>, another set <strong>of</strong> stimuli was<br />
selected from the slower half <strong>of</strong> the intended <strong>articulation</strong><br />
<strong>rate</strong> range (normal to slow):<br />
NCs Normal, clearly spoken phrases were selected<br />
with similar intended and realised phone <strong>rate</strong>s to<br />
those <strong>of</strong> the NCf category (but with all intended<br />
phones being realised), but the phrases were<br />
different ones. This was done in order to provide<br />
an optimal match with the phrases in the two<br />
categories below.<br />
NS<br />
SC<br />
Normal but sloppy intonation phrases showed<br />
phone deletion <strong>rate</strong>s between 35–40% (as in the<br />
FS category). This resulted in fairly slow realised<br />
phone <strong>rate</strong>s between –0.5 and –1.5 standard<br />
deviations from the mean.<br />
Finally, slow, but clear phrases were selected. <strong>The</strong><br />
phrases were matched to the NS phrases in their<br />
realised <strong>articulation</strong> <strong>rate</strong>s. <strong>The</strong> intended phone<br />
<strong>rate</strong>s are between –1 and –2 standard deviations<br />
from the mean.<br />
All possible combinations <strong>of</strong> the 6 categories were<br />
compared, giving 15 comparisons. Five sets <strong>of</strong> 6 phrases<br />
mean intended <strong>rate</strong> (phones/sec)<br />
24<br />
22<br />
20<br />
18<br />
16<br />
14<br />
12<br />
10<br />
8<br />
fc<br />
fs<br />
ncf<br />
category<br />
were selected from the database. <strong>The</strong> total number <strong>of</strong><br />
stimulus pairs was therefore 5 (sets) x 15 (comparisons)<br />
= 75 per listener. <strong>The</strong> word content <strong>of</strong> the phrases was<br />
always different and with a few exceptions they were all<br />
produced by different speakers. <strong>The</strong> stimulus pairs were<br />
<strong>of</strong>fered in pseudo-randomised order. Ten female and ten<br />
male listeners with no hearing or language deficiencies<br />
aged between 20 and 59 (average: 30) participated in the<br />
listening test. <strong>The</strong> listeners were divided into two equal<br />
groups, which heard the stimuli within each pair in<br />
opposite orders. <strong>The</strong> stimuli were preceded and<br />
followed by filler items. In addition, they were mixed<br />
with a small number <strong>of</strong> similar phrases not used for this<br />
study.<br />
<strong>The</strong> "Experimenter" s<strong>of</strong>tware [13] was used to carry out<br />
the listening experiment. <strong>The</strong> stimuli, which had been set<br />
to equal loudness levels 1 , were played to the listeners<br />
over headphones in a sound-treated room at a selfselected<br />
comfortable loudness level. <strong>The</strong> stimuli were<br />
displayed orthographically on a computer screen for 3.5<br />
seconds, followed by a beep and a silent pause <strong>of</strong> 0.5<br />
seconds. <strong>The</strong>n the stimulus pair was played, sepa<strong>rate</strong>d by<br />
a silence interval <strong>of</strong> 0.5 seconds. <strong>The</strong> subject then had 5<br />
seconds to respond by pressing one <strong>of</strong> three keys on the<br />
keyboard for "first phrase faster", "second phrase faster"<br />
or "both phrases are equally fast". Response times were<br />
also registered, but not used in the present analysis.<br />
ncs<br />
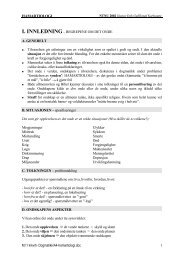
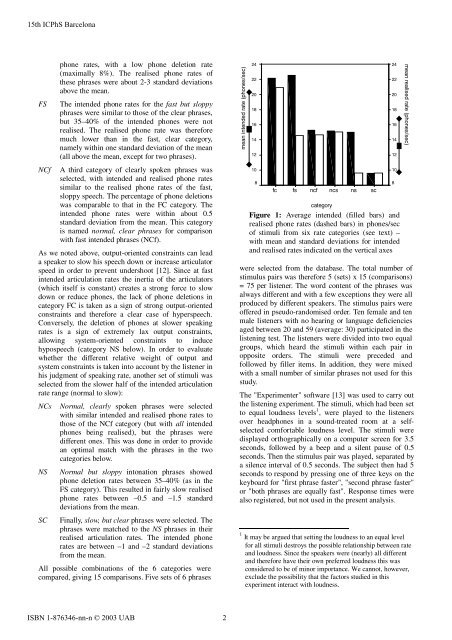
Figure 1: Average intended (filled bars) and<br />
realised phone <strong>rate</strong>s (dashed bars) in phones/sec<br />
<strong>of</strong> stimuli from six <strong>rate</strong> categories (see text) –<br />
with mean and standard deviations for intended<br />
and realised <strong>rate</strong>s indicated on the vertical axes<br />
1 It may be argued that setting the loudness to an equal level<br />
for all stimuli destroys the possible relationship between <strong>rate</strong><br />
and loudness. Since the speakers were (nearly) all different<br />
and therefore have their own preferred loudness this was<br />
considered to be <strong>of</strong> minor importance. We cannot, however,<br />
exclude the possibility that the factors studied in this<br />
experiment interact with loudness.<br />
ns<br />
sc<br />
24<br />
22<br />
20<br />
18<br />
16<br />
14<br />
12<br />
10<br />
8<br />
mean realised <strong>rate</strong> (phones/sec)