Archaeological_Applications_of_JIBS_Data_Progress_Report_09.pdf
Archaeological_Applications_of_JIBS_Data_Progress_Report_09.pdf
Archaeological_Applications_of_JIBS_Data_Progress_Report_09.pdf

Create successful ePaper yourself
Turn your PDF publications into a flip-book with our unique Google optimized e-Paper software.
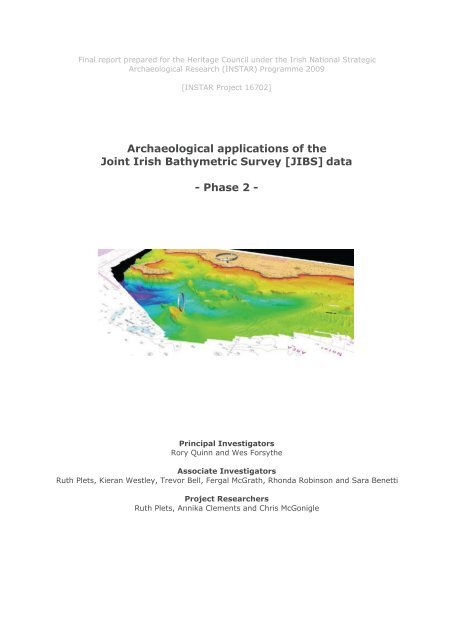
Final report prepared for the Heritage Council under the Irish National Strategic<br />
<strong>Archaeological</strong> Research (INSTAR) Programme 2009<br />
[INSTAR Project 16702]<br />
<strong>Archaeological</strong> applications <strong>of</strong> the<br />
Joint Irish Bathymetric Survey [<strong>JIBS</strong>] data<br />
- Phase 2 -<br />
Principal Investigators<br />
Rory Quinn and Wes Forsythe<br />
Associate Investigators<br />
Ruth Plets, Kieran Westley, Trevor Bell, Fergal McGrath, Rhonda Robinson and Sara Benetti<br />
Project Researchers<br />
Ruth Plets, Annika Clements and Chris McGonigle
INSTAR Project 16702: <strong>Archaeological</strong> applications <strong>of</strong> the Joint Irish Bathymetric Survey [<strong>JIBS</strong>] data<br />
CONTENTS<br />
Section<br />
Page<br />
1 INVESTIGATORS 3<br />
2 INTRODUCTION<br />
[2.1] Background and motivation<br />
[2.2] Aims and objectives<br />
[2.3] Research questions<br />
3 THEORETICAL FRAMEWORK<br />
[3.1] Shipwreck archaeology<br />
[3.2] Submerged landscape archaeology<br />
4 DATA SETS<br />
[4.1] <strong>JIBS</strong> data<br />
[4.2] Shipwrecks<br />
[4.3] Submerged landscapes<br />
5 METHODOLOGY<br />
[5.1] Production <strong>of</strong> 1m resolution DEM<br />
[5.2] FM Geocoder processing <strong>of</strong> backscatter<br />
[5.3] Automated segmentation <strong>of</strong> backscatter<br />
[5.4] Seismic integration into SMT Kingdom Suite<br />
[5.5] GIS - spatial integration <strong>of</strong> data sets<br />
6 RESULTS<br />
[6.1] Refining palaeo-geographies – The Skerries<br />
[6.2] Target sites for direct sampling<br />
[6.3] Refining site formation models and site IDs<br />
[6.4] Dissemination <strong>of</strong> results<br />
7 IMPACT OF THE PROJECT<br />
[7.1] Impact on teaching<br />
[7.2] Impact on research<br />
[7.3] Impact on practise<br />
5<br />
5<br />
10<br />
11<br />
14<br />
17<br />
25<br />
26<br />
27<br />
29<br />
32<br />
40<br />
43<br />
49<br />
53<br />
60<br />
61<br />
101<br />
104<br />
104<br />
104<br />
8 SCHEDULE OF EXPENDITURE 106<br />
9 REFERENCES 107<br />
APPENDICES<br />
[ 2 ]
INSTAR Project 16702: <strong>Archaeological</strong> applications <strong>of</strong> the Joint Irish Bathymetric Survey [<strong>JIBS</strong>] data<br />
1. INVESTIGATORS<br />
Principal Investigators: Rory Quinn 1 and Wes Forsythe 1<br />
Associate Investigators: Fergal McGrath 2 , Sara Benetti 5 , Rhonda Robinson 3 , Ruth Plets 1 ,<br />
Kieran Westley 1 and Trevor Bell 4<br />
Project Researchers: Ruth Plets, Annika Clements and Chris McGonigle<br />
1 Centre for Maritime Archaeology, University <strong>of</strong> Ulster (UU), Northern Ireland<br />
2 Marine Institute (MI), Galway, Ireland<br />
3 Northern Ireland Environment Agency (NIEA), DoE, Northern Ireland<br />
4<br />
Department <strong>of</strong> Geography, Memorial University <strong>of</strong> Newfoundland (MUN), Canada<br />
5 School <strong>of</strong> Environmental Sciences, University <strong>of</strong> Ulster (UU), Northern Ireland<br />
Rory Quinn is a Senior Lecturer in marine geoarchaeology at UU with 15 years<br />
experience in the acquisition, processing and interpretation <strong>of</strong> high-resolution marine<br />
sonar data for archaeological investigations. He has participated in shipwreck and<br />
submerged landscape projects in Ireland, UK, East Africa and Canada, and is currently a<br />
Coracle Research Fellow in submerged landscapes with Memorial University <strong>of</strong><br />
Newfoundland, on the co-ordinating committee <strong>of</strong> the Submerged Landscapes<br />
<strong>Archaeological</strong> Network and on the editorial board <strong>of</strong> the Journal <strong>of</strong> the North Atlantic.<br />
Wes Forsythe is a Lecturer in maritime archaeology at UU with 10 years experience <strong>of</strong><br />
coastal, intertidal and underwater work in Ireland and abroad. He has worked for state<br />
heritage agencies in the Republic and Northern Ireland and has had direct involvement<br />
with both the issues facing management in the marine environment and research needs<br />
in this field. His research work has varied from studies <strong>of</strong> submerged Late Mesolithic<br />
forests to macro- and micro-scale investigations <strong>of</strong> Ireland's shipwrecks. He has directed<br />
four major maritime archaeology research programmes and contributed to many others<br />
from inception to publication.<br />
Ruth Plets, a Research Associate in marine geoarchaeology at UU, obtained her first<br />
degree in marine geology at Ghent University (Belgium) before studying for an MSc in<br />
Oceanography and PhD at Southampton University. As part <strong>of</strong> her PhD, she looked at<br />
how high-resolution marine geophysical techniques can be used to image, characterize<br />
and visualize archaeological material, including both shipwrecks and submerged<br />
landscapes. Her research interests lie in sedimentology, high-resolution geophysics and<br />
marine geoarchaeology.<br />
Annika Clements, a Research Associate in Marine GIS at UU, obtained a BSc in Biological<br />
Sciences at the University <strong>of</strong> Oxford and an MSc in Oceanography at the University <strong>of</strong><br />
Southampton. Annika specialises in Marine GIS applications, with research interests in<br />
seabed mapping, marine habitat characterisation and mapping (subtidal benthos) using<br />
underwater acoustics, underwater video techniques and fisheries research.<br />
Kieran Westley, a Research Associate in maritime archaeology at UU, studied for his<br />
undergraduate degree in Archaeology and Anthropology at Cambridge University, before<br />
going to Southampton University to do an MA in Maritime Archaeology followed by a PhD.<br />
His PhD focussed on coastal environmental changes and how they may have affected the<br />
migration and dispersal patterns <strong>of</strong> prehistoric humans. His broader research interests lie in<br />
the archaeology <strong>of</strong> continental shelves, in particular the role <strong>of</strong> coastlines in prehistory and<br />
the archaeological potential <strong>of</strong> submerged landscapes. Common to both is the extensive use<br />
<strong>of</strong> palaeo-environmental data alongside the archaeological evidence in order to examine the<br />
effect <strong>of</strong> changing climates, sea-levels and landscapes on prehistoric societies, and also to<br />
locate and study archaeological sites that have been inundated by sea-level rise.<br />
[ 3 ]
INSTAR Project 16702: <strong>Archaeological</strong> applications <strong>of</strong> the Joint Irish Bathymetric Survey [<strong>JIBS</strong>] data<br />
Chris McGonigle obtained a BSc in Marine Science at UU. He specialises in Marine GIS<br />
applications, with research interests in seabed mapping and backscatter segmentation, with<br />
particular reference to habitat characterisation.<br />
Fergal McGrath is Team Leader <strong>of</strong> the Advanced Mapping Services at the MI. He is<br />
Project Manager for the MI contribution to the Joint Irish Bathymetric Survey (<strong>JIBS</strong>), an<br />
INTERREG III funded cross-border program led by the Maritime and Coastguard Agency<br />
and is currently involved in project and data management <strong>of</strong> the national marine<br />
mapping programme (INFOMAR). Fergal has 10 years experience in marine geophysical,<br />
geological, geotechnical and hydrographic data acquisition, processing and interpretation,<br />
including site and debris clearance surveys, pipeline/cable route surveys, seismic<br />
prospecting and geohazard investigation surveys in the North Sea, West Africa, Gulf Of<br />
Mexico, Caspian Sea and South Atlantic.<br />
Sara Benetti is a Lecturer in Environmental Change at UU, researching abrupt and longterm<br />
climatic change and its effects on sedimentological processes in the context <strong>of</strong><br />
glacial/interglacial cycles. Sara has previous experience with the British Antarctic Survey,<br />
the National Oceanography Centre (UK), Woods Hole (USA) and the Bedford Institute <strong>of</strong><br />
Oceanography (Canada).<br />
Rhonda Robinson has worked for the Northern Ireland Environment Agency for 12<br />
years. Rhonda is a Senior Inspector with management responsibility for the Maritime<br />
Archaeology branch <strong>of</strong> the Service. In addition, she deals with all issues relating to<br />
archaeological management within the broader North Coast area. She has extensive<br />
experience in GIS analysis and <strong>of</strong> archival management, including digital resources.<br />
Trevor Bell is Pr<strong>of</strong>essor <strong>of</strong> Physical Geography at MUN who studies landscape and seabed<br />
history from a variety <strong>of</strong> perspectives to address a range <strong>of</strong> research questions from<br />
theoretical to applied. His approach is strongly interdisciplinary and collaborative, involving<br />
analysis and expertise from a range <strong>of</strong> disciplines in the earth, life and social sciences. His<br />
current project titles illustrate this approach and provide a general picture <strong>of</strong> my research<br />
pursuits: Dynamics <strong>of</strong> the Newfoundland Ice Cap; Mapping postglacial sea levels and<br />
submerged landscapes; Prehistoric settlement, subsistence and environment in<br />
Newfoundland; Multibeam bathymetric mapping for seabed morphology and habitat<br />
classification; Climate sensitivity <strong>of</strong> tundra and boreal ecosystems in Labrador highlands,<br />
and Climate-change impacts in Arctic coastal communities.<br />
[ 4 ]
INSTAR Project 16702: <strong>Archaeological</strong> applications <strong>of</strong> the Joint Irish Bathymetric Survey [<strong>JIBS</strong>] data<br />
2. INTRODUCTION<br />
2.1 Background and motivation<br />
To address the need for high-resolution bathymetric data <strong>of</strong>f the north coast <strong>of</strong> Ireland, the<br />
Joint Irish Bathymetric Survey (<strong>JIBS</strong>) was instigated as a partnership between the Maritime<br />
and Coastguard Agency (MCA) and the Marine Institute (MI), under INTERREG IIIA<br />
( 2,133,508). The <strong>JIBS</strong> project commenced in April 2007 and was completed in September<br />
2008, providing 100% multi-beam bathymetry coverage (Figure 2.1) within the 3nm<br />
coastal strip from the Fanad Peninsula (Co. Donegal) to Fair Head (Co. Antrim).<br />
Under INSTAR 2008, Phase 1 <strong>of</strong> this project (<strong>Archaeological</strong> applications <strong>of</strong> the Joint Irish<br />
Bathymetric Survey data) was funded to assess the <strong>JIBS</strong> data for archaeological<br />
applications. The objectives <strong>of</strong> this feasibility study were four-fold: [1] to develop a GIS for<br />
the study area comprising extant and new (<strong>JIBS</strong>) data, [2] to assess the viability <strong>of</strong><br />
interpreting and mapping palaeo-shoreline features from the <strong>JIBS</strong> data in the context <strong>of</strong><br />
past sea-level change [3] to record the locations and seabed conditions <strong>of</strong> wreck sites in the<br />
study area, and [4] to provide Government agencies with baseline data and<br />
recommendations for managing submerged archaeological sites. The final project report for<br />
Phase 1 <strong>of</strong> the project was submitted to the Heritage Council in December 2008.<br />
Figure 2.1 Coverage <strong>of</strong> the <strong>JIBS</strong> survey from Fanad Peninsula in the west to Fair Head in<br />
the east.<br />
Phase 1, the feasibility study, proved beyond any doubt that the archaeological<br />
applications <strong>of</strong> the <strong>JIBS</strong> data are many. While the quality and resolution <strong>of</strong> the <strong>JIBS</strong> data<br />
proved even better than expected, interpretation <strong>of</strong> these data uncovered many<br />
previously unrecorded submerged sites <strong>of</strong> archaeological potential. For example,<br />
research undertaken as part <strong>of</strong> Phase 1 successfully catalogued and identified palaeolandscape<br />
features, including a series <strong>of</strong> geomorphic signatures relating to submerged<br />
palaeo-landscapes (Figures 2.2 and 2.3). This phase also facilitated preliminary coarse<br />
[ 5 ]
INSTAR Project 16702: <strong>Archaeological</strong> applications <strong>of</strong> the Joint Irish Bathymetric Survey [<strong>JIBS</strong>] data<br />
palaeo-geographic reconstructions for the entire study area by integrating the <strong>JIBS</strong> data<br />
with information from sea-level studies and glacio-isostatic modeling (Figures 2.4 to 2.7).<br />
Figure 2.2 Relict beach ridge <strong>of</strong>f Runkerry submerged in 8m water depth.<br />
Figure 2.3 Palaeo-seacliffs and possible submerged wave-cut terrace <strong>of</strong>f Bengore Head.<br />
[ 6 ]
INSTAR Project 16702: <strong>Archaeological</strong> applications <strong>of</strong> the Joint Irish Bathymetric Survey [<strong>JIBS</strong>] data<br />
Figure 2.4 Overview <strong>of</strong> the study area coloured to represent the sea-level lowstand <strong>of</strong> -<br />
30m identified by Kelley et al (2006). Offshore bathymetry is provided by the <strong>JIBS</strong><br />
multibeam data, terrestrial topography is provided by the SRTM digital elevation model.<br />
At this stage, Loughs Swilly and Foyle would have been freshwater or lagoonal systems,<br />
providing sheltered areas for resource exploitation.<br />
[ 7 ]
INSTAR Project 16702: <strong>Archaeological</strong> applications <strong>of</strong> the Joint Irish Bathymetric Survey [<strong>JIBS</strong>] data<br />
Figure 2.5 Palaeo-geographic reconstruction <strong>of</strong> Lough Swilly assuming a sea-level<br />
lowstand <strong>of</strong> -30m (Kelley et al, 2006). At this depth, the sea lough is transformed into an<br />
inland river valley or lake basin. The black areas in the littoral zone correspond to areas<br />
<strong>of</strong> no data.<br />
[8]
INSTAR Project 16702: <strong>Archaeological</strong> applications <strong>of</strong> the Joint Irish Bathymetric Survey [<strong>JIBS</strong>] data<br />
Figure 2.6 Palaeo-geographic reconstruction <strong>of</strong> the Skerries assuming a sea-level<br />
lowstand <strong>of</strong> -30m (Kelley et al, 2006). At this depth, the modern reefs and rocks form<br />
the shoreline <strong>of</strong> an extended coastal plain.<br />
[9]
INSTAR Project 16702: <strong>Archaeological</strong> applications <strong>of</strong> the Joint Irish Bathymetric Survey [<strong>JIBS</strong>] data<br />
Figure 2.7 Palaeo-geographic reconstruction <strong>of</strong> Rathlin Island assuming a sea-level<br />
lowstand <strong>of</strong> -30m. Note there is relatively little change to the island’s eastern and<br />
northern shores where bathymetric gradient is steep. However, the lower-lying southern<br />
portion <strong>of</strong> the island is extended by hundreds <strong>of</strong> metres to several kilometres.<br />
The provision <strong>of</strong> the <strong>JIBS</strong> data also presents a unique opportunity to address issues<br />
relating to the nature and extent <strong>of</strong> the wreck resource <strong>of</strong>f the north coast, allowing for a<br />
unique study into shipwreck site formation processes at previously unattainable<br />
resolutions over a large geographic area. For example, work undertaken in Phase 1<br />
queried current entries in the existing Maritime Sites and Monuments Record (MSMR)<br />
against the multibeam data and screened the data for unrecorded wreck sites to provide<br />
more accurate positional information (Figure 2.8). A database comprising in excess <strong>of</strong><br />
200 anomalies <strong>of</strong> archaeological potential was constructed (Figure 2.9), with the majority<br />
<strong>of</strong> these anomalies corresponding to previously unrecorded wreck sites. In addition,<br />
preliminary observations were made on general wreck distribution and <strong>of</strong> the broader<br />
environmental context (sediment type, hydrodynamic conditions) <strong>of</strong> the anomalies, the<br />
first step in producing more detailed site formation models (Figure 2.10).<br />
2.2 Phase 2 - Aims and objectives<br />
Phase 2 <strong>of</strong> the project was awarded funding in May 2009. Objectives for Phase 2 are sixfold:<br />
[10]
INSTAR Project 16702: <strong>Archaeological</strong> applications <strong>of</strong> the Joint Irish Bathymetric Survey [<strong>JIBS</strong>] data<br />
[1] To better constrain and/or verify palaeo-landscape interpretations from Phase 1 with<br />
extant seismic data.<br />
[2] To produce high-resolution palaeo-geographic reconstructions <strong>of</strong> areas identified as<br />
having high archaeological potential. These reconstructions will be done at 1,000-year<br />
time steps, from 14,000 years ago to present.<br />
[3] To identify targets in these landscapes for future marine coring programmes (e.g.<br />
Marine Institute Shiptime Programme).<br />
[4] To re-assess anomalies identified in Phase 1 so as to confine the research <strong>of</strong> Phase 2<br />
to sites positively identified as shipwrecks.<br />
[5] To produce Digital Elevation Models (DEMs) for each wreck site using the highestresolution<br />
(maximum 10cm) sonar data.<br />
[6] The final objective involves the dissemination <strong>of</strong> results, including distribution <strong>of</strong> the<br />
Heritage Council report and dissemination <strong>of</strong> the compiled databases to relevant<br />
Government agencies.<br />
2.3 Central research questions<br />
[1] What evidence is there for past sea-level change and remnants <strong>of</strong> palaeo-landsurfaces<br />
(e.g. lagoons, palaeo-channels) <strong>of</strong>f the north coast? What are the implications<br />
for the Mesolithic colonization?<br />
[2] What is the potential submerged human settlement <strong>of</strong>f the north coast <strong>of</strong> Ireland,<br />
particularly within the previously identified 30m lowstand?<br />
[3] What is the evidence for previously unknown archaeological sites, in particular<br />
shipwrecks? Do these sites pre-date the earliest known wrecks on this shore (1588)?<br />
[4] What is the extent <strong>of</strong> evidence for shipwrecking and how does this evidence correlate<br />
with the respective national shipwreck databases?<br />
[5] What is the archaeological evidence from known hazards for shipping (e.g.<br />
submerged rocks and sandbanks), in particular those associated with potential votive<br />
deposits?<br />
Figure 2.8 Overview GIS map <strong>of</strong> study area showing the relevant Admiralty Charts,<br />
colour-coded <strong>JIBS</strong> multibeam data, MSMR entries, shipwrecks known to sports divers and<br />
anomalies detected on <strong>JIBS</strong> data during Phase 1.<br />
[11]
Figure 2.9 Classification scheme <strong>of</strong> anomalies as potential shipwrecks used during<br />
Phase 1 <strong>of</strong> the project. (A) Probable wreck; (B) Possible wrecks (may be geological<br />
feature); (C) Possible wreck (may be data processing artefact). The easternmost wreck<br />
in Figure A is S.S. Lugano (1917). All other sites are unidentified.
INSTAR Project 16702: <strong>Archaeological</strong> applications <strong>of</strong> the Joint Irish Bathymetric Survey [<strong>JIBS</strong>] data<br />
Figure 2.10 Some results from Phase 1: (A) Scour features and 700m-long depositional<br />
feature associated with possible wreck indicates NE-SW direction <strong>of</strong> bottom currents. (B)<br />
Bedforms north <strong>of</strong> the possible shipwreck indicate an average W-E direction <strong>of</strong> bottom<br />
current. This wreck is located in a bowl shaped scour pit that opens into a deeper<br />
channel to the north.<br />
[ 13 ]
INSTAR Project 16702: <strong>Archaeological</strong> applications <strong>of</strong> the Joint Irish Bathymetric Survey [<strong>JIBS</strong>] data<br />
3. THEORETICAL FRAMEWORK<br />
3.1 Shipwreck<br />
Wreck sites are generally defined as sunken ships and aircraft, and any material<br />
associated with such vessels. For this report in particular, wreck sites will be<br />
synonymous with shipwrecks and their associated materials, unless stated otherwise.<br />
Shipwrecks are time capsules that not only provide a detailed image <strong>of</strong> the lives and<br />
work conditions <strong>of</strong> the people onboard the ship, but they also <strong>of</strong>fer an insight into the<br />
broader social, economic and political history <strong>of</strong> a nation. Furthermore, artefacts found in<br />
association with shipwrecks, which are not necessarily unique to maritime sites (e.g.<br />
pottery, crockery, clothing, food, etc.), can complement the terrestrial record due to the<br />
difference in preservation conditions on or in the seabed compared to typical terrestrial<br />
environments. This is particularly true if artefacts have been preserved under anaerobic<br />
marine conditions (e.g. buried in estuarine silts and muds). In Ireland, however, a<br />
misconception has existed for a long time that preservation conditions around the<br />
dynamic Irish coast would be unfavourable for the survival <strong>of</strong> any underwater remains<br />
and that, if any did survive, they would be <strong>of</strong> little importance (Breen, 1996). As an<br />
example, the discovery <strong>of</strong> three Spanish Armada wrecks <strong>of</strong>f the coast were originally<br />
seen as an exception to this rule and it was felt that these vessels had little to do with<br />
Irish history but were there by chance (Breen, 1996). The northern coast in particular is<br />
exposed to high wave states and storm activity, resulting in the dominance <strong>of</strong> coarsegrained<br />
seabed substrates, making shipwreck preservation generally unfavourable.<br />
However, deep recesses in the northern Irish coastline together with high bathymetric<br />
relief and the presence <strong>of</strong> estuaries, means micro-environments with higher<br />
archaeological preservation potential do exist (Wheeler, 2002).<br />
Continuous advances in technology, especially the development <strong>of</strong> SCUBA gear in the<br />
1960s and constant improvements <strong>of</strong> high-resolution marine geophysical methods in the<br />
1990s, have meant that increased numbers <strong>of</strong> maritime archaeological sites with high<br />
preservation potential have been discovered, located and imaged <strong>of</strong>f the Irish coast. This<br />
should come as no surprise. People have lived on and around the Irish coast for over<br />
9,000 years, exploiting its resources and using the sea as a means <strong>of</strong> transport and<br />
communication (Breen and Forsythe, 2004). Furthermore, Ireland’s strategic position as<br />
an island on the edge <strong>of</strong> western Europe was one <strong>of</strong> the determining factors in the<br />
development <strong>of</strong> the nation as its location proved advantageous in military and defensive<br />
terms, later resulting in Ireland becoming a focal point for English naval activity (Breen,<br />
1996; Breen and Forsythe, 2001). Consequently, the sea has always played an<br />
important role in the country’s economic and political landscape and relicts <strong>of</strong> this are<br />
bound to be found on the seabed.<br />
Boats and ships have always played an important role in the lives <strong>of</strong> coastal people<br />
whether they were used as a means <strong>of</strong> transport and trade or a means <strong>of</strong> making a<br />
living. For Ireland in particular, early Mesolithic colonists must have travelled across a<br />
stretch <strong>of</strong> open water as early as 10,000 years ago using some sort <strong>of</strong> vessel to reach<br />
the Irish coast. Hence, a boat building tradition appears to have been part <strong>of</strong> Irish life<br />
since its earliest occupation. The nature <strong>of</strong> the vessels varied in different parts <strong>of</strong> the<br />
country and changed considerably through time. While dugout boats, bark– and skincovered<br />
craft were the dominant vessel types for the prehistoric period, the first<br />
evidence <strong>of</strong> other boat forms (i.e. plank built), in both foreign and native vessels,<br />
appeared in Ireland during the Iron Age. At the start <strong>of</strong> the early medieval period, before<br />
the arrival <strong>of</strong> the Vikings, large clinker-built vessels were in use in the English Kingdoms<br />
which the Irish must have been aware <strong>of</strong> through trading and raiding. However, the<br />
coracle (a small wickerwork boat covered with an animal hide) remains the most<br />
mentioned vessel in the first Irish documentary sources. The arrival <strong>of</strong> the Vikings had a<br />
great impact on Irish communities and the emerging dominance <strong>of</strong> the Nordic boat<br />
building tradition is evident on several iconographic depictions <strong>of</strong> ships <strong>of</strong> that time.<br />
[ 14 ]
INSTAR Project 16702: <strong>Archaeological</strong> applications <strong>of</strong> the Joint Irish Bathymetric Survey [<strong>JIBS</strong>] data<br />
Apart from documentary and iconographic evidence, numerous boat and ship timbers,<br />
graffito and boat models have been recovered from former Irish Viking towns. Despite<br />
the advances in technology brought to Ireland by the Vikings, the logboat was still used<br />
and its representation in the archaeological record indicates that it is the most enduring<br />
boat type used on the island. During the high medieval period, trade became ever more<br />
important and, despite the rarity <strong>of</strong> timber finds <strong>of</strong> vessels from that period in Ireland,<br />
the main Northern European vessel types (cog, hulc and keel) must have been a regular<br />
sight. Outside the major ports though, local traditional boats were still in use. In the late<br />
medieval period, pr<strong>of</strong>ound changes in European shipbuilding meant that the carvel<br />
technique was now used for bigger ships (carracks, galleons and galleys), while the<br />
clinker technique was restricted to smaller vessels. During the early modern period,<br />
Ireland’s economy was completely dominated by England. The great innovations <strong>of</strong> the<br />
period in ship design were stimulated by large-scale mercantile business (the so-called<br />
‘Companies’) carrying goods from around the world to Europe. These vessels were<br />
characterised by high sterns, three masts, a combination <strong>of</strong> square and lateen sails and<br />
complex rigging. The vessels became larger in size and design, to over 600 tons by the<br />
mid-eighteenth century and over 1000 tons by the end <strong>of</strong> the century. A number <strong>of</strong> ships<br />
belonging to the various companies were wrecked around the Irish coasts. Nonetheless,<br />
currachs and logboats remained one <strong>of</strong> the most enduring vernacular boats in Ireland. A<br />
period <strong>of</strong> relative peace and prosperity in the 18 th century reflected in the increase <strong>of</strong><br />
coastal trade and shipping. The early years <strong>of</strong> this coastal trade was dominated by wellestablished<br />
wooden sailing vessels such as schooners, brigs, brigantines and snows.<br />
Hundreds <strong>of</strong> wrecks from this period survive around the coast. Wooden sailing vessels<br />
continued to be used into the early twentieth century but were doomed once the<br />
technology <strong>of</strong> steam and iron began to develop. Commercial iron shipbuilding began in<br />
the first half <strong>of</strong> the nineteenth century. First, individual iron components were combined<br />
with wooden structural elements to form composite ships (e.g. many <strong>of</strong> the great clipper<br />
ships). Advances in the use <strong>of</strong> iron in shipbuilding continued and when steel eventually<br />
began to replace iron from the 1870s onwards, the old sailing ships went into decline. A<br />
more detailed history <strong>of</strong> the boats and ships <strong>of</strong> Ireland and its place in a wider European<br />
context can be found in Breen and Forsythe (2004).<br />
As the result <strong>of</strong> the work <strong>of</strong> individuals studying Ireland’s underwater cultural heritage,<br />
governmental bodies have started to recognize the archaeological potential <strong>of</strong> the<br />
marine environment and have established structured survey programs in recent years<br />
(e.g. MAP, Maritime Archaeology Project). This has resulted in the development <strong>of</strong><br />
inventories for Ireland (both the Republic and Northern Ireland) based on historical<br />
cartographic, documentary and photographic material combined with contemporary<br />
marine survey data (Breen, 1996; Breen and Forsythe, 2001; Breen et al., 2007). In<br />
total, the records <strong>of</strong> over 10,000 shipwreck incidents <strong>of</strong>f Ireland have been compiled<br />
(Forsythe et al., 2000), which led to the production <strong>of</strong> marine sites and monuments<br />
records (MSMRs) for each Irish County.<br />
Despite the long history <strong>of</strong> boat building in Ireland, the wreck record is heavily biased<br />
chronologically towards the post-medieval period (postdating the 16 th century). For<br />
Northern Ireland specifically 3% predate the 18 th century, 11% date from 1751 to 1800,<br />
66% date to the 19 th century and 20% date to before 1945 (Breen et al., 2007; Figure<br />
3.1) The high percentage for post-medieval period is caused by the increase in recording<br />
<strong>of</strong> ship losses by the authorities coupled with the upsurge in shipping and coastal trade<br />
after the 17 th century. The general bias towards the post-medieval period must be<br />
sought in the nature <strong>of</strong> wreck preservation and the history <strong>of</strong> seabed mapping and<br />
research. Firstly, older wrecks have been subject to physical, chemical and biological<br />
degradation for a longer time period and might therefore not have survived. Secondly, if<br />
they have survived, then they are most likely buried within sediment and have not yet<br />
been discovered using traditional surveying techniques.<br />
[ 15 ]
INSTAR Project 16702: <strong>Archaeological</strong> applications <strong>of</strong> the Joint Irish Bathymetric Survey [<strong>JIBS</strong>] data<br />
Figure 3.1 Extent <strong>of</strong> shipwreck loss in Northern Ireland shown in 50 year periods from<br />
the 15 th century to 1945 (Breen et al., 2007).<br />
Over 95% <strong>of</strong> vessels contained within the Irish shipwreck archive are those propelled by<br />
wind power and it was this source <strong>of</strong> power which <strong>of</strong>ten resulted in wrecking along the<br />
coast (Forsythe et al., 2000). The general distribution <strong>of</strong> Irish wrecks therefore reveals<br />
that most ships are concentrated around ports and notorious natural hazards. The<br />
spatial distribution <strong>of</strong> preserved wrecks in Northern Ireland specifically, in comparison<br />
with the total Irish coast, shows that 8% <strong>of</strong> wrecks are located on the Co. Down coast,<br />
3% <strong>of</strong>f the Co. Antrim coast and less than 1% <strong>of</strong>f Co. Derry (Breen et al., 2007). This<br />
distribution reflects the differences in shipping activity (largest in Co. Down and Antrim),<br />
presence <strong>of</strong> natural hazards (with extensive shoals, banks and rocks <strong>of</strong>f the coast <strong>of</strong> Co.<br />
Down) and preservation potential (lowest in the exposed areas <strong>of</strong> the north coast) <strong>of</strong> the<br />
different areas.<br />
The compiled MSMRs are not only an aid for maritime archaeologists studying the<br />
marine archaeological resource, either on a local or regional scale. More recently the<br />
archive is being used as an integral part <strong>of</strong> Environmental Impact Assessments (EIAs)<br />
(Breen, 1996). Commercial developments such as marine construction or seabed cable<br />
laying, now have to take archaeology into account, and rely heavily on these MSMRs.<br />
However, there are some problems with the MSMRs as they stand. Firstly, the positional<br />
accuracy <strong>of</strong> the sites within the MSMR is <strong>of</strong>ten inaccurate. They frequently depend on<br />
post-18 th century documentary evidence and word-<strong>of</strong>-mouth reports, DECCA or latitudelongitude<br />
readings from sources varying from fishermen, sports divers and the<br />
Hydrographic Office (Quinn et al., 2002b). It is therefore high time that more exact and<br />
systematic surveys are conducted which can improve or confirm the positional data <strong>of</strong><br />
existing entries in the MSMR and can quantify the nature <strong>of</strong> currently unknown<br />
submerged sites. Secondly, the entries in the MSMR do not <strong>of</strong>fer any information on the<br />
wider context or the environment in which the site is located. However, such information<br />
is vital in understanding site formation processes and to assess the preservation<br />
potential and future <strong>of</strong> the site. Fully submerged shipwreck sites act as open systems,<br />
with the exchange <strong>of</strong> material (sediment, water, organic and inorganic objects) and<br />
energy (wave, tidal, storm) across system boundaries (Quinn, 2006). Formation<br />
processes at wreck sites are driven by some combination <strong>of</strong> chemical, biological and<br />
physical processes, with physical processes dominant in initial phases (Quinn, 2006).<br />
Depositional and erosional patterns that form in response to hydrodynamic forcing are<br />
[ 16 ]
INSTAR Project 16702: <strong>Archaeological</strong> applications <strong>of</strong> the Joint Irish Bathymetric Survey [<strong>JIBS</strong>] data<br />
<strong>of</strong>ten difficult to quantify at sites due to the spatial and temporal scales at which these<br />
processes occur. These are particularly difficult to understand if the information is<br />
founded on dive based survey data, which tend to concentrate on wreck and individual<br />
artefacts rather than the wider environment. To date, therefore, the CMA strategy for<br />
mapping submerged wreck sites has concentrated on the integration <strong>of</strong> single-beam<br />
bathymetric, side-scan, magnetometer and sub-bottom data to identify sites <strong>of</strong><br />
archaeological potential (Bull et al., 1998; Quinn et al., 2000; Quinn et al., 2002a;<br />
Quinn, 2006; Quinn et al., 2007). These data have been interpreted in the context <strong>of</strong> a<br />
series <strong>of</strong> control experiments, designed to mimic the geophysical signatures <strong>of</strong><br />
submerged archaeological material (Quinn et al., 1998a; Quinn et al., 1998b; Quinn et<br />
al., 2005). This experimental approach was developed to inform interpretation <strong>of</strong><br />
geophysical data acquired over potential archaeological sites. However, the limited<br />
availability (and relatively low-resolution) <strong>of</strong> data <strong>of</strong>f the north coast has currently<br />
hindered this approach.<br />
The provision <strong>of</strong> the <strong>JIBS</strong> data presents a unique opportunity to address these issues.<br />
Firstly, current entries in the MSMR will be queried against the multibeam data and the<br />
data screened for unrecorded wreck sites. For each <strong>of</strong> the sites a contact sheet will be<br />
produced detailing the exact position (WGS84), describing the appearance on the<br />
multibeam data together with a description <strong>of</strong> the wider context (sediment type,<br />
hydrodynamic conditions) and a preliminary interpretation. Secondly, it will allow us to<br />
study wreck site formation processes at a resolution and scale previously unobtainable,<br />
permitting us to model the hydrodynamics <strong>of</strong> each site in greater detail and on a<br />
regional scale. However, we are fully aware that, in order to validate both the<br />
interpretation <strong>of</strong> the wreck site and its surrounding environmental parameters, groundtruthing<br />
may still be necessary in the future.<br />
3.2 The submerged prehistoric landscape<br />
Submerged prehistoric landscapes are tracts <strong>of</strong> lands that were subaerially exposed in<br />
the past but have since been inundated as a result <strong>of</strong> sea-level rise. These nowsubmerged<br />
areas were potentially important landscapes for prehistoric humans as they<br />
<strong>of</strong>fered a range <strong>of</strong> marine and terrestrial resources as well as access to transportation<br />
and migration routes along shorelines and estuaries and rivers (Flemming, 1998). The<br />
existence <strong>of</strong> submerged prehistoric landscapes with associated archaeological evidence<br />
in a particular area is contingent on three variables. Firstly, sea-level must have been<br />
lower at some point in the past. Secondly, prehistoric humans must have been present<br />
and occupied the exposed land. Thirdly, sedimentary processes accompanying<br />
inundation must have preserved rather than eroded the palaeo-landscape. Existing<br />
archaeological and palaeo-environmental records demonstrate that all three conditions<br />
can be met for Ireland.<br />
3.2.1 <strong>Archaeological</strong> and environmental background<br />
Ireland has a relatively short prehistory in comparison to other European countries,<br />
beginning after the end <strong>of</strong> the last Ice Age with the period generally referred to as the<br />
Mesolithic and terminating with end <strong>of</strong> the Iron Age at c. 500 AD. The earliest known<br />
archaeological site in Ireland is located at Mount Sandel (Northern Ireland) on the<br />
eastern bank <strong>of</strong> the River Bann, roughly 9km from the modern coast, and dates to<br />
between 9000 to 8500 radiocarbon years before present ( 14 C BP) (Smith, 1992). In<br />
calendar years this equates to a date <strong>of</strong> around 10,000 to 9500 BP. Evidence from this,<br />
and other sites, indicates that these earliest inhabitants were seasonally mobile huntergatherers<br />
exploiting a range <strong>of</strong> species including terrestrial mammals, birds, fish and<br />
shellfish (both fresh- and saltwater) and wild plants (Van Wijngaarden-Bakker, 1990). In<br />
particular, the majority <strong>of</strong> sites were situated on riverbanks, lakeshores and coasts,<br />
testifying to the importance <strong>of</strong> marine and freshwater resources.<br />
[ 17 ]
INSTAR Project 16702: <strong>Archaeological</strong> applications <strong>of</strong> the Joint Irish Bathymetric Survey [<strong>JIBS</strong>] data<br />
The absence <strong>of</strong> an earlier archaeological record has been attributed to the fact that<br />
Ireland was almost totally covered by an ice sheet several hundred metres thick at the<br />
height <strong>of</strong> the last Ice Age – referred to as the Last Glacial Maximum (LGM) - which<br />
occurred between 24,000 and 21,000 BP. Retreat <strong>of</strong> the ice began shortly after 21,000<br />
BP to the point at which the whole <strong>of</strong> Ireland was ice-free by 15,000 BP (Brooks et al.,<br />
2007; Sejrup et al., 2005). With ice retreat came <strong>of</strong> a suite <strong>of</strong> environmental changes,<br />
most notably in sea-level and climate.<br />
When the great ice sheets <strong>of</strong> the Last Glacial formed, they drew water from the world’s<br />
oceans, causing a glacio-eustatic sea-level fall <strong>of</strong> ~120m (Peltier and Fairbanks, 2006).<br />
However, their great weight caused the areas on which they formed to subside. Thus,<br />
areas under the ice experienced higher sea-levels on account <strong>of</strong> this isostatic depression.<br />
As the ice retreated, the sea initially flooded into these isostatically depressed<br />
landscapes. Over time though, the release <strong>of</strong> the great weight <strong>of</strong> the ice caused them to<br />
isostatically uplift, <strong>of</strong>ten faster than the glacio-eustatic rise driven by the influx <strong>of</strong><br />
meltwater into the oceans, creating a pattern <strong>of</strong> sea-level fall. Areas where ice was<br />
thickest experienced the greatest isostatic depression, and hence rebound. In some<br />
instances, this may have been sufficient to result in a pattern <strong>of</strong> constant sea-level fall<br />
right up till the present. Conversely, where the ice was thinner, rebound slowed and was<br />
eventually overtaken by the glacio-eustatic rise. The result <strong>of</strong> this was the exposure, and<br />
then submergence <strong>of</strong> habitable tracts <strong>of</strong> land (see overview in Lambeck and Chappell,<br />
2001). It is this pattern that characterizes much <strong>of</strong> Ireland, though on a local and<br />
regional scale, variations in the position and weight <strong>of</strong> the ice sheet and the timing <strong>of</strong><br />
deglaciation meant that the history and magnitude <strong>of</strong> sea-level change differed across<br />
the country (see below and Brooks and Edwards, 2006).<br />
The retreat <strong>of</strong> the ice was induced by a period <strong>of</strong> global climate warming which ended<br />
the cold dry LGM and gradually transformed the arid polar deserts and steppe-tundra <strong>of</strong><br />
the mid latitudes to more temperate parkland and forest. This was not to say that the<br />
warming trend was steady and unbroken. On the contrary, a number <strong>of</strong> cold stadials<br />
(e.g. the Younger Dryas – 12,900 to 11,500 BP) characterized by glacial conditions and<br />
ice advances can be seen in palaeo-environmental records (Rochon et al., 1998; Sejrup<br />
et al., 2005). However, by the time the first humans arrived in Ireland, the worst <strong>of</strong><br />
these fluctuations were over, and they entered an increasingly temperate landscape <strong>of</strong><br />
birch forests that gave way to elm and oak by 9,000 BP (Smith, 1992). Sea-levels<br />
though, still continued to fluctuate creating continual variations in coastal configuration<br />
and geomorphology.<br />
The end <strong>of</strong> the Mesolithic and start <strong>of</strong> the succeeding period – the Neolithic – has<br />
typically been defined, in Ireland as in the rest <strong>of</strong> Europe, by the transition from a<br />
hunter-gatherer to a settled agricultural way <strong>of</strong> life. Thus, evidence <strong>of</strong> seasonal mobility,<br />
temporary structures and ephemeral sites are replaced in the archaeological record by<br />
pottery, field systems, domesticated sheep and cattle, cereal crops and larger, more<br />
permanent structures such as megalithic tombs. That said, the boundary between the<br />
two periods is somewhat fuzzy owing to a lack <strong>of</strong> secure well-dated archaeological<br />
evidence for the intervening transitional interval. At present, what can be said for certain<br />
is that some typically Mesolithic tool assemblages can be dated to as late as 5500 ( 14 C)<br />
BP while the building <strong>of</strong> more substantial houses, megalithic tombs and adoption <strong>of</strong> a<br />
farming economy only took place at, or just after 5000 ( 14 C) BP (Woodman, 2000).<br />
Moreover, the nature <strong>of</strong> the transition between the two is still debated, with arguments<br />
ranging from indigenous adaptation <strong>of</strong> outside ideas, an influx <strong>of</strong> agricultural immigrants<br />
or a mix <strong>of</strong> the two (Woodman, 2000; Rowley-Conwy, 2004). Climatically, the rather<br />
stable and temperate climate begun in the Mesolithic continued, with the main difference<br />
being increasing forest clearance to create land suitable for agriculture. Sea-levels had<br />
still not entirely stabilized by this time; although the glacio-eustatic meltwater-driven<br />
rise had largely ceased, isostatic rebound was still taking place.<br />
By 4500 ( 14 C) BP new developments can be seen in the archaeological record, most<br />
notably the appearance <strong>of</strong> distinctive ‘Beaker’-style pottery and the replacement <strong>of</strong> stone<br />
[ 18 ]
INSTAR Project 16702: <strong>Archaeological</strong> applications <strong>of</strong> the Joint Irish Bathymetric Survey [<strong>JIBS</strong>] data<br />
tools by bronze implements. The agricultural way <strong>of</strong> life continued throughout this period<br />
– the Bronze Age – which also saw increases in social complexity, such as the building <strong>of</strong><br />
defensive structures such as hillforts, increasing settlement sizes and increased trade<br />
and exchange networks with Britain and the Continent (Breen and Forsythe, 2004).<br />
Social complexity continued to increase through the end <strong>of</strong> the Bronze Age around 2,600<br />
( 14 C) BP and into the final phase <strong>of</strong> the prehistoric period; the Iron Age. As well as the<br />
introduction <strong>of</strong> iron, the hierarchal societies <strong>of</strong> the previous period developed even<br />
further with the construction <strong>of</strong> defensive earthworks marking out centres <strong>of</strong> power.<br />
Ireland remained connected to the British Isles and mainland Europe via sea trade<br />
routes and may have been subject to Roman military incursions though these were<br />
ultimately unsuccessful as it was never conquered as Britain was. Climate and sea-level<br />
trends were broadly the same as in the Neolithic.<br />
An important aspect to consider throughout Irish prehistory is the importance <strong>of</strong> coasts<br />
and waterways. The first Mesolithic colonists came from Britain, either from SW Scotland<br />
or via the Isle <strong>of</strong> Man into Ulster, or from north Wales into Leinster. This is currently<br />
believed to have been a water crossing as a land bridge probably did not exist despite<br />
lower sea-levels (Breen and Forsythe, 2004). Nonetheless, these would have shifted<br />
coastlines further out to sea, narrowing the distance between the two landmasses.<br />
Landbridges may however, have played a role in the migration <strong>of</strong> fauna into Ireland<br />
immediately after the post-LGM deglaciation and during warmer interstadials preceding<br />
the glacial maximum (Woodman et al., 1997). Once people were established in Ireland,<br />
the coast remained significant. Many Mesolithic sites were coastal and sited to exploit a<br />
range <strong>of</strong> resources such as inshore fish, shell middens and flint sources. Even in the<br />
Neolithic, despite the increasing dependence <strong>of</strong> agricultural products, marine and coastal<br />
resources may also have played an important part in subsistence patterns. In addition,<br />
specialized lithic workshop sites are located close to sources <strong>of</strong> flakeable stone in coastal<br />
areas (Bamford and Woodman, 2004) while evidence <strong>of</strong> axe trade between Britain and<br />
Ireland as well as the remains <strong>of</strong> boats show that coasts and water transport remained<br />
important throughout the Neolithic (Breen and Forsythe, 2004). This implies that the<br />
seabed <strong>of</strong>f Ireland potentially contains a wealth <strong>of</strong> prehistoric material ranging from<br />
Mesolithic flint tools to Bronze Age boats. The submergence <strong>of</strong> this past archaeological<br />
landscape is dramatically illustrated by archaeological and palaeo-environmental<br />
evidence preserved <strong>of</strong>fshore. For example, a Neolithic megalithic tomb is situated in the<br />
intertidal zone in Cork Harbour (Woodman, 1990) while surveys in the Shannon Estuary<br />
have revealed 165 sites exposed on low tide mudflats including Neolithic and Bronze Age<br />
material (O'Sullivan, 2001).<br />
3.2.2 Sea-level change and archaeology in the study area<br />
The broad Irish trends and patterns described above are equally applicable to the study<br />
area. The SMR database contains evidence <strong>of</strong> archaeological sites from all prehistoric<br />
periods, many <strong>of</strong> which are sited to take advantage <strong>of</strong> marine, coastal, or freshwater<br />
resources. Moreover, the Mount Sandel Mesolithic site is located in the study area,<br />
indicating that the timeframe <strong>of</strong> study goes back to the very earliest period <strong>of</strong> Irish<br />
prehistory.<br />
With respect to relative sea-level (RSL change) the study area shows the complex<br />
pattern associated with formerly glaciated areas subject to the combined forces <strong>of</strong><br />
glacio-eustasy and isostatic rebound. The broad expected pattern <strong>of</strong> change is therefore<br />
an RSL highstand when the ice retreated, then an RSL fall as the crust uplifted faster<br />
than the glacio-eustatic rise, creating a sea-level lowstand. As uplift slowed, it was<br />
overtaken by the glacio-eustatic inflow resulting in RSL rising. This pattern could have<br />
continued till the present, or more likely given continued (albeit slow) crustal uplift, RSL<br />
fall could again have occurred towards the middle/end <strong>of</strong> the Holocene, when the glacioeustatic<br />
inflow ceased.<br />
Areas across the study region therefore underwent varying degrees <strong>of</strong> crustal rebound<br />
depending on the local thickness <strong>of</strong> ice and timing <strong>of</strong> deglaciation and consequently<br />
[ 19 ]
INSTAR Project 16702: <strong>Archaeological</strong> applications <strong>of</strong> the Joint Irish Bathymetric Survey [<strong>JIBS</strong>] data<br />
different patterns <strong>of</strong> RSL change. A database <strong>of</strong> radiocarbon dated RSL indicators and<br />
limits has recently been compiled (Brooks and Edwards, 2006). Four clusters <strong>of</strong> sea-level<br />
data cover the study area; North Donegal, Lough Swilly, Derry and North Antrim. The<br />
database also shows that with the exception <strong>of</strong> the westernmost portion <strong>of</strong> the study<br />
area (North Donegal), RSL index points are not available. Instead, knowledge <strong>of</strong> palaeosea-levels<br />
has been derived from limiting dates (Figure 3.2). Overall, these suggest an<br />
RSL rise from at least c. 10 ka and in some areas provide evidence <strong>of</strong> a Holocene<br />
highstand <strong>of</strong> 2-3m (see Figure 3.2; McDowell et al., 2005) or even as high as 5m above<br />
present (Kelley et al., 2006).<br />
To this can be added evidence that is less well age-constrained. Kelley et al. (2006) have<br />
documented an RSL lowstand in the form <strong>of</strong> submerged notches and wave truncated<br />
features in 32m water depth <strong>of</strong>f Co. Antrim. This feature is not dated directly, but a set<br />
<strong>of</strong> submerged beach deposits in 30m water depth from Belfast Lough (some 90km to the<br />
southeast) are dated to 13.4 cal ka BP. Raised shorelines and marine deposits landward<br />
<strong>of</strong> the present coast also attest to formerly higher sea-levels created prior to the<br />
lowstand as the land was isostatically depressed (McCabe et al., 2007).<br />
In the absence <strong>of</strong> detailed RSL data, one alternative is to turn to computer models <strong>of</strong> the<br />
Earth’s isostatic response to ice loading. These estimate the magnitude and timing <strong>of</strong> the<br />
crustal uplift/subsidence using a model <strong>of</strong> the Earth’s rheology and isostatic response<br />
coupled with an ice sheet growth/decay history and a glacio-eustatic sea-level record,<br />
both <strong>of</strong> which are based on field data. RSL observations from the study area are used to<br />
calibrate the models, effectively adjusting them so that they fit the RSL data, but remain<br />
within the constraints set out by the Earth’s rheology, ice sheet history and glacioeustatic<br />
record. This allows RSL curves to be generated for areas that lack RSL data, or<br />
to fill gaps in extant curves within widely spaced data points.<br />
These Glacio-Isostatic Adjustment (GIA) models are well developed (see for example<br />
Lambeck, 1995; Peltier, 1994; Shennan et al., 2006) and have been specifically applied<br />
to Ireland (Brooks et al., 2008; Lambeck and Purcell, 2001). Nonetheless, there are<br />
claims that the models are inaccurate and fail to reproduce the sea-level changes seen in<br />
the Irish geological record. For example, McCabe et al. (2007) interpret a variety <strong>of</strong><br />
geological evidence (including raised beaches and marine muds) as suggestive <strong>of</strong> rapid<br />
‘sawtooth’ fluctuations in RSL for NE Ireland between 21-17,000 BP created by rapid<br />
deglaciation and subsequent ice re-advances. In response, modellers have stated that<br />
the relationships <strong>of</strong> these data to past sea-level cannot be quantified and have also been<br />
assembled from across an area that likely experienced considerable local RSL variability,<br />
and therefore should not be combined into a single continuous record (Edwards et al.,<br />
2008). Moreover, Kelley et al’s (2006) lowstand value <strong>of</strong> -30m is not replicated by<br />
modelled curves for Belfast or Antrim, which suggest values <strong>of</strong> -5 to -15m. The<br />
explanation for this is not yet clear, but either stems from an underestimate by the<br />
model or the fact that the material (shells) dated for the sea-level data are not in situ<br />
(Brooks et al., 2008).<br />
What should be clear from this is that at present neither the models, nor the geological<br />
evidence, provide direct quantifiable evidence <strong>of</strong> past sea-level. Rather they should be<br />
seen as providing estimates and constraints on the pattern <strong>of</strong> past RSL change. In any<br />
case, from an archaeological perspective, most <strong>of</strong> the controversies can be avoided as<br />
the period <strong>of</strong> focus is the Holocene not the Late Pleistocene (i.e. post- 10,000 BP). By<br />
this time, there is closer agreement between the RSL data and the models: the pattern<br />
<strong>of</strong> change at this point is one <strong>of</strong> an RSL rise from 10,000 BP to a highstand by 8 to 6,000<br />
BP followed by a fall to the present (Brooks et al., 2008; Kelley et al., 2006). GIA<br />
modeling suggests that the amount <strong>of</strong> RSL rise increased as one moves west across the<br />
study area (see isobase maps in Figure 3.3). For example RSL was between -4 to -8m<br />
on the North Antrim coast at 10,000 BP, but between -18 to -20m in Donegal at the<br />
same time. Conversely, the magnitude <strong>of</strong> the Holocene highstand decreased moving<br />
west across the study area. It reached Antrim by 8-7,000 BP and rose up to 2-5m by<br />
5,000BP, but did not penetrate as far as West Donegal.<br />
[ 20 ]
INSTAR Project 16702: <strong>Archaeological</strong> applications <strong>of</strong> the Joint Irish Bathymetric Survey [<strong>JIBS</strong>] data<br />
The estimates that will be used across within the study area can be summarized as<br />
follows:<br />
[i] Antrim<br />
GIA modeling indicates a lowstand <strong>of</strong> c. -12m on the North Antrim coast at c. 11 ka BP,<br />
and an RSL position <strong>of</strong> c. -6m by 10 ka BP (Figure 3.2). Conversely, RSL data can<br />
interpreted to show a lowstand <strong>of</strong> -30m by 13.5 ka BP rising to -12 to -14m by 10 ka<br />
(Kelley et al., 2006; McCabe et al., 2007). On this basis we will consider a maximum<br />
lowstand <strong>of</strong> -30m, but recognizing that by the time <strong>of</strong> the earliest known Mesolithic, RSL<br />
may have been higher; between -6 to -14m.<br />
[ii] Derry<br />
GIA modeling indicates a lowstand <strong>of</strong> c. -15m on the Derry coast at c. 11 ka BP and an<br />
RSL position <strong>of</strong> c. -8 to -10m by 10 ka BP (Figure 3.2). Once again though, these<br />
estimates are countered by apparent shoreline notches at -30m and 13.5 ka BP, putting<br />
RSL closer to -14m by 10 ka BP (Kelley et al., 2006; McCabe et al., 2007). Therefore, a<br />
maximum lowstand <strong>of</strong> -30m will still be considered, with the recognition that the<br />
lowstand may have been closer to -15 to -8m.<br />
[iii] Donegal<br />
GIA modeling indicates a lowstand <strong>of</strong> c. -20 to -25m on the Donegal coast at c. 11 ka BP<br />
and an RSL position <strong>of</strong> c. -15 to -10m by 10 ka BP (Figure 3.2). Unlike Northern Ireland,<br />
there are no lowstand estimates from geological data. If the -30m value is indeed<br />
correct, then GIA modeling suggests that the lowstand <strong>of</strong>f Donegal should have been<br />
even deeper. In the absence <strong>of</strong> corroborating evidence, we will again use the -30m value<br />
as a maximum limit, but recognizing that the actual value could have fallen on either<br />
side <strong>of</strong> it.<br />
[ 21 ]
INSTAR Project 16702: <strong>Archaeological</strong> applications <strong>of</strong> the Joint Irish Bathymetric Survey [<strong>JIBS</strong>] data<br />
Figure 3.2 RSL data and GIA modeled curves for the study area. <strong>Data</strong> from Brooks and<br />
Edwards (2006); Brooks et al. (2008), additional lowstand point from Kelley et al.<br />
(2006).<br />
[ 22 ]
INSTAR Project 16702: <strong>Archaeological</strong> applications <strong>of</strong> the Joint Irish Bathymetric Survey [<strong>JIBS</strong>] data<br />
Figure 3.3 GIA-modelled RSL isobases for the Holocene. Negative values show where<br />
RSL was below present, positive values show where RSL was above present. The zero<br />
contour shows where RSL was at the same level as at present. <strong>Data</strong> from Brooks (2007).<br />
This implies that from an archaeological perspective, the seabed <strong>of</strong>f the Antrim coast will<br />
contain landscapes dating to the early Mesolithic, but relatively little later material. By<br />
contrast, submerged prehistoric landscapes dating from the Mesolithic to the Neolithic<br />
could be found <strong>of</strong>f Donegal. Derry, situated between the two, most likely had exposed<br />
landscapes during the Mesolithic and possibly the earliest Neolithic.<br />
This data, combined with topographic and bathymetric Digital Elevation Models (DEMs)<br />
allows the creation <strong>of</strong> palaeo-geographic reconstructions <strong>of</strong> the past landscape (Figure<br />
3.4). However, the available bathymetric DEMs are rather coarse; the most widely<br />
available model is the ETOPO-2 dataset which has a resolution <strong>of</strong> 2 minutes <strong>of</strong><br />
latitude/longitude. Even conventional bathymetric charts are less than adequate due to<br />
the fact that they are constructed using widely spaced single-beam echosounder and<br />
lead line data, with considerable interpolation between individual data points. Any<br />
reconstructions which make use <strong>of</strong> these datasets can be used for illustrative purposes<br />
on large (i.e. hundreds <strong>of</strong> kilometers) spatial scales, but are insufficiently accurate for<br />
interpretative purposes on local to regional scales (i.e. tens <strong>of</strong> kilometers or less).<br />
[ 23 ]
INSTAR Project 16702: <strong>Archaeological</strong> applications <strong>of</strong> the Joint Irish Bathymetric Survey [<strong>JIBS</strong>] data<br />
Figure 3.4 Examples <strong>of</strong> low-resolution palaeo-geographic reconstructions created using<br />
GIA modeled RSL change and the ETOPO-2 DEM. Timesteps are 18,000 BP (left) and<br />
16,000 BP (right) (from Brooks, 2007).<br />
The high-resolution multibeam data acquired by the <strong>JIBS</strong> project will therefore allow the<br />
creation <strong>of</strong> more accurate palaeo-geographic reconstructions which will serve two broad<br />
purposes. Firstly, they will allow the identification <strong>of</strong> features on the seabed that relate<br />
to the past coastline and subaerial landscape, in particular those which were<br />
preferentially used or occupied by prehistoric humans (Bell et al., 2008; Bell et al.,<br />
2006). Examples <strong>of</strong> such features include beaches, lagoons, shoreline notches, barriers,<br />
estuaries, deltas, lakes and river channels. This will facilitate future efforts to prospect<br />
for submerged archaeological sites by pinpointing areas <strong>of</strong> the highest archaeological<br />
potential. Secondly, the reconstructions will aid in the interpretation <strong>of</strong> the existing<br />
archaeological record by placing it in a more accurate palaeo-geographical context. For<br />
example, how might past palaeo-geography have influenced migration and trade routes<br />
and how did prehistoric social and settlement patterns on the coast respond to the<br />
palaeo-geographic changes wrought by long-term processes <strong>of</strong> marine transgression and<br />
regression?<br />
[ 24 ]
INSTAR Project 16702: <strong>Archaeological</strong> applications <strong>of</strong> the Joint Irish Bathymetric Survey [<strong>JIBS</strong>] data<br />
4. DATASETS AVAILABLE FOR THIS STUDY<br />
4.1 <strong>JIBS</strong> data<br />
The objective <strong>of</strong> the <strong>JIBS</strong> Project was ‘to promote joint action to survey the<br />
seabed in such a way as to satisfy the needs <strong>of</strong> many organisations’. The<br />
Maritime and Coastguard Agency (MCA)-appointed contractors in partnership with<br />
the Marine Institute <strong>of</strong> Ireland surveyed and acquired, for the first time,<br />
comprehensive multi-beam bathymetry data over prioritised areas within the 3nm<br />
coastal strip between Fanad Head and Torr Head. The survey was conducted to<br />
IHO Order 1 standard, ensuring 100% coverage <strong>of</strong> the seabed (a summary <strong>of</strong> the<br />
requirements are outline in Table 4.1). Bathymetry and backscatter data were<br />
provided over the world-wide web as ‘Generic Sensor Format (GSF)’.<br />
Table 4.1 Summary <strong>of</strong> minimum standards for hydrographic surveys IHO S-44<br />
5 th edition Order 1 (International Hydrographic Bureau, 2008)<br />
ORDER 1<br />
Examples <strong>of</strong> typical areas Harbours, harbor approach channels, recommended<br />
tracks and some coastal areas with depths up to<br />
100 m<br />
Horizontal Accuracy (95% 5 m + 5% <strong>of</strong> depth<br />
Confidence Level)<br />
Depth Accuracy for Reduced a = 0.5 m<br />
Depths (95% Confidence b.= 0.013<br />
Level) (1)<br />
100% Bottom Search Required in selected areas (2)<br />
System Detection Capability Cubic features > 2 m in depths up to 40 m;<br />
10% <strong>of</strong> depth beyond 40 m (3)<br />
Maximum Line spacing (4) Not defined, as<br />
full sea floor search is required<br />
Notes:<br />
(1) Recognising that there are both constant and depth dependent uncertainties that affect the<br />
uncertainty <strong>of</strong> the depths, the formula below is to be used to compute, at the 95% confidence level, the<br />
maximum allowable TVU. The parameters “a” and “b” for each Order, as given in the Table, together<br />
with the depth “d” have to be introduced into the formula in order to calculate the maximum allowable<br />
TVU for a specific depth:<br />
± [a2 +(b*d)2]<br />
Where:<br />
a represents that portion <strong>of</strong> the uncertainty that does not vary with depth<br />
b is a coefficient which represents that portion <strong>of</strong> the uncertainty that varies<br />
with depth d is the depth<br />
b x d represents that portion <strong>of</strong> the uncertainty that varies with depth<br />
(2) For safety <strong>of</strong> navigation purposes, the use <strong>of</strong> an accurately specified mechanical sweep to guarantee<br />
a minimum safe clearance depth throughout an area may be considered sufficient for Special Order and<br />
Order 1a surveys.<br />
(3) A cubic feature means a regular cube each side <strong>of</strong> which has the same length. It should be noted<br />
that the IHO Special Order and Order 1a feature detection requirements <strong>of</strong> 1 metre and 2 metre cubes<br />
respectively, are minimum requirements. In certain circumstances it may be deemed necessary by the<br />
hydrographic <strong>of</strong>fices / organizations to detect smaller features to minimise the risk <strong>of</strong> undetected<br />
hazards to surface navigation. For Order 1a the relaxing <strong>of</strong> feature detection criteria at 40 metres<br />
reflects the maximum expected draught <strong>of</strong> vessels.<br />
(4) The line spacing can be expanded if procedures for ensuring an adequate sounding density are used.<br />
"Maximum Line Spacing" is to be interpreted as the:<br />
- Spacing <strong>of</strong> sounding lines for single beam echo sounders, or the<br />
[ 25 ]
INSTAR Project 16702: <strong>Archaeological</strong> applications <strong>of</strong> the Joint Irish Bathymetric Survey [<strong>JIBS</strong>] data<br />
- Distance between the useable outer limits <strong>of</strong> swaths for swath systems.<br />
The cleaned <strong>JIBS</strong> data was supplied to the CMA in a processed Fledermaus format<br />
(*.scene/*.sd) in September 2008. Two versions <strong>of</strong> the data <strong>of</strong>f Co.’s Derry and<br />
Antrim were made available by the MCA: gridded to a resolution <strong>of</strong> 6m and a<br />
resolution <strong>of</strong> 4m. Similarly, two datasets were supplied to the CMA by the Marine<br />
Institute for Co. Donegal: gridded to a resolution <strong>of</strong> 5m and a resolution <strong>of</strong> 2m.<br />
The backscatter data has not yet been made available.<br />
For Phase 2 we were given the following: cleaned xyz data for the whole <strong>JIBS</strong><br />
area, raw .all files for data acquired with Kongsberg multibeam systems and<br />
xtf/gsf files for the data acquired with the Reson multibeam system.<br />
The data was explored in Fledermaus and exported to a GIS for further analysis<br />
(Figure 4.1).<br />
Figure 4.1 Map showing the extent <strong>of</strong> the <strong>JIBS</strong> bathymetric data set.<br />
4.2 Shipwrecks<br />
In addition to <strong>JIBS</strong> data, the following data sets were available during Phase 1<br />
(updated versions <strong>of</strong> these were integrated in Phase 2):<br />
• Maritime Sites and Monuments Records (MSMRs) for Counties Donegal,<br />
Derry and Antrim. These were provided by the Department <strong>of</strong><br />
Environment, Heritage and Local Government (DEHLG) for Co. Donegal<br />
(30 entries in total) and by the Northern Ireland Environment Agency<br />
(NIEA) for the Co.’s Derry and Antrim (886 entries in total). See Figure<br />
4.2 for the spatial distribution <strong>of</strong> these sites.<br />
• Raster and vector versions <strong>of</strong> all Admiralty Charts for the north coast.<br />
[ 26 ]
INSTAR Project 16702: <strong>Archaeological</strong> applications <strong>of</strong> the Joint Irish Bathymetric Survey [<strong>JIBS</strong>] data<br />
• Dive Records for the Counties Donegal, Derry and Antrim. These are<br />
publically available on http://www.irishwrecksonline.net/.<br />
• Sub-bottom data. The University <strong>of</strong> Ulster has been collecting Chirp<br />
seismic data since 1997 <strong>of</strong>f the coast <strong>of</strong> Northern Ireland. This data can<br />
linked to the <strong>JIBS</strong> data using IVS Fledermaus, SMTKingdom Suite and<br />
ESRI GIS. This will allow us to link anomalies detected on the bathymetry<br />
to sub-surface features, adding an extra dimension to the data.<br />
<strong>Data</strong> were projected from latitude-longitude co-ordinates (WGS84) or Irish<br />
National Grid into Universal Transverse Mercator (UTM) Zone 29.<br />
4.3 Submerged prehistoric landscape<br />
In addition to <strong>JIBS</strong> data, the following data sets were available during Phase 1<br />
(updated versions <strong>of</strong> these were integrated in Phase 2):<br />
• (Terrestrial) Sites and Monuments Records (SMRs). The record with data<br />
on 3,129 archaeological sites and historic monuments for Co. Donegal and<br />
16,020 sites for Co.’s Derry and Antrim, ranging from prehistoric tombs to<br />
post-medieval settlements were provided to us by the Department <strong>of</strong><br />
Environment, Heritage and Local Government (DEHLG) for Co. Donegal<br />
(available on http://www.archaeology.ie/smrmapviewer/mapviewer.aspx)<br />
and by (NIEA) for the Counties in Northern Ireland. See Figure 4.3 for the<br />
spatial distribution <strong>of</strong> these sites.<br />
• Shuttle Radar Topography Mission (SRTM) data. This data is freely<br />
downloadable through the USGS “The National Map Seamless Server”<br />
(http://seamless.usgs.gov/ or ftp://e0srp01u.ecs.nasa.gov/srtm/). SRTM<br />
is an international effort to obtain digital elevation models on a global<br />
scale using radar interferometry. <strong>Data</strong> used for this study consists <strong>of</strong><br />
SRTM3 data with a sample spacing <strong>of</strong> 3-arc seconds. This data was used<br />
to link the terrestrial topography to the acquired marine bathymetry.<br />
• Glacial Isostatic Adjustment (GIA) Models for sea-level change between<br />
20,000 – 1,000 BP. The model used is the ‘best-fit’ model described in<br />
(Brooks et al., 2007). It was developed following an iterative process that<br />
compared model outputs against Irish RSL data to achieve the closest fit<br />
possible. The two major components <strong>of</strong> this model are its ice model and<br />
Earth model. For the former it uses a version <strong>of</strong> the BIM-1 British and Irish<br />
ice sheet model (developed by Shennan et al., 2006) modified to have<br />
thicker LGM ice over parts <strong>of</strong> Ireland and the Irish Sea and an earlier and<br />
more rapid pattern <strong>of</strong> deglaciation. The latter is a three layer model with a<br />
lithospheric thickness <strong>of</strong> 71 km, an upper mantle viscosity <strong>of</strong> 4 X 10 20 Pa s<br />
and a lower mantle viscosity <strong>of</strong> 4 X 10 22 Pas. Modelled isobases <strong>of</strong> RSL<br />
change were provided by courtesy <strong>of</strong> Robin Edwards and Tony Brooks.<br />
[ 27 ]
INSTAR Project 16702: <strong>Archaeological</strong> applications <strong>of</strong> the Joint Irish Bathymetric Survey [<strong>JIBS</strong>] data<br />
Figure 4.2Overview map showing the documented shipwrecks <strong>of</strong>f the north coast<br />
<strong>of</strong> Ireland.<br />
Figure 4.3 Overview map <strong>of</strong> study area showing all terrestrial archaeological<br />
sites.<br />
[ 28 ]
INSTAR Project 16702: <strong>Archaeological</strong> applications <strong>of</strong> the Joint Irish Bathymetric Survey [<strong>JIBS</strong>] data<br />
5. METHODOLOGY<br />
The methodology descried below concentrates on the new methods developed<br />
during Phase 2 <strong>of</strong> the project. For details on methods relating to work done in<br />
Phase 1, please refer to the 2008 report.<br />
5.1 Production <strong>of</strong> 1m resolution DEM<br />
The main purpose <strong>of</strong> multibeam sonar systems is to accurately determine the<br />
depth <strong>of</strong> the seafloor using an acoustic process called ‘beam forming’. By using<br />
several beams at different angles, a large area <strong>of</strong> seabed can be covered in a<br />
relatively short survey time. From the angle and travel time <strong>of</strong> the returned<br />
signal, the position <strong>of</strong> each echo can be calculated and a bathymetric map (also<br />
called a Digital Elevation Model, DEM) can be created.<br />
• workflow<br />
Ungridded, cleaned .xyz data were delivered to the University <strong>of</strong> Ulster in January<br />
2009 by the UK Hydrographic Office (UKHO) and the Marine Institute (MI). In<br />
total 5333 .xyz bathymetric files (152GB) from the Northern Irish side and 890<br />
.xyz bathymetric files (142GB) from the Republic <strong>of</strong> Ireland side <strong>of</strong> the study area<br />
were used to create digital elevation models (DEMs) (Figures 5.1 and 5.2 showing<br />
lines <strong>of</strong> MI and MCA/UKHO).<br />
All individual .xyz lines for both study areas were imported into IVS FM DMagic<br />
s<strong>of</strong>tware for gridding. However, because both datasets are so large, the area had<br />
to be divided into smaller zones (called ‘quadrants’ hereafter) in order to perform<br />
the gridding process (Figures 5.1 and 5.2). Subsequently, each quadrant was<br />
gridded using a weighted moving average gridding type (weight diameter 3) to a<br />
1m bin size and output to the UTM zone 29N coordinate system. FM DMagic<br />
automatically creates a DEM from the resulting grid which can be imported into<br />
IVS Fledermaus for enhanced visualization and interpretation. In addition, the<br />
gridded data were exported as an ASCII grid for use in ArcGIS.<br />
The workflow is summarized as follows:<br />
> Load all lines into FM DMagic.<br />
> Select a quandrant in FM DMagic (if too many lines are selected, the program<br />
tends to crash during processing).<br />
> Grid the selected lines (1m bin, weighted moving average 3, UTM29N) and<br />
choose the default shading parameters in a first instance – this will create an *.sd<br />
file.<br />
> Export the created grid as an ArcGIS ascii for further analysis in ArcMAP.<br />
> Import the created *.sd file into IVS Fledermaus for visualisation and<br />
interpretation – note that in this step, the shading parameters may have to be<br />
changed to get the best results.<br />
[ 29 ]
INSTAR Project 16702: <strong>Archaeological</strong> applications <strong>of</strong> the Joint Irish Bathymetric Survey [<strong>JIBS</strong>] data<br />
Figure 5.1 Overview map showing the survey lines acquired by the MCA and<br />
UKHO in Northern Irish waters and the associated quadrants used to create<br />
DEMs.<br />
Figure 5.2 Overview map showing the survey lines acquired by the Marine<br />
Institute in the waters <strong>of</strong>f Donegal (Republic <strong>of</strong> Ireland) and the associated<br />
quadrants used to create DEMs.<br />
• Issues encountered with the data<br />
Relatively few issues were encountered during the processing <strong>of</strong> the bathymetric<br />
data. However, it is worth noting that all IVS programmes (FM Dmagic, Geocoder,<br />
Fledermaus) struggle with large datasets and, therefore, it was necessary to<br />
divide the study area into smaller zones.<br />
At the moment, all .xyz data received from the MI have been processed to very<br />
high quality. This is not necessarily true for the data in Northern Ireland. In<br />
several areas, evident processing features have been detected in the bathymetric<br />
[ 30 ]
INSTAR Project 16702: <strong>Archaeological</strong> applications <strong>of</strong> the Joint Irish Bathymetric Survey [<strong>JIBS</strong>] data<br />
data (Figure 5.3). At the time <strong>of</strong> the data delivery, the UKHO was still actively<br />
working on bathymetric corrections. At present, it is unclear if this process has<br />
been finalised and whether the data can be made publically available.<br />
Nevertheless, the data quality has improved significantly compared to the data<br />
we were given for Phase 1 (Figure 5.4) <strong>of</strong> the project and, as a consequence <strong>of</strong><br />
the relatively short time given to complete Phase 2, we decided that we could not<br />
wait any longer for the delivery <strong>of</strong> the final data and chose to work with what was<br />
available at the time.<br />
Figure 5.3 Bathymetry map in the area <strong>of</strong> the Bann Mouth showing tidal<br />
correction issues resulting in processing features.<br />
[ 31 ]
INSTAR Project 16702: <strong>Archaeological</strong> applications <strong>of</strong> the Joint Irish Bathymetric Survey [<strong>JIBS</strong>] data<br />
Figure 5.4 Improvement in the data around the southern tip <strong>of</strong> Rathlin Island in<br />
terms <strong>of</strong> the reduction <strong>of</strong> processing errors and improved tidal correction<br />
5.2 FM Geocoder processing <strong>of</strong> backscatter data<br />
Until recently, multibeam systems were predominantly used to measure the<br />
depth to the seabed in order to create a detailed bathymetric map. However, as<br />
the acoustic beams propagate through the water, they eventually interact with<br />
the seafloor or objects lying upon it. Most <strong>of</strong> this energy is reflected away from<br />
the sonar system, a small portion <strong>of</strong> the energy is lost in the subsurface and<br />
[ 32 ]
INSTAR Project 16702: <strong>Archaeological</strong> applications <strong>of</strong> the Joint Irish Bathymetric Survey [<strong>JIBS</strong>] data<br />
another small portion, known as backscatter, reflects back to the sonar system.<br />
The amplitude <strong>of</strong> this returned signal is measured by the transducers, together<br />
with the travel time. The amount <strong>of</strong> backscatter is determined by three factors:<br />
the local morphology <strong>of</strong> the surface ensonified, the small-scale (sub-metre)<br />
roughness <strong>of</strong> the surface and the material properties <strong>of</strong> the seafloor. The data are<br />
presented as a black and white image showing the strength <strong>of</strong> the returning<br />
energy and stitched together to display a continuous image <strong>of</strong> the seabed, called<br />
a mosaic.<br />
• Workflow<br />
In order to plot the multibeam’s associated backscatter data, the raw multibeam<br />
data were requested and received from the UKHO and MI. In Northern Irish<br />
waters, the original data were acquired using three different systems from three<br />
different vessels, while the MI deployed two different multibeam systems (Table<br />
5.1). In the same way as for the bathymetric data, the lines for each <strong>of</strong> the<br />
systems were divided into smaller areas (called ‘quadrants’) to make the data<br />
more manageable during processing and mosaicing in IVS FMGeocoder.<br />
Table 5.1 Overview <strong>of</strong> different vessels, multibeam systems and acquisition<br />
settings<br />
Area Vessel Multibeam<br />
system<br />
Northern<br />
Ireland<br />
Republic<br />
<strong>of</strong><br />
Ireland<br />
Sounding<br />
mode<br />
Centre<br />
frequency<br />
Pulse<br />
length<br />
File<br />
format<br />
No.<br />
lines<br />
(size<br />
data)<br />
Jetstream EM3002 1 (shallow) 293kHz 149μsec .all 4148<br />
(187GB)<br />
Meridian Reson 7125 - 200/400kHz 10-<br />
300μsec<br />
.xtf/.gsf 950<br />
(76.5GB)<br />
Victor EM710 0 (v. 71-97- 206μsec .all<br />
Hensen<br />
shallow) 83kHz<br />
1 (shallow) 71-83-<br />
77kHz<br />
500μsec .all 412<br />
(54.8GB)<br />
2<br />
71-77- 2000μsec .all<br />
(medium) 74kHz<br />
Celtic EM3002 1 (shallow) 293kHz 149 μsec .all 809<br />
Voyager<br />
(147GB)<br />
Celtic EM1002 1 (shallow) 95kHz 200μsec .all 971<br />
Voyager<br />
(40GB)<br />
FMGeocoder is a s<strong>of</strong>tware program designed to visualize and analyze backscatter<br />
data from multi-beam and sidescan sonar. In processing the source files into<br />
mosaics, it is designed to perform as many corrections as possible to maximize<br />
the information content within the backscatter signals. Once the mosaic has been<br />
created, a number <strong>of</strong> statistics can be calculated (Fledermaus reference manual,<br />
2009; Figure 5.5). The final mosaic and associated statistics can subsequently be<br />
exported as *.sd files for further visualization in IVS Fledermaus or as ArcGIS<br />
ASCII files. For this project, a *.sd file and an ArcGIS ascii grid were created for<br />
each individual quadrant mosaic before being merged into a larger mosaic in<br />
ArcGIS. The created *.sd scalar files can also be draped on top <strong>of</strong> the bathymetric<br />
*.sd file in IVS Fledermaus (see contact sheets).<br />
[ 33 ]
INSTAR Project 16702: <strong>Archaeological</strong> applications <strong>of</strong> the Joint Irish Bathymetric Survey [<strong>JIBS</strong>] data<br />
Figure 5.5. Example <strong>of</strong> Backscatter mosaic and a<br />
series <strong>of</strong> statistical maps created in Geocoder. Note<br />
that at present Geocoder does not display a colour bar<br />
with the imagery; to get the actual statistical values,<br />
the grids must be exported as ascii files and imported<br />
into ArcGIS – this bug will be reported to IVS.<br />
[ 34 ]
INSTAR Project 16702: <strong>Archaeological</strong> applications <strong>of</strong> the Joint Irish Bathymetric Survey [<strong>JIBS</strong>] data<br />
The workflow is summarized as follows:<br />
> Based on the .xyz data loaded in FM DMagic, the raw backscatter data for each<br />
system were divided into smaller zones and copied into individual folders.<br />
>FM Geocoder was run for each individual area for each system. The Kongsberg<br />
*.all files were loaded as ‘Beam Time Series data’ while the Reson *.xtf files were<br />
loaded as ‘Sidescan + Bathymetry data’.<br />
> Parameters chosen for the mosaicing <strong>of</strong> the *.all data: 1m bin size for the<br />
backscatter mosaic, 2m bin size for the statistics calculation, lock the histogram<br />
dB range to -70 to 10dB, NO Tx/Rx Power Gain correction and Apply FLAT AVG<br />
correction.<br />
> Parameters chosen for the mosaicing <strong>of</strong> the *.xtf data: 1m bin size for the<br />
backscatter mosaic, no statistics calculation, lock the histogram range to 20 to<br />
130 (mean amplitude), NO Tx/Rx Power Gain correction and Apply FLAT AVG<br />
correction.<br />
> The resulting mosaic for each quadrant was exported as a *.sd file for<br />
visualisation and interpretation in IVS Fledermaus. This file represents a scalar<br />
which can be draped over the bathymetric data.<br />
> The resulting mosaic for each quadrant was exported as an ArcGIS ascii file for<br />
analysis in ArcGIS.<br />
Figure 5.6 Overview map showing the survey lines acquired with the EM3002<br />
onboard Jetstream in Northern Irish waters and the associated quadrants used to<br />
create backscatter mosaics.<br />
[ 35 ]
INSTAR Project 16702: <strong>Archaeological</strong> applications <strong>of</strong> the Joint Irish Bathymetric Survey [<strong>JIBS</strong>] data<br />
Figure 5.7 Overview map showing the survey lines acquired with the Reson7125<br />
onboard Meridian in Northern Irish waters and the associated quadrants used to<br />
create backscatter mosaics.<br />
Figure 5.8 Overview map showing the survey lines acquired with the EM710<br />
onboard Victor Hensen in Northern Irish waters and the associated quadrants<br />
used to create backscatter mosaics.<br />
[ 36 ]
INSTAR Project 16702: <strong>Archaeological</strong> applications <strong>of</strong> the Joint Irish Bathymetric Survey [<strong>JIBS</strong>] data<br />
Figure 5.9 Overview map showing the survey lines acquired with the EM3002<br />
onboard Celtic Voyager in the waters <strong>of</strong>f Donegal (Republic <strong>of</strong> Ireland) and the<br />
associated quadrants used to create backscatter mosaics.<br />
Figure 5.10 Overview map showing the survey lines acquired with the EM1002<br />
onboard Celtic Voyager in the waters <strong>of</strong>f Donegal (Republic <strong>of</strong> Ireland) and the<br />
associated quadrants used to create backscatter mosaics.<br />
• Issues encountered with the data<br />
Issues encountered can be divided into two types: problems related to the<br />
processing s<strong>of</strong>tware and problems caused by the acquisition settings.<br />
[ 37 ]
INSTAR Project 16702: <strong>Archaeological</strong> applications <strong>of</strong> the Joint Irish Bathymetric Survey [<strong>JIBS</strong>] data<br />
FM Geocoder 7.0 was <strong>of</strong>ficially released in July 2009. As with any new s<strong>of</strong>tware,<br />
several bugs and limitations were encountered, some <strong>of</strong> which have been<br />
addressed by IVS in subsequent releases, while others are still unresolved. The<br />
first major issue is the inability to read the Reson7125 .xtf and .gsf file as a pair<br />
(although the manual claims it is possible to do this). As a consequence, only the<br />
.xtf data could be imported and was treated by the s<strong>of</strong>tware as ‘sidescan solo’<br />
data. So, although the data are still displayed and mosaiced, no bathymetric<br />
corrections can be made nor can any statistics be calculated. The second issue is<br />
the inability to compensate data acquired with different systems for the creation<br />
<strong>of</strong> a single mosaic (Figure 5.11), and, therefore, a separate mosaic needs to be<br />
created for each system. This causes problems when the resulting mosaic (scalar<br />
.sd file) needs to be draped over the bathymetric data, as it is not possible to<br />
drape more than one scalar over each bathymetric DEM. Yet, each bathymetric<br />
quadrant generally has corresponding backscatter data acquired with the different<br />
systems and thus, in theory, should have multiple scalars associated with it. This<br />
issue still remains unresolved.<br />
Figure 5.11 Example <strong>of</strong> the inability <strong>of</strong> FM Geocoder to compensate the<br />
backscatter <strong>of</strong> two separate multibeam systems and create a seamless mosaic.<br />
Note the higher backscatter values in the EM710 – these are intrinsic to the<br />
system and should not be confused with a change in seabed substrate.<br />
Two <strong>of</strong> the datasets appeared to show backscatter <strong>of</strong>fsets in the mosaics that are<br />
the results <strong>of</strong> changes in the acquisition parameters, which FM Geocoder cannot<br />
compensate for. The EM710 can be operated at three different modes (very<br />
shallow, shallow and medium) with each <strong>of</strong> these modes emitting different<br />
frequencies (with decreasing frequency values for increasing depths). The<br />
frequency content <strong>of</strong> the emitted beam plays an important part in determining<br />
the amount <strong>of</strong> energy that will be returned after bouncing <strong>of</strong>f the seafloor, with<br />
[ 38 ]
INSTAR Project 16702: <strong>Archaeological</strong> applications <strong>of</strong> the Joint Irish Bathymetric Survey [<strong>JIBS</strong>] data<br />
higher frequencies losing their energy faster than lower frequencies due to<br />
attenuation in the water column. Hence, differences in frequencies in the pulse<br />
will result in differences in the absorption <strong>of</strong> the sound in the water column, as<br />
well as differences in the interaction with the seafloor, all affecting the final<br />
backscatter value. In the same way that the backscatter data from the different<br />
systems could not be mosaiced together in FM Geocoder, it appears that the<br />
different modes <strong>of</strong> the EM710 should be mosaiced separately as well. Currently,<br />
FM Geocoder blends the two modes into a single mosaic, but the interpreter<br />
should be aware that apparent changes in backscatter are caused by changes in<br />
the acquisition mode and not the substrate <strong>of</strong> the seabed (Figure 5.12). Ideally,<br />
the backscatter data should always be collected using a single, consistent setting<br />
over the study area. The MI definitely has adopted this practice, but it seems that<br />
the hydrographers in charge <strong>of</strong> collecting the data on behalf <strong>of</strong> the MCA, were<br />
mainly concerned about acquiring high quality bathymetric data and did not<br />
consider the impact changes in frequency would have on the backscatter data.<br />
The University <strong>of</strong> Ulster does currently not have any s<strong>of</strong>tware to deal with this<br />
issue or divide the raw data depending on the mode setting. As such, caution<br />
must be taken when using the backscatter data to derive substrate maps without<br />
groundtruthing.<br />
Figure 5.12 Issues encountered when mosaicing EM710 backscatter data in FM<br />
Geocoder: changes in frequency mode result in blending <strong>of</strong> the grey levels –<br />
changes in grey level are the result <strong>of</strong> frequency changes, not substrate changes.<br />
Similar issues were encountered with the Reson7125 data. Changes in<br />
backscatter response occur in adjacent lines and cannot be attributed to changes<br />
in seafloor substrate (Figure 5.13). Unfortunately, we have not been able to<br />
extract the acquisition parameter settings for the .xtf files and, hence, have not<br />
been able to identify which parameter is causing the change. A final issue related<br />
to the Reson7125 concerns layback (positioning). This becomes visible on the<br />
final mosaic when tracing features that should be continuous, but now show a jigsaw<br />
pattern (Figure 5.13). Again, the University <strong>of</strong> Ulster currently does not own<br />
[ 39 ]
INSTAR Project 16702: <strong>Archaeological</strong> applications <strong>of</strong> the Joint Irish Bathymetric Survey [<strong>JIBS</strong>] data<br />
the appropriate multibeam processing s<strong>of</strong>tware to rectify this problem. We hope<br />
to address this issue in the future.<br />
Figure 5.13 Issues encountered when mosaicing Reson 7125 backscatter data in<br />
FM Geocoder: inability to account for acquisition setting changes and layback<br />
positioning errors.<br />
5.3 Automated segmentation <strong>of</strong> backscatter data<br />
5.3.1 Context<br />
Segmentation is the process <strong>of</strong> reducing complex information (in this case a digital<br />
sonograph) into a simplified, arbitarary representation. This is done primarily as an<br />
interpretive aid and is typically used to identify objects or boundaries between (or within)<br />
aggregations <strong>of</strong> similar units (in this case pixels). Classification is distinct from segmentation,<br />
as this involves assigning value(s) to the defined segments, on the basis <strong>of</strong> their abiotic<br />
characteristics. This method is commonly used for habitat mapping, but is used here to<br />
attempt to distinguish archaeological sites from natural sites.<br />
The segmentation effort was focussed around Rathlin Island owing to the<br />
significance <strong>of</strong> this site in terms <strong>of</strong> shipwreck site distribution and submerged<br />
landscape potential and the time constraints involved in processing data in this<br />
manner. Full details <strong>of</strong> the processing effort are included in Appendix A.<br />
[ 40 ]
INSTAR Project 16702: <strong>Archaeological</strong> applications <strong>of</strong> the Joint Irish Bathymetric Survey [<strong>JIBS</strong>] data<br />
The segmentation was approached from two different perspectives. In the first<br />
instance, the raw data (sensor outputs) were classified using a commercial<br />
platform for semi-automated classification based on an unsupervised technique<br />
(QTC-Multiview). In the second, an independent unsupervised classification was<br />
performed on the geometric and radiometrically compensated backscatter<br />
imagery using industry standard image processing s<strong>of</strong>tware (ERDAS Imagine). An<br />
unsupervised method <strong>of</strong> classification was chosen in both approaches owing to<br />
the paucity <strong>of</strong> ground truth data over the site at large.<br />
In both instances, the classification process was complicated by variations in<br />
operational frequency and angular sector; resulting in both internal variations for<br />
systems such as the EM710; and across the survey area as a whole which was<br />
covered using several different systems (EM1002; EM3002D; EM710; Reson<br />
7125). There were additional complications owing to variations in pulse length<br />
and resultant operational frequency within sonar systems (particularly the EM710<br />
which has 3 pre-defined mode settings). In response to these issues, the<br />
segmentations were conducted in four separate classifications; two <strong>of</strong> which were<br />
variable by system, and three <strong>of</strong> which were variable by mode (pulse length). For<br />
the purposes <strong>of</strong> comparison, where possible the data were conditioned and<br />
processed in as close a manner as possible.<br />
5.3.2 QTC-Multiview<br />
The initial classification was achieved using Quester Tangent Corporation’s<br />
Multiview s<strong>of</strong>tware package. This s<strong>of</strong>tware has the capacity to perform an<br />
unsupervised classification <strong>of</strong> multibeam backscatter data based on the beamtime<br />
series backscatter imagery, and relative success using this approach has<br />
been reported in the literature (e.g. Robidoux et al., 2009; McGonigle et al.,<br />
2009; McGonigle et al., in press; Preston, 2009).<br />
The data were subjected to the QTC-Multiview processing flow. This method for<br />
processing multibeam backscatter imagery has been well described in the<br />
literature (eg. QTC, 2005; Robidoux et al., 2009; McGonigle et al., 2009;<br />
McGonigle et al., in press; Preston, 2009). The data were processed in cognisance<br />
<strong>of</strong> the existing sub-divisions <strong>of</strong> the <strong>JIBS</strong> area (described above).<br />
All survey lines which intersected areas A1_5, A1_6, A2_5, A2_6 and A3_6 were<br />
loaded and cleaned using a threshold <strong>of</strong> 1000. The volume <strong>of</strong> data for each<br />
respective system within each area is presented in Table 5.2. Quality control for<br />
the data was performed in the absence <strong>of</strong> the CARIS reject flags, which would<br />
have allowed for less data redundancy at the cleaning stage.<br />
Table 5.2: Distribution <strong>of</strong> survey lines (by acquisition system) relative to<br />
processing areas.<br />
AREA EM3002D (lines) EM710 (lines)<br />
A2_5 323 38<br />
A1_5 213 67<br />
A1_6 19 31<br />
A2_6 175 108<br />
A3_6 53 24<br />
Total 783 268<br />
Unresolved Errors 9 0<br />
The s<strong>of</strong>tware performs the segmentation based on the backscatter image data,<br />
which it does at one <strong>of</strong> a variety <strong>of</strong> scales. In this instance, the rectangle<br />
[ 41 ]
INSTAR Project 16702: <strong>Archaeological</strong> applications <strong>of</strong> the Joint Irish Bathymetric Survey [<strong>JIBS</strong>] data<br />
dimensions selected for the data were based on the footprint on the ground <strong>of</strong> a<br />
representative proportion <strong>of</strong> the survey lines. The average footprint (on the<br />
ground) <strong>of</strong> each rectangle was variable with depth. A 10-line sub-sample <strong>of</strong><br />
survey lines with rectangle dimensions <strong>of</strong> 257x17 pixels showed an average<br />
footprint <strong>of</strong> 13.7m across track against 8.9 m along track. Vessel speed was<br />
variable, averaging at 2.5 – 3 ms -1 . Ping rate was similarly variable, ranging from<br />
5.9 - 6.9 Hz across the sub-sample <strong>of</strong> EM3002D data.<br />
The next stage in the processing flow is the generation <strong>of</strong> vectors (FFVs). At the<br />
chosen settings, vectors were generated which describe the variation in the<br />
backscatter imagery contained within each rectangular sample. These are then<br />
reduced by Principal Components Analysis (PCA), in the manner described (QTC,<br />
2005), to the three values most responsible for the variance in the dataset. The<br />
data are then subjected to a simulated k-means algorithm, which attempts to<br />
amalgamate the vectors into statistically logical groups (Preston, 2009). Finally,<br />
the data are described by confidence (the probability that a record belongs to the<br />
class to which it has been assigned) and probability (the measure <strong>of</strong> the<br />
closeness to the cluster centre in the 3-D vector space) (QTC, 2005).<br />
Problems encountered<br />
Retrospectively, the choice <strong>of</strong> rectangle dimensions for the EM710 dataset may<br />
have been less appropriate than initially expected. However, the need to impose<br />
an amount <strong>of</strong> continuity to the data was the reason this choice was made. This<br />
point is further substantiated by the statement in the s<strong>of</strong>tware manual, which<br />
advises that “It is strongly recommended that the rectangle size be constant<br />
throughout all data sets in a survey” (QTC, 2005). The Reson7125 data<br />
(Meridian) were omitted from the classification process, owing to data format<br />
incompatibility with the s<strong>of</strong>tware. The multibeam data were supplied in Generic<br />
Sensor Format (.gsf) and eXtended Triton Format (.xtf) and QTC-Multiview does<br />
not support either <strong>of</strong> these two data types. These data formats represent<br />
processed data types which have been exported from CARIS, or a similar<br />
hydrographic processing package (e.g. Hypack). The raw sensor data from the<br />
Reson7125 is logged as either .s7k or .pds format. It is possible to convert.s7k to<br />
.pds retrospectively.<br />
5.3.3 QTC-Clams<br />
The categorical interpolation was performed in proprietary s<strong>of</strong>tware QTC-Clams<br />
The interpolation parameters were kept constant throughout each dataset. The<br />
final output grids were preserved at a 20 m cell size, as this was approximate to<br />
the average spatial footprint <strong>of</strong> the rectangular patches. This expedited the<br />
interpolation process significantly, without impacting the quality <strong>of</strong> the<br />
classification process. The interpolation parameters were tested iteratively, before<br />
accepting a 100m search radius based on the 35 points closest to the centre <strong>of</strong><br />
each grid node.<br />
Problems encountered<br />
The main issues with QTC-Clams are those which have been commonly reported<br />
in the literature (e.g. McGonigle et al., 2009; McGonigle et al., in press). The<br />
persistence <strong>of</strong> range dependent artefacts, dependence related to the orientation<br />
<strong>of</strong> survey lines and disparate data density in either across-track or along track<br />
dimensions all present problems in these series <strong>of</strong> classifications. However, they<br />
are a limitation <strong>of</strong> this approach for seafloor characterisation and have not<br />
occurred as a result <strong>of</strong> procedural inaccuracies/inconsistencies through the course<br />
<strong>of</strong> this research.<br />
[ 42 ]
INSTAR Project 16702: <strong>Archaeological</strong> applications <strong>of</strong> the Joint Irish Bathymetric Survey [<strong>JIBS</strong>] data<br />
5.3.4 Erdas Imagine 9.2<br />
The second classification was more user-directed, and was based on an<br />
unsupervised classification <strong>of</strong> the corrected backscatter imagery in ERDAS<br />
Imagine v.9.2. This effort was focussed on Church Bay area, Rathlin Island.<br />
Image statistics were recalculated and bin-sizes redefined prior to commencing<br />
the classification process. The isodata clustering approach was then used to<br />
define 5 discrete classes based on 5 iterations <strong>of</strong> the image. The image was<br />
filtered using a low-pass 7x7 window prior to being subjected to the classification<br />
procedure.<br />
5.3.5 ArcGIS transfer<br />
In addition to the material presented for ArcGIS above, a series <strong>of</strong> stages <strong>of</strong><br />
processing were undertaken in relation to the backscatter segmentation. The<br />
generation <strong>of</strong> classified vector data (QTC-Multiview output) and the classified<br />
interpolated surface (QTC-Clams) was achieved independently <strong>of</strong> ArcGIS,<br />
however, these data had to be conditioned in order to facilitate their import into<br />
the GIS environment. This was achieved using Geospatial Designs GridConvert<br />
(Evans, 2005) freeware to transform the data from Golden S<strong>of</strong>tware’s .grd format<br />
into generic ASCII grids. The classified vector data from QTC-Multiview also were<br />
used to produce inverse distance weighted interpolations <strong>of</strong> the Q1, Q2, Q3,<br />
Confidence and Probability values generated by processing. The provenance <strong>of</strong><br />
these values is discussed above. Metadata was written in accordance with ISO<br />
19115, and the filing and naming conventions were standardised. The data<br />
generated in the Erdas Imagine environment were interchangeable with ArcGIS<br />
by using .img image format. However, the unsupervised classification performed<br />
in Imagine was subjected to manual cleaning in ArcGIS to remove nadir striping,<br />
and to suppress obvious acquisition artefacts. This was achieved using ESRI’s<br />
Spatial Analyst extension by converting the surface to polygonal vectors, and<br />
manually editing the class values to force accordance with the surrounding areas.<br />
5.4 Seismic integration into SMT Kingdom Suite<br />
Seismic systems called sub-bottom pr<strong>of</strong>ilers are used to image sediment layers<br />
and bedrock beneath the seabed. Over the past ten years, the University <strong>of</strong> Ulster<br />
has acquired seismic data <strong>of</strong>f the north coast <strong>of</strong> Ireland using a Chirp sub-bottom<br />
pr<strong>of</strong>iler. Such Chirp systems can be classified as high-resolution seismic sources<br />
and are ideal for shallower coastal waters. Depending on the frequency used and<br />
the type <strong>of</strong> sediment, penetration can vary from 3m in very coarse sands to over<br />
100m in fine-grained sediments, with a vertical resolution between 10–40cm.<br />
• Workflow<br />
In the first instance, all Chirp data acquired by the University <strong>of</strong> Ulster were<br />
converted from 8mm Exabyte tape to DVD. As the University currently has no<br />
appropriate tape drive connected to a Unix/Linux system, this process was<br />
outsourced to Adaptatech Ltd., a London-based company specialised in<br />
duplication and replication <strong>of</strong> digital data. In total 16 tapes were converted to<br />
DVD, containing 11.63GB <strong>of</strong> seismic data.<br />
On inspection <strong>of</strong> the header information, it became apparent that no navigational<br />
data were available in the header. For some surveys, there was a separate digital<br />
record with (D)GPS coordinates, as recorded on the survey vessel, while for other<br />
surveys only the printed record was available. Where a digital record was found,<br />
[ 43 ]
INSTAR Project 16702: <strong>Archaeological</strong> applications <strong>of</strong> the Joint Irish Bathymetric Survey [<strong>JIBS</strong>] data<br />
the position <strong>of</strong> each shotpoint was linked to a position using the GPS time in the<br />
header and GPS time from the navigation file. In the case <strong>of</strong> the paper trace, a<br />
new digital record was created with the shotpoints’ GPS time and location. There<br />
was no record <strong>of</strong> the <strong>of</strong>fset between the ship’s (D)GPS antenna and the position<br />
<strong>of</strong> the Chirp system – it probably ranged from a few metres to up to several tens<br />
<strong>of</strong> metres. However, as the majority <strong>of</strong> the surveys were acquired using GPS<br />
positioning, with a horizontal accuracy <strong>of</strong> at best 30m or at worst in the order <strong>of</strong><br />
50-100m, layback correction would be smaller than the actual GPS-induced error.<br />
In the next step, all Chirp data and related navigational data were imported into<br />
SMT Kingdom, a windows-based seismic interpretation and visualization s<strong>of</strong>tware<br />
(some post processing is allowed). Navigational data were initially imported in<br />
WGS84, but were converted to UTM29N on request. All visualization and<br />
interpretation were made using UTM29N. A Geotiff <strong>of</strong> the multibeam bathymetric<br />
and backscatter data were imported, linking seabed features to sub-surface<br />
stratigraphy (Figure 5.14).<br />
Figure 5.14 Overview <strong>of</strong> the Chirp sub-bottom lines overlaid on a geotiff <strong>of</strong> the<br />
multibeam bathymetry as displayed in the base map in SMT Kingdom (note: the<br />
lack <strong>of</strong> colour bar associated with the bathymetry reflects the fact that this is a<br />
geotiff and not an actual grid with associated depth values).<br />
Subsequently, post-processing was performed, which aids interpretation <strong>of</strong> the<br />
seismic sections. On inspection <strong>of</strong> the data’s power spectrum, it became apparent<br />
that, although the spectrum should look like a bell shaped curve between 2-<br />
10kHz, two peaks were present in the data: one between 1-7kHz and one<br />
between 7.5-14kHz. From analysis <strong>of</strong> the data, it was decided that the higher<br />
frequency peak was probably caused by noise. Therefore, a bandpass filter was<br />
applied running from 2.5-3-7-7.25 kHz to select the lower frequency curve<br />
(Figure 5.15). Subsequently, automatic gain control was added to the filtered<br />
data. A filter length <strong>of</strong> 5, 10, 15 and 20 ms was tested – 10ms gave the best<br />
result, but all other filter lengths were kept as well. Finally, an envelope was<br />
applied to the processed data. This operator is commonly applied to Chirp data<br />
and enhances interpretability (Figure 5.16).<br />
[ 44 ]
INSTAR Project 16702: <strong>Archaeological</strong> applications <strong>of</strong> the Joint Irish Bathymetric Survey [<strong>JIBS</strong>] data<br />
Figure 5.15 Amplitude spectrum for the raw data (blue) and the bandpass<br />
filtered data using a 2.5-3-7-7.25kHz trapezoid filter (red).<br />
There was no record <strong>of</strong> tidal predictions or tide gauge data for any <strong>of</strong> the survey<br />
days, making it impossible to adjust the data accurately to Chart Datum. It was<br />
decided to link obvious features seen on the seismic lines, which in all likelihood<br />
have not changed significantly over the years (e.g. bedrock outcrops), to<br />
corresponding features and their depths as recorded from the multibeam data.<br />
Seismic cross-lines were used to further constrain the tidal height adjustment.<br />
The workflow is summarized as follows:<br />
> Create a navigation file with shotpoint, x, y, name <strong>of</strong> line<br />
> Load the navigation files into SMT Kingdom using the following workflow:<br />
surveys > import world coordinate > 2D by file > choose UTM29N<br />
> Load the Chirp data in SMT Kingdom using the following workflow: right click<br />
on the imported survey line in the work tree > import > segy. Select the correct<br />
line and the correct byte numbers and sample interval. When the ‘assign 2D<br />
shotpoints to traces’ pops up, define the shotpoint and trace numbers by copying<br />
the full range into the appropriate box.<br />
> For processing in SMT Kingdom: go to Tools > TracePAK > Process Multiple<br />
Traces > Select the lines and data type > select the processes you want to<br />
perform<br />
> Import a Geotiff from ArcGIS into SMT Kingdom. First export the required map<br />
in ArcGIS using the following workflow: file > export map (make sure to tick the<br />
box that says ‘save world file (tfw)’). Import into SMT Kingdom using: Culture ><br />
import > culture group.<br />
[ 45 ]
INSTAR Project 16702: <strong>Archaeological</strong> applications <strong>of</strong> the Joint Irish Bathymetric Survey [<strong>JIBS</strong>] data<br />
Figure 5.16 Processing steps performed to enhance the seismic lines and aid<br />
interpretation.<br />
[ 46 ]
INSTAR Project 16702: <strong>Archaeological</strong> applications <strong>of</strong> the Joint Irish Bathymetric Survey [<strong>JIBS</strong>] data<br />
• Issues encountered with the data<br />
The first issue was the lack <strong>of</strong> corrected navigational data written into the header<br />
<strong>of</strong> the seismic data. On further examination, it appeared that the older data were<br />
acquired with GPS and that a layback correction would not account for the fact<br />
that the horizontal positional accuracy would at best be ±30m. The more recent<br />
data, which have DGPS navigation accuracy (±3m), were acquired with the Chirp<br />
system towed relatively close to the survey vessel and thus, the positional<br />
accuracy should be within a few metres. When comparing features on the seismic<br />
lines with the multibeam data, the horizontal accuracy <strong>of</strong> the seismics is within<br />
the accuracies predicted for the navigational system used.<br />
The tidal height issue was tackled using the interactive vertical shift tool in SMT<br />
Kingdom. However, the fact that there is a navigational error and the velocity <strong>of</strong><br />
sound through the water is not accurately known (this is needed to convert the<br />
measured two-way travel time into a depth measurement), means that the final<br />
result is very much an approximation. Nonetheless, by using the seismic data in<br />
association with the multibeam data, it is possible to determine a rough<br />
calculation for the depth <strong>of</strong> buried strata (this in turn will depend on the velocity<br />
<strong>of</strong> sound through the sediments).<br />
The third issue encountered had to do with a limitation <strong>of</strong> the SMT Kingdom<br />
s<strong>of</strong>tware which is mainly geared towards the oil and gas industry, thus dealing<br />
with lower frequency seismic data used for imaging deeper structures. When<br />
processing needs to be performed, SMT Kingdom is only able to cope with data<br />
that have a sampling rate <strong>of</strong> >0.05 ms (= Nyquist frequency <strong>of</strong> 10000 Hz). The<br />
raw Chirp data have a sampling rate <strong>of</strong> 0.031 ms (= Nyquist frequency <strong>of</strong> 16129<br />
Hz) and resampling to 0.05ms would mean losing all data above 10 kHz.<br />
Although we currently use a bandpass filter to eliminate all frequencies above 7.5<br />
kHz, we might still need the higher frequencies for future analysis. Therefore, the<br />
sampling rate was manually overwritten in SMT Kingdom during data import from<br />
0.031ms to 0.031 s. This means that, instead <strong>of</strong> the data being in the 2-12 kHz<br />
range, the s<strong>of</strong>tware thinks the data are in the 2-12 Hz range with a Nyquist<br />
frequency <strong>of</strong> 16.129 Hz. In other words, kHz becomes Hz and milliseconds<br />
become seconds, allowing us to perform any processing we wish without any<br />
need for resampling.<br />
A final issue relates to a problem with some <strong>of</strong> the data for interpretation. Firstly,<br />
much <strong>of</strong> data have been acquired in areas with a gravelly or coarse sandy<br />
seabed. The high frequency signal <strong>of</strong> the Chirp system is known to be subject to<br />
scattering and high attenuation in these sedimentary types, thus not imaging the<br />
deeper structures (Figure 5.17). Secondly, on some <strong>of</strong> the survey days there<br />
must have been a great deal <strong>of</strong> swell/strong waves. This makes it difficult to<br />
interpret the subsurface unless the seabed can be artificially flattened in the<br />
s<strong>of</strong>tware (Figure 5.18). Although this is possible in SMT Kingdom, it also means<br />
that all sedimentary features (e.g. sand ripples, sand waves) are flattened.<br />
Without any metadata about the sea-state during acquisition, it is also impossible<br />
to know which features are caused by surface waves and which are actual<br />
sedimentary features.<br />
[ 47 ]
INSTAR Project 16702: <strong>Archaeological</strong> applications <strong>of</strong> the Joint Irish Bathymetric Survey [<strong>JIBS</strong>] data<br />
Figure 5.17 Example <strong>of</strong> Chirp pr<strong>of</strong>ile acquired over gravelly seafloor (typically<br />
characterized by the diffraction hyperbolae) – note that there is no further<br />
penetration through the seabed.<br />
Figure 5.18a) Example <strong>of</strong> Chirp pr<strong>of</strong>ile acquired during adverse weather<br />
conditions (waves). b) The same pr<strong>of</strong>ile but with seabed flattened reveals a more<br />
complex infill feature.<br />
[ 48 ]
INSTAR Project 16702: <strong>Archaeological</strong> applications <strong>of</strong> the Joint Irish Bathymetric Survey [<strong>JIBS</strong>] data<br />
5.5 GIS – spatial integration <strong>of</strong> data sets<br />
Three designated GIS projects have been developed - one project for shipwreck<br />
investigation, one for investigation <strong>of</strong> submerged landscapes and one with the<br />
results <strong>of</strong> the backscatter segmentation.<br />
For all three projects, the quadrants with processed 1m multibeam and<br />
backscatter data were exported from IVS Fledermaus in ascii raster format. These<br />
were then converted into ERDAS Imagine grids (float data type) using the<br />
ArcCatalog ASCII to raster conversion tool. All grids were georeferenced and<br />
projected in UTM Zone 29N. Subsequently, a mosaic was created in ArcCatalog<br />
using the <strong>Data</strong> Management Tool (raster > mosaic to new raster) with<br />
parameters set to 32-bit float for the pixel type and choosing the LAST mosaic<br />
method for the bathymetry mosaic and the BLEND mosaic method for the<br />
backscatter mosaic (Figures 5.19 and 5.20). As the backscatter was acquired with<br />
five different systems, five backscatter mosaics were created. In ArcMAP the<br />
colour histograms <strong>of</strong> the backscatter data were manually manipulated to make<br />
the transition between the datasets as seamless as possible. In order to do that,<br />
all backscatter data were normalised, with a value <strong>of</strong> 0 indicating a high<br />
backscatter value (i.e. hard substrate) and a value <strong>of</strong> 1 indicating a low<br />
backscatter value (i.e. s<strong>of</strong>t substrate). However, due to the mode changes (and<br />
associated changes in the frequencies <strong>of</strong> the emitted pulses) <strong>of</strong> the EM710 and<br />
compensation problems with the Reson7125, it has been impossible to create a<br />
single backscatter map on which the boundaries between the different datasets<br />
disappear. As said before, caution must be taken when interpreting these maps<br />
without groundtruthing information.<br />
The 1m bathymetric grid was post-processed using Spatial Analyst within ArcGIS<br />
to derive a hillshaded image, bathymetric contour lines and slope angles (Figure<br />
5.21).<br />
Figure 5.19 Overview map <strong>of</strong> the <strong>JIBS</strong> bathymetric data gridded to 1m and<br />
entered into a GIS environment.<br />
[ 49 ]
INSTAR Project 16702: <strong>Archaeological</strong> applications <strong>of</strong> the Joint Irish Bathymetric Survey [<strong>JIBS</strong>] data<br />
Figure 5.20 Overview map <strong>of</strong> the <strong>JIBS</strong> backscatter data gridded to 1m and<br />
entered into a GIS environment.<br />
Figure 5.21 Slope map for the <strong>JIBS</strong> 1m bathymetric dataset, created in ArcGIS.<br />
Ancillary and updated datasets that have been integrated in the GIS during Phase<br />
2 include:<br />
[ 50 ]
INSTAR Project 16702: <strong>Archaeological</strong> applications <strong>of</strong> the Joint Irish Bathymetric Survey [<strong>JIBS</strong>] data<br />
• (Terrestrial) Sites and Monuments Records (SMRs). These record data on<br />
3,129 archaeological sites and historic monuments for Co. Donegal and<br />
16,020 sites for Co.’s Derry and Antrim, ranging from prehistoric tombs to<br />
post-medieval settlements and were provided to us by the Department <strong>of</strong><br />
Environment, Heritage and Local Government (DEHLG) for Co. Donegal<br />
(available on http://www.archaeology.ie/smrmapviewer/mapviewer.aspx )<br />
and by the Northern Ireland Environment Agency (NIEA) for the Counties<br />
in Northern Ireland.<br />
• Maritime Sites and Monuments Records (MSMRs) for Counties Donegal,<br />
Derry and Antrim. These were provided by the DEHLG for Co. Donegal and<br />
by the NIEA for Co.’s Derry and Antrim and were updated in 2009 (Figure<br />
5.22).<br />
• Shuttle Radar Topography Mission (SRTM) data. This data is freely<br />
downloadable through the USGS “The National Map Seamless Server”<br />
(http://seamless.usgs.gov/ or ftp://e0srp01u.ecs.nasa.gov/srtm/ ). SRTM<br />
is an international effort to obtain digital elevation models on a global<br />
scale using radar interferometry. <strong>Data</strong> used for this study consist <strong>of</strong><br />
SRTM3 data with a sample spacing <strong>of</strong> 3-arc seconds. These data were<br />
used to link the terrestrial topography to the acquired marine bathymetry<br />
(Figures 5.22 and 5.23).<br />
• Most up-to-date UKHO wreck record, received July 2009 (Figure 5.22).<br />
• Raster and vector versions <strong>of</strong> all Admiralty Charts for the north coast.<br />
• Navigational data for the acquired Chirp sub-bottom pr<strong>of</strong>iler lines.<br />
• Sport diver wreck records for the Counties Donegal, Derry and Antrim.<br />
These are publically available on http://www.irishwrecksonline.net/.<br />
• <strong>Data</strong> interpretations (anomalies, features, archaeological potential)<br />
detected during Phase 1 <strong>of</strong> the project<br />
Figure 5.22 Overview map <strong>of</strong> the <strong>JIBS</strong> bathymetric data gridded to 1m, showing<br />
documented shipwrecks <strong>of</strong>f the north coast <strong>of</strong> Ireland.<br />
[ 51 ]
INSTAR Project 16702: <strong>Archaeological</strong> applications <strong>of</strong> the Joint Irish Bathymetric Survey [<strong>JIBS</strong>] data<br />
Figure 5.23 Overview map <strong>of</strong> the <strong>JIBS</strong> bathymetric data gridded to 1m, showing<br />
the three identified anomaly classes from Phase 1 <strong>of</strong> the project.<br />
In addition to the processing work, all datasets discussed above have been<br />
updated such that all associated metadata have been entered using ISO standard<br />
19115.<br />
[ 52 ]
INSTAR Project 16702: <strong>Archaeological</strong> applications <strong>of</strong> the Joint Irish Bathymetric Survey [<strong>JIBS</strong>] data<br />
6. RESULTS<br />
The results described below concentrate on the new results developed during<br />
Phase 2 <strong>of</strong> the project. For details on the results from Phase 1, please refer to the<br />
2008 report. The results section below is structured around the project<br />
objectives.<br />
6.1 Refining palaeo-geographies – The Skerries case study<br />
The Skerries are a chain <strong>of</strong> islands formed by a dolerite sill and extend <strong>of</strong>f the<br />
coast <strong>of</strong> Co. Antrim, east <strong>of</strong> Portrush (Figures 6.1 and 6.2). They enclose an area<br />
<strong>of</strong> c. 2 km 2 and were identified in Phase 1 <strong>of</strong> the project as a region <strong>of</strong> high<br />
archaeological potential for the preservation <strong>of</strong> submerged prehistoric material.<br />
This interpretation was derived using the lower resolution 4m and 6m multibeam<br />
bathymetric datasets (see Phase 1 report). The following sections provide an<br />
updated interpretation <strong>of</strong> the palaeo-geography and archaeological potential <strong>of</strong><br />
this area using combined higher (1m) resolution multibeam bathymetry and<br />
seismic pr<strong>of</strong>iles from Chirp sub-bottom surveys.<br />
Figure 6.1 Overview map <strong>of</strong> part <strong>of</strong> the Northern Ireland <strong>JIBS</strong> bathymetric data<br />
gridded to 1m, showing location <strong>of</strong> the Skerries.<br />
[ 53 ]
INSTAR Project 16702: <strong>Archaeological</strong> applications <strong>of</strong> the Joint Irish Bathymetric Survey [<strong>JIBS</strong>] data<br />
Figure 6.2 Photo showing the Skerries and mainland coast looking to the west.<br />
Palaeo-geographic reconstruction<br />
The changing palaeo-geography <strong>of</strong> the Skerries at selected time intervals is<br />
shown in Figure 6.3. At 14,000 BP, based on the Glacio-Isostatic Adjustment<br />
(GIA) model <strong>of</strong> Brooks et al. (2008), relative sea-level (RSL) in this area was<br />
approximately 13.5m below present (Figure 6.3a). Although there is currently no<br />
archaeological evidence for an occupation <strong>of</strong> Ireland at this time, recent evidence<br />
which pushes the occupation <strong>of</strong> Scotland (visible from north coast <strong>of</strong> Ireland)<br />
back to 14,000 BP (Saville et al., 2007) shows that there is no reason why an<br />
earlier occupation should not be considered. Based on the palaeo-geographic<br />
reconstruction, the coastline extended out by several hundred metres up to a<br />
kilometre and with the Skerries themselves directly linked to the mainland<br />
forming a sheltered embayment with water depths <strong>of</strong> c. 5 to 10m. The next<br />
timestep modelled is 12,000 BP (Figure 6.3b). Again, there is no recorded Irish<br />
occupation, but the comments made above in reference to the Scottish situation<br />
still apply. RSL was still broadly similar to the previous timestep (-14m vs. -<br />
13.5m) though the Brooks et al. (2008) model predicts that RSL may have risen<br />
by several metres and then fallen again in the intervening period (Figure 6.3f). By<br />
10,000 BP (Figure 6.3c), the period <strong>of</strong> the first known Mesolithic occupation, RSL<br />
was rising and had reached -9.5m. The sheltering embayment was now flooded,<br />
and the Skerries separated from the mainland. The mainland palaeo-coastline<br />
was open and linear and still extended out from the modern beach by several<br />
hundred metres. Although the embayment had gone, the Skerries were still<br />
extended by lowered sea-levels and may have afforded more shelter to the<br />
coastline than at present. RSL rose rapidly over the next thousand years,<br />
reaching -5m by 9000 BP (Figure 6.3d). The palaeo-shoreline was now a strip<br />
extending the modern shoreline by several tens to low hundred metres. By 8000<br />
BP, RSL had broadly reached present levels (-1.5m) and the palaeo-coastline was<br />
situated in the vicinity <strong>of</strong> the modern low tide mark (Figure 6.3e)<br />
[ 54 ]
INSTAR Project 16702: <strong>Archaeological</strong> applications <strong>of</strong> the Joint Irish Bathymetric Survey [<strong>JIBS</strong>] data<br />
Figure 6.3 Palaeo-geographic reconstruction based on <strong>JIBS</strong> 1m multibeam<br />
bathymetry. Terrestrial DEM is provided by the SRTM dataset. Boundary between<br />
the blue and light green areas shows the palaeo-shoreline, areas shaded<br />
turquoise show the position <strong>of</strong> the maximum lowstand thus providing an<br />
indication <strong>of</strong> the degree <strong>of</strong> land loss. A) 14,000 BP, RSL at -13.5m. B) 12,000 BP,<br />
RSL at -14m. C) 10,000 BP, RSL at -9.5m. D) 9,000 BP, RSL at -5m. E) 8,000 BP,<br />
RSL at -1.5m. F) GIA modelled curve from Brooks et al. (2008) showing position<br />
<strong>of</strong> modelled timesteps along the RSL curve.<br />
[ 55 ]
INSTAR Project 16702: <strong>Archaeological</strong> applications <strong>of</strong> the Joint Irish Bathymetric Survey [<strong>JIBS</strong>] data<br />
Seismic stratigraphy<br />
An extensive seismic (CHIRP sub-bottom) survey <strong>of</strong> the Skerries study area was<br />
undertaken in 1997 (Figure 6.4). The following sections discuss the seismic<br />
stratigraphy <strong>of</strong> the Skerries and its relationship to RSL and palaeo-geographic<br />
change by reference to a pr<strong>of</strong>ile taken from the western side <strong>of</strong> the Skerries (see<br />
Figure 6.4 for pr<strong>of</strong>ile location). At least seven stratigraphic units can be observed<br />
in this pr<strong>of</strong>ile, indicating a complex pattern <strong>of</strong> sedimentation and erosion beneath<br />
the modern seabed (Figure 6.5).<br />
Figure 6.4 Tracklines <strong>of</strong> the Chirp survey undertaken in 1997 overlain in SMT<br />
Kingdom onto A) <strong>JIBS</strong> 1m bathymetry geotiff. B) <strong>JIBS</strong> 1m backscatter. Red lines<br />
shows position <strong>of</strong> seismic section discussed in the text.<br />
Interpretation <strong>of</strong> the pr<strong>of</strong>ile is based on the sedimentary sequence observed at<br />
Portballintrae (c.5 km to the east; McCabe et al., 1994), and previous research<br />
[ 56 ]
INSTAR Project 16702: <strong>Archaeological</strong> applications <strong>of</strong> the Joint Irish Bathymetric Survey [<strong>JIBS</strong>] data<br />
on the <strong>of</strong>fshore stratigraphy <strong>of</strong> the Skerries area (Cooper et al., 2002). The<br />
sequence seen in Figure 6.5 is interpreted as follows and summarised in Table<br />
6.1.<br />
Acoustic basement (Unit B) is interpreted as bedrock. This is indicated by a lack<br />
<strong>of</strong> seismic penetration and relief that is similar to known rocky outcrops imaged<br />
on other seismic lines. It is uncertain whether this acoustic basement relates to<br />
the dolerite sill forming the Skerries or a basalt or chalk outcrop similar to those<br />
presently seen onshore (see Figure 6.2).<br />
Unit D overlying Unit B is interpreted as diamicton, deposited in a glacio-marine<br />
setting by a retreating ice sheet. This unit can be seen at Portballintrae where it<br />
comprises <strong>of</strong> massive muds with dispersed pebbles, cobbles and boulders. Unit D<br />
can be divided into two units with the lower unit clearly showing point reflectors<br />
and chaotic bedding and the upper unit characterized by greater acoustic<br />
transparency with some point reflectors. Based on the acoustic signature these<br />
units were interpreted as lodgement till deposited under the ice (higher<br />
proportion <strong>of</strong> coarse material) draping the bedrock and grading into waterlain till<br />
(higher proportion <strong>of</strong> fines with occasional boulder) deposited at the ice front as it<br />
retreated.<br />
Overlying Unit D is Unit SM, a coarsening upwards sequence <strong>of</strong> muds, silts and<br />
sands deposited in a shallow marine setting following further ice retreat. Such a<br />
sequence can be seen in the exposed section at Portballintrae overlying the<br />
diamicton (McCabe et al., 1994). Interpretation <strong>of</strong> a coarsening upward sequence<br />
is based on the transition from largely acoustic transparent deposits at the base<br />
<strong>of</strong> the unit to medium high amplitude sub parallel reflectors and then to gravel<br />
rich deposits where the unit outcrops on the seabed (as shown by high amplitude<br />
point reflectors). The presence <strong>of</strong> gravel on the seabed in this area is also<br />
supported from by the high values shown in the backscatter data. The coarsening<br />
upwards nature <strong>of</strong> Unit SM is created by the decrease in water levels as isostatic<br />
rebound resulted in RSL fall. This brought the seabed increasingly into mean<br />
wave base resulting in winnowing <strong>of</strong> the finer fractions and then a transition to<br />
sand and gravel rich shoreface deposits. The higher concentration <strong>of</strong> gravel where<br />
this deposit is exposed at the seabed is also a function <strong>of</strong> winnowing by modern<br />
currents. Whether the sequence exhibits the same level <strong>of</strong> preservation as the<br />
Portballintrae sequence, where rhythmically bedded sands and muds<br />
corresponding to episodic storm events can be observed, is uncertain. The<br />
uppermost boundary <strong>of</strong> this unit forms an unconformity possibly created by wave<br />
action as RSL fell.<br />
Unit SM is covered, in the southern section <strong>of</strong> the pr<strong>of</strong>ile by unit RS. This is<br />
interpreted as a series <strong>of</strong> regressing sand deposits that formed as RSL fell (see<br />
Cooper et al., 2002). With continued RSL fall to the lowstand, the sand sheet was<br />
subaerially exposed and eroded (unconformity) and possibly overlain by a thin<br />
veneer <strong>of</strong> terrestrial sediment (soil formation). Consequently, the bright reflector<br />
above Unit SM is classified as Unit T. In other seismic pr<strong>of</strong>iles within the study<br />
area channel features can be seen cutting though Unit T.<br />
As RSL rose again following the lowstand, the terrestrial surface was probably, in<br />
some areas, eroded by wave action or in other cases, covered by beach<br />
sediment, as represented by Unit BS. The acoustic signature <strong>of</strong> Unit BS is similar<br />
to its overlying deposit, Unit MS. This latter unit comprises modern marine sand,<br />
the source <strong>of</strong> which is reworking <strong>of</strong> Units SM and RS and can be observed over<br />
large parts <strong>of</strong> the study area.<br />
[ 57 ]
INSTAR Project 16702: <strong>Archaeological</strong> applications <strong>of</strong> the Joint Irish Bathymetric Survey [<strong>JIBS</strong>] data<br />
Within the seismic pr<strong>of</strong>ile, it is clear that Units RS, T, BS and MS are restricted to<br />
the southern half, with the northern half represented by the winnowed gravelly<br />
surface <strong>of</strong> Unit SM. The high gravel content <strong>of</strong> this area may be explained by<br />
transgressive and modern erosion removing the finer sediment from Unit SM and<br />
carrying it onshore by wave and tidal action to bury Units RS, T and BS. The<br />
pattern <strong>of</strong> erosion (erosion in the northern half, deposition in the southern half) is<br />
explained by proximity to a gap between Ramore Head and the westernmost<br />
island <strong>of</strong> the Skerries. This narrow (c. 350m) gap funnels strong tidal currents<br />
into the Skerries resulting on localized erosion (see backscatter plot Figure 6.4b).<br />
Figure 6.5 Seismic pr<strong>of</strong>ile from the Skerries showing A) uninterpreted data and<br />
B) interpreted stratigraphy (see text and table 6.1 for description and Figure 6.4<br />
for pr<strong>of</strong>ile location).<br />
[ 58 ]
INSTAR Project 16702: <strong>Archaeological</strong> applications <strong>of</strong> the Joint Irish Bathymetric Survey [<strong>JIBS</strong>] data<br />
Table 6.1 Summary table showing seismic sequence from pr<strong>of</strong>ile in the<br />
Skerries, stratigraphic interpretation and RSL change.<br />
<strong>Archaeological</strong> implications<br />
1) Palaeo-geographic reconstruction<br />
Analysis <strong>of</strong> seismic data shows that considerable variations in sedimentation have<br />
taken place since the ice retreated. Consequently, the exact geometry <strong>of</strong> the<br />
palaeo-shoreline represented in Figure 6.3 should still be taken as a first order<br />
approximation despite the use <strong>of</strong> higher resolution bathymetry. It is clear from<br />
the seismic data, that much <strong>of</strong> the modern seabed is comprised <strong>of</strong> sand reworked<br />
[ 59 ]
INSTAR Project 16702: <strong>Archaeological</strong> applications <strong>of</strong> the Joint Irish Bathymetric Survey [<strong>JIBS</strong>] data<br />
from earlier deposits. In some instance, this sand has buried pre-existing<br />
deposits while in other instances, the pre-existing deposits have completely<br />
eroded. This can be illustrated by reference to the channel feature shown in<br />
Figure 6.3, the presence <strong>of</strong> which controls the existence <strong>of</strong> the reconstructed<br />
lowstand embayment. In this example, it is highly probably that Units RS and T<br />
were once more laterally extensive, stretching out across the area now occupied<br />
by the channel. However, with RSL rise breaching the Skerries and the funnelling<br />
<strong>of</strong> strong tidal currents into the gap between Ramore Head and the westernmost<br />
island <strong>of</strong> the Skerries, localized erosion resulted in reworking <strong>of</strong> Units RS, T and<br />
the uppermost levels <strong>of</strong> SM such that finer sediments (sands) are removed and<br />
deposited onshore to form Unit MS. The coarser deposits are left behind in the<br />
channel to form the gravel rich outcrop at the seabed. Effectively, the sides <strong>of</strong> the<br />
channel are higher than during the lowstand, while its base is lower and it is likely<br />
that the lowstand Skerries may have been characterised by a more extensive<br />
level surface rather than the reconstructed embayment which may have formed<br />
later (i.e. during the period <strong>of</strong> RSL rise).<br />
2) Preservation <strong>of</strong> archaeological deposits<br />
In phase 1, the entirety <strong>of</strong> the Skerries was defined as an area <strong>of</strong> high<br />
archaeological potential. However, integration <strong>of</strong> high-resolution bathymetry with<br />
backscatter data and seismic pr<strong>of</strong>iles allows further refinement <strong>of</strong> this<br />
classification. <strong>Archaeological</strong> deposits are most likely located on or within Unit T,<br />
which may be preserved where it is buried beneath Units MS and BS. The<br />
winnowed surface <strong>of</strong> Unit SM, which is potentially exposed over large areas within<br />
the Skerries (see Figure 6.5) is <strong>of</strong> low archaeological potential, though it is<br />
possible that lithics in secondary context may still be present as a lag deposit.<br />
3) Targets for ground-truthing and archaeological sampling<br />
Validation <strong>of</strong> the above preliminary interpretation requires ground-truthing <strong>of</strong> the<br />
seismic pr<strong>of</strong>iles by sediment sampling. Priority ground-truthing targets include<br />
grabs <strong>of</strong> Unit SM where it lies exposed on the seabed, and Units RS and T where<br />
they pinch out close to the seabed. Coring <strong>of</strong> Units T and RS where they lie close<br />
to the seabed surface is also a priority as they <strong>of</strong>fer the highest potential for<br />
containing archaeological remains and associated palaeo-environmental evidence.<br />
6.2 Target sites identified for direct sampling<br />
2009 Marine Institute ship-time funding<br />
In 2009, the investigators were successful in securing ship-time on the state<br />
Research Vessel Celtic Explorer (see section 7 for further details) to continue to<br />
acquire data and samples within the <strong>JIBS</strong> study area. The cruise, operating from<br />
16 th to 21 st December 2009, will concentrate efforts on acquiring additional<br />
acoustic, video and direct sample data from study sites deemed <strong>of</strong> highest<br />
archaeological potential. The total value <strong>of</strong> this cruise is 112,000, funded<br />
through the auspices <strong>of</strong> the Marine Institute’ ship-time programme.<br />
Three main phases <strong>of</strong> data acquisition are planned for this cruise:<br />
[1] Seismic pr<strong>of</strong>iles will be acquired around Rathlin Island and through the length<br />
<strong>of</strong> Lough Foyle to aid detailed palaeo-geographic reconstructions <strong>of</strong> these highpotential<br />
areas.<br />
[ 60 ]
INSTAR Project 16702: <strong>Archaeological</strong> applications <strong>of</strong> the Joint Irish Bathymetric Survey [<strong>JIBS</strong>] data<br />
[2] Time-lapse multi-beam bathymetric surveys will be conducted over two<br />
shipwreck sites to capture short-term change as an aid to producing time-stepped<br />
wreck site formation models.<br />
[3] Sediment samples will be acquired at high-potential sites with a view towards<br />
particle size analyses and dating <strong>of</strong> any organic material sampled from the grabs<br />
and cores. These data have the potential to constrain sediment mobility models<br />
and provide sea-level index points. Additionally, optical data will be acquired at<br />
each sample station to reinforce geological and archaeological interpretations.<br />
2010 initiatives<br />
In addition to the 2009 cruise, the investigators have submitted a 2010 proposal<br />
to the Marine Institute ship-time programme, with a view to returning to the<br />
study area next year to collect more acoustic and geological samples to further<br />
constrain interpretations.<br />
Furthermore, we are currently completing a NERC proposal for submission to the<br />
National Facility for Scientific Diving (NFSD) for support to ground-truth<br />
archaeological interpretations <strong>of</strong> the <strong>JIBS</strong> data. This proposal follows the remit <strong>of</strong><br />
the NERC Science Based Archaeology panel, namely to:<br />
[1] Assess marine archaeological prospecting techniques with a view to<br />
identifying and investigating submerged landscapes; and<br />
[2] To investigate processes affecting the underwater archaeological record,<br />
namely how contemporary and past processes impact the geological signatures <strong>of</strong><br />
inundated archaeological landscapes and how contemporary physical processes<br />
act to impart primary control on shipwreck site formation.<br />
Ground-truthing will take the form <strong>of</strong> visual inspection and sampling on targeted<br />
sites, assessing the range <strong>of</strong> materials exposed on the seafloor (lithics etc.) and<br />
sampling dateable material (peat etc.).<br />
6.3 Refining shipwreck site formation models and site IDs<br />
6.3.1 Results from automated segmentation <strong>of</strong> backscatter<br />
The results <strong>of</strong> each classification are presented independently before being<br />
integrated as a composite classified dataset. The coverage <strong>of</strong> each respective<br />
system (EM3002D and EM710 [modes 01; 02 and 03]) is demonstrated in Figure<br />
6.6. As the binary mask polygons were created from the bounds <strong>of</strong> each<br />
individual classification, there is some overlap at the edges <strong>of</strong> each area. This<br />
extended area is due to the interpolation process, based on the classified vectors.<br />
The level <strong>of</strong> transparency has been set to 50% for each layer, and the order <strong>of</strong><br />
display has been set to show the most resolute data first in order to enhance<br />
visualization <strong>of</strong> the data.<br />
[ 61 ]
INSTAR Project 16702: <strong>Archaeological</strong> applications <strong>of</strong> the Joint Irish Bathymetric Survey [<strong>JIBS</strong>] data<br />
Figure 6.6 Study site for backscatter segmentation. The different coloured<br />
polygons show changes in acquisition system and within system variations in<br />
operational frequency related to pulse length. The position in the key is indicative<br />
<strong>of</strong> the drawing order in the map.<br />
EM3002D (Jetstream)<br />
A selection <strong>of</strong> results from the EM3002 (293-307 kHz) classification are presented<br />
in Figure 6.7. Figure 6.7a shows the overall coverage <strong>of</strong> the EM3002D data in the<br />
context <strong>of</strong> mainland North Antrim and Rathlin Island. This classification, based on<br />
sampling at a scale <strong>of</strong> 257x17 pixels, resulted in 679,826 vectors being submitted<br />
to the classification process. Of these, a random 40,000 records were subjected<br />
to the clustering algorithm over 5 iterations, from which QTC-Multiview defined<br />
15 as the optimum number <strong>of</strong> classes. The results <strong>of</strong> the second method <strong>of</strong><br />
unsupervised classification (Erdas Imagine v. 9.2: Isodata) are presented in<br />
Figure 6.7a*. This shows a very coherent linear identification <strong>of</strong> many <strong>of</strong> the<br />
principal features evident in the backscatter mosaics, and is based on the 1m<br />
gridded backscatter imagery.<br />
The classification process has identified 3 principal classes, and several<br />
gradational transitions between them. The colour <strong>of</strong> the classes is indicative <strong>of</strong><br />
their acoustic similarity (for example; classes 8, 10, 13 and 14 [pink] are<br />
identified by the s<strong>of</strong>tware as being acoustically similar, as are classes 2, 9 and 12<br />
[teal]; and 3, 4, 5 and 15 [blue]). The geographic distributions <strong>of</strong> the classes are<br />
presented pre- and post-interpolation in Figure 6.7 (a, a* and e). From this, it is<br />
evident that the main occurrence <strong>of</strong> classes 8, 10, 13 and 14 (pink) is restricted<br />
to Church Bay (Figure 6.7a inset detail) and <strong>of</strong>fshore from Ballycastle. There are<br />
[ 62 ]
INSTAR Project 16702: <strong>Archaeological</strong> applications <strong>of</strong> the Joint Irish Bathymetric Survey [<strong>JIBS</strong>] data<br />
other significant instances <strong>of</strong> these classes, but they do not form large<br />
aggregations. Many <strong>of</strong> these are lost after interpolation (Figure 6.7e). The<br />
detailed area in Figure 6.7a shows the classified vector data in Church Bay. Note<br />
the presence <strong>of</strong> strong linear artefacts aligned northwest-southeast. These are<br />
related to poor range compensation and follow the orientation <strong>of</strong> the vessel<br />
heading during acquisition.<br />
The teal classes (2, 9, 12) cover the majority <strong>of</strong> the central portion <strong>of</strong> Rathlin<br />
Sound, and show a marked gradation approaching the shore <strong>of</strong> both Rathlin and<br />
the mainland. The blue classes (3, 4, 5 and 11) are concentrated around the<br />
north and southeast sides <strong>of</strong> the Island at Kinramer, and around Fair Head on the<br />
mainland. Figures 6.7 (b, c and d) show the inverse distance weighted<br />
interpolations <strong>of</strong> the principal components values Q1, Q2 and Q3 from the<br />
s<strong>of</strong>tware QTC-Multiview. These are the values most responsible for the variation<br />
in the acoustic data as described by the s<strong>of</strong>tware; as such they form the basis for<br />
the classifications. Several <strong>of</strong> the classes (6 and 7) did not survive the<br />
interpolation process (Figure 6.7e), although these are present in the classified<br />
vector datasets (Figure 6.7a). Figures 6.7 (f and g) show the interpolated<br />
confidence and probability values associated with the classification procedure.<br />
Note the geographic variation in these values and the corresponding classes with<br />
which they occur (Figure 6.7a and e).<br />
A comparison <strong>of</strong> the different classification approaches to a known wreck site is<br />
summarised in Figure 6.8. Figure 6.8a shows the location <strong>of</strong> the remains <strong>of</strong> HMS<br />
Drake in Church Bay, Rathlin Island. The highlighted red box is a 0.8km 2 area<br />
centred on the wreck, and is the focal area for the remainder <strong>of</strong> the figures (6.8be).<br />
Figure 6.8b shows the wreck site and context as evidenced by the backscatter<br />
mosaic. The classified vector data set has identified something different from the<br />
surrounding area, but has classified this as similar to the teal classes (2, 9, 12)<br />
closer to the eastern edge <strong>of</strong> the image. Notice that there are also data gaps<br />
around the wreck site. This may be due to the application <strong>of</strong> a threshold to the<br />
data, whereby data anomalous to their surrounding neighbours may have been<br />
omitted from the classification process. The results <strong>of</strong> the unsupervised<br />
classification process conducted in Erdas Imagine have identified the wreck site<br />
as being distinct from both the surrounding areas, and the teal classes in the east<br />
<strong>of</strong> the image.<br />
[ 63 ]
INSTAR Project 16702: <strong>Archaeological</strong> applications <strong>of</strong> the Joint Irish Bathymetric Survey [<strong>JIBS</strong>] data<br />
Figure 6.7 a) QTC-Multiview classification results for Jetstream EM3002D<br />
[Classified vector dataset]. Inset detail <strong>of</strong> Church Bay, Rathlin Island (position<br />
indicated by red box). a*) Results <strong>of</strong> manual segmentation <strong>of</strong> the Church Bay<br />
area. b) Inverse distance weighted interpolation <strong>of</strong> Q1 values at 20m cell size. c)<br />
Inverse distance weighted interpolation <strong>of</strong> Q2 values at 20m cell size. d) Inverse<br />
distance weighted interpolation <strong>of</strong> Q3 values at 20m cell size. e) QTC-Clams<br />
categorical interpolation <strong>of</strong> classified vector dataset at 20m cell size. f) Inverse<br />
distance weighted interpolation <strong>of</strong> confidence at 20m cell size. g) Inverse distance<br />
weighted interpolation <strong>of</strong> probability at 20m cell size.<br />
[ 64 ]
INSTAR Project 16702: <strong>Archaeological</strong> applications <strong>of</strong> the Joint Irish Bathymetric Survey [<strong>JIBS</strong>] data<br />
Figure 6.8 a) Location map <strong>of</strong> the HMS Drake, Church Bay, Rathlin Island. b)<br />
Backscatter response in the vicinity <strong>of</strong> the HMS Drake compensated using FM<br />
Geocoder (area displayed 0.8 km 2 ). c) QTC-Multiview classified vector dataset for<br />
the 0.8 km2 study area. d) QTC-Clams categorically interpolated raster dataset <strong>of</strong><br />
the same area. e) Erdas Imagine v.9.2 unsupervised classification <strong>of</strong> the<br />
backscatter mosaic in same area. Colour map is approximate to the QTC scale to<br />
facilitate comparison.<br />
EM710 (Victor Hensen)<br />
The data from the EM710 were classified in three independent stages owing to<br />
the aforementioned pulse length variations. Within the total study area for the<br />
segmentation (sub-areas A1_5; A1_6; A2_5; A2_6 and A3_6), there were a total<br />
<strong>of</strong> 268 lines <strong>of</strong> EM710 data, <strong>of</strong> which all were successfully incorporated into the<br />
classification process. The results are presented below.<br />
[ 65 ]
INSTAR Project 16702: <strong>Archaeological</strong> applications <strong>of</strong> the Joint Irish Bathymetric Survey [<strong>JIBS</strong>] data<br />
Mode 01<br />
The results <strong>of</strong> the classification <strong>of</strong> the EM710 mode 01 data are presented in<br />
Figure 6.9 (a-g). The data coverage using this system was spatially<br />
heterogeneous, and produced varied results. The relative coverage is indicated on<br />
Figure 6.6 (blue transparency). The results were produced using the same<br />
settings as the EM3002 to enhance continuity between classifications. In this<br />
instance, QTC-Multiview identified 14 classes based on a 40,000 record subset <strong>of</strong><br />
289, 459 vectors over 5 iterations. The geographic distribution <strong>of</strong> the 14 classes<br />
is presented in Figure 6.9a (pre-interpolation), along with the principal<br />
components responsible for the classification (Figure 6.9 b, c, and d showing<br />
interpolated plots <strong>of</strong> Q1, Q2 and Q3 respectively). The interpolation process<br />
(Figure 6.9e) has been successful in suppressing the range dependent artefacts<br />
from classes 4 and 10 in the south-eastern portion <strong>of</strong> the classified vector dataset<br />
(Figure 6.9a). It is also clear that the detailed area highlighted in the red box is<br />
relatively complex, containing most <strong>of</strong> the variation in the remainder <strong>of</strong> the<br />
classification summarised in the same small area. This pattern is repeated in the<br />
extreme north west <strong>of</strong> the site which has another instance <strong>of</strong> mode 01 data.<br />
Figures 6.9 (f and g) show the interpolated confidence and probability values<br />
associated with the classification procedure.<br />
Mode 02<br />
The results <strong>of</strong> the mode 02 classification are presented in Figure 6.10 (a-g). This<br />
classification represented the most spatially comprehensive and homogeneous <strong>of</strong><br />
the EM710 results. The coverage is indicated on Figure 6.6 (pink transparency).<br />
The results were also processed using the same rectangular patch dimensions as<br />
the two previous classifications (257x17 pixels). On this occasion, QTC-Multiview<br />
identified 14 as the optimum number <strong>of</strong> classes based on a 40,000 subset <strong>of</strong><br />
439,842 vectors over 5 iterations. The geographic distribution <strong>of</strong> these classes<br />
and their constituent ‘Q’ values are presented in the following Figures (6.10a-g).<br />
Figure 6.10a shows the distribution <strong>of</strong> the classified vector dataset, preinterpolation.<br />
Class 4 (mauve) is the dominant class in this classification, covering<br />
a large geographic area. This is intersected in the area to the west <strong>of</strong> Rathlin<br />
Island and close to the East lighthouse by classes 3 and 6 (pink), and in the<br />
south east and areas <strong>of</strong> Rathlin Sound by class 1 (green). Classes 7, 8, 12 and 14<br />
are also introduced in the area to the north <strong>of</strong> the Island, and parallel to the<br />
entrance to the North Channel. The presence <strong>of</strong> all these classes are significantly<br />
reduced by the process <strong>of</strong> interpolation as class 4 is prevalent throughout all <strong>of</strong><br />
these areas. The most obvious result <strong>of</strong> the interpolation process is the reduction<br />
in extent <strong>of</strong> the areas <strong>of</strong> classes 2, 5, 11, and 13 (blue). Closer inspection <strong>of</strong> the<br />
vector dataset shows that many <strong>of</strong> these classes adhere to particular points in the<br />
range <strong>of</strong> the sonar swath, and while they may be identifying coherent changes in<br />
the along track domain, there is undoubtedly a more complex situation than is<br />
being evidenced by the classification process. Interestingly, the same detail area<br />
as presented in the mode 01 classification (red box) has sufficient coverage post<br />
interpolation to facilitate some comparison between the classifications <strong>of</strong> the two<br />
modes, although this has not been possible at this stage <strong>of</strong> the analysis.<br />
Figures 6.10 (f and g) show the interpolated confidence and probability values<br />
associated with the classification procedure. There is markedly less variation in<br />
the mode 02 confidence and probability values than the previous classifications<br />
(Figures 6.7 and 6.9).<br />
[ 66 ]
INSTAR Project 16702: <strong>Archaeological</strong> applications <strong>of</strong> the Joint Irish Bathymetric Survey [<strong>JIBS</strong>] data<br />
Figure 6.9 a) QTC-Multiview classification results for Victor Hensen mode 01 -<br />
206 s [Classified vector dataset]. Inset detail <strong>of</strong> North Shore, Rathlin Island<br />
(position indicated by red box). b) Inverse distance weighted interpolation <strong>of</strong> Q1<br />
values at 20m cell size. c) Inverse distance weighted interpolation <strong>of</strong> Q2 values at<br />
20m cell size. d) Inverse distance weighted interpolation <strong>of</strong> Q3 values at 20m cell<br />
size. e) QTC-Clams categorical interpolation <strong>of</strong> classified vector dataset at 20m<br />
cell size. f) Inverse distance weighted interpolation <strong>of</strong> confidence at 20m cell size.<br />
g) Inverse distance weighted interpolation <strong>of</strong> probability at 20m cell size.<br />
[ 67 ]
INSTAR Project 16702: <strong>Archaeological</strong> applications <strong>of</strong> the Joint Irish Bathymetric Survey [<strong>JIBS</strong>] data<br />
Figure 6.10 a) QTC-Multiview classification results for Victor Hensen mode 02 -<br />
500 s [Classified vector dataset]. Inset detail <strong>of</strong> North Shore, Rathlin Island<br />
(position indicated by red box). b) Inverse distance weighted interpolation <strong>of</strong> Q1<br />
values at 20m cell size. c) Inverse distance weighted interpolation <strong>of</strong> Q2 values at<br />
20m cell size. d) Inverse distance weighted interpolation <strong>of</strong> Q3 values at 20m cell<br />
size. e) QTC-Clams categorical interpolation <strong>of</strong> classified vector dataset at 20m<br />
cell size. f) Inverse distance weighted interpolation <strong>of</strong> confidence at 20m cell size.<br />
g) Inverse distance weighted interpolation <strong>of</strong> probability at 20m cell size.<br />
[ 68 ]
INSTAR Project 16702: <strong>Archaeological</strong> applications <strong>of</strong> the Joint Irish Bathymetric Survey [<strong>JIBS</strong>] data<br />
Mode 03<br />
The results <strong>of</strong> the mode 03 classification are presented in Figure 6.11 (a-g). The<br />
classification represents the smallest physical area covered by the EM 710, <strong>of</strong>f the<br />
north shore <strong>of</strong> Rathlin Island. The coverage is indicated on Figure 6.6 by the<br />
yellow transparency. These results were obtained by processing in QTC-Multiview<br />
at the same parameters as observed in the previous classifications (257x17). For<br />
this classification, the sampling <strong>of</strong> the image-based data yielded 14,612 vectors<br />
which were subjected to the clustering process. On this basis, the s<strong>of</strong>tware<br />
defined 7 as being the optimum number <strong>of</strong> classes in the mode 03 dataset. The<br />
geographic distribution <strong>of</strong> the classified vector dataset, pre-interpolation is<br />
presented in Figure 6.11a. Similarly to the mode 02 classification results (Figure<br />
6.10), this classification is dominated by a single class (2) There are more subtle<br />
differences evident in the interpolated Q values (Figures 6.11 b,c and d), most<br />
particularly Figure 6.11b, although this variation has not come through in the<br />
final classification. The blue classes (1 and 3) exhibit a strong range dependence<br />
in both the pre- and post-interpolated phases (Figure 6.11a and e). Figures 6.11<br />
(f and g) show the interpolated confidence and probability values associated with<br />
the classification procedure, both <strong>of</strong> which show a similar degree <strong>of</strong> uniformity<br />
across the mode 03 area.<br />
[ 69 ]
INSTAR Project 16702: <strong>Archaeological</strong> applications <strong>of</strong> the Joint Irish Bathymetric Survey [<strong>JIBS</strong>] data<br />
Figure 6.11 a) QTC-Multiview classification results for Victor Hensen mode 03 -<br />
2000 s [Classified vector dataset]. b) Inverse distance weighted interpolation <strong>of</strong><br />
Q1 values at 20m cell size. c) Inverse distance weighted interpolation <strong>of</strong> Q2<br />
values at 20m cell size. d) Inverse distance weighted interpolation <strong>of</strong> Q3 values at<br />
20m cell size. e) QTC-Clams categorical interpolation <strong>of</strong> classified vector dataset<br />
at 20m cell size. f) Inverse distance weighted interpolation <strong>of</strong> confidence at 20m<br />
cell size. g) Inverse distance weighted interpolation <strong>of</strong> probability at 20m cell<br />
size.<br />
[ 70 ]
INSTAR Project 16702: <strong>Archaeological</strong> applications <strong>of</strong> the Joint Irish Bathymetric Survey [<strong>JIBS</strong>] data<br />
Composite Classification<br />
The results <strong>of</strong> the categorically interpolated classifications for the EM 3002D and<br />
EM 710 data are presented summarily in Figure 6.12. The most spatially resolute<br />
data has kept the highest drawing order in the figure presented, as in Figure 6.6.<br />
The differences in colour are indicative <strong>of</strong> similarity only within the individual<br />
classification, not between classifications. It would be necessary to train the<br />
classifications around the boundaries in order to get independent classifications to<br />
adhere to a common colour scheme.<br />
Figure 6.12 Results <strong>of</strong> the QTC-Multiview classification in <strong>JIBS</strong> areas A1_5;<br />
A1_6; A2_5; A2_6 and A3_6. The boundary between adjacent systems is<br />
demarcated by solid black line. Drawing order is the same as Figure 6.6 and the<br />
figure key.<br />
<strong>Archaeological</strong> implications<br />
The results from the automated segmentation <strong>of</strong> the backscatter data form<br />
important inputs into models <strong>of</strong> shipwreck site formation as they allow for<br />
derivation <strong>of</strong> robust substrate maps and quantification <strong>of</strong> sediment budgets and<br />
contemporary sedimentary processes. In addition, for the fist time, this treatment<br />
<strong>of</strong> the backscatter data indicates that automated and semi-automated<br />
segmentation <strong>of</strong> backscatter data can identify shipwreck sites. This result alone is<br />
highly significant and will result in the compilation <strong>of</strong> a paper for submission to<br />
the Journal <strong>of</strong> <strong>Archaeological</strong> Science in 2010.<br />
6.3.2 Re-assessment <strong>of</strong> anomalies identified in Phase 1<br />
The higher resolution DEM (1m versus 4m and 6m used during Phase 1) and<br />
availability <strong>of</strong> backscatter data have allowed a re-assessment <strong>of</strong> the anomalies<br />
[ 71 ]
INSTAR Project 16702: <strong>Archaeological</strong> applications <strong>of</strong> the Joint Irish Bathymetric Survey [<strong>JIBS</strong>] data<br />
detected during Phase 1 <strong>of</strong> the project. Figure 6.13 shows the significant<br />
improvement in the amount <strong>of</strong> detail and clarity <strong>of</strong> the bathymetric image in<br />
comparison to the data used during Phase 1 <strong>of</strong> this project (6m and 4m grid). An<br />
example <strong>of</strong> the added value that backscatter can deliver for the detection <strong>of</strong><br />
shipwrecks is shown in Figure 6.14.<br />
Figure 6.13 Comparison between bathymetric data acquired over the S.S.<br />
Lochgarry site, gridded to 6m, 4m and 1m.<br />
[ 72 ]
INSTAR Project 16702: <strong>Archaeological</strong> applications <strong>of</strong> the Joint Irish Bathymetric Survey [<strong>JIBS</strong>] data<br />
Figure 6.14 <strong>JIBS</strong> (A) high resolution (1m) multibeam and (B) backscatter data<br />
acquired over the dispersed remains <strong>of</strong> the armoured cruiser HMS Drake<br />
(torpedoed in 1917) and steam trawler Ella Hewett (collided with remains <strong>of</strong> HMS<br />
Drake in 1962). Note the importance <strong>of</strong> the backscatter data in providing a<br />
clearer image <strong>of</strong> the wreck remains and the bedforms (eg. to the SW) in addition<br />
to giving information on sediment types (dark areas = gravel; light areas = sand)<br />
- such data are important for the study <strong>of</strong> site formation processes.<br />
Case study: Rathlin Island<br />
Due to the revised and shortened timescale <strong>of</strong> this project and the time taken to<br />
process the vast quantity <strong>of</strong> data, a complete reassessment <strong>of</strong> all shipwreck<br />
anomalies was not feasible. It was therefore decided, in the first instance, to<br />
focus on a single case study. The study area chosen was the Rathlin Island<br />
Special Area <strong>of</strong> Conservation (SAC). This SAC, designated on the basis <strong>of</strong> rare<br />
marine habitats, entirely encompasses Rathlin Island and its adjacent waters.<br />
From an archaeological perspective, Rathlin Island has been a shipping hazard for<br />
centuries, with 81 documented wrecking incidences falling within the SAC<br />
boundaries (Figure 6.15).<br />
[ 73 ]
INSTAR Project 16702: <strong>Archaeological</strong> applications <strong>of</strong> the Joint Irish Bathymetric Survey [<strong>JIBS</strong>] data<br />
Figure 6.15 Overview map showing Rathlin Island, the SAC boundaries (black<br />
box) and all documented shipwrecks within the SAC from the Northern Ireland<br />
MSMR (red circles).<br />
In Phase 1 <strong>of</strong> the shipwreck analysis, 44 anomalies were detected that fell within<br />
the SAC boundaries (Figure 6.16 and Table 6.2). Of these, 3 were designated as<br />
class 1 (most probably a shipwreck), 16 were designated as class 2 (most<br />
probably a geological feature or shipwreck) and 25 were designated as class 3<br />
(most probably a processing error or a shipwreck).<br />
[ 74 ]
INSTAR Project 16702: <strong>Archaeological</strong> applications <strong>of</strong> the Joint Irish Bathymetric Survey [<strong>JIBS</strong>] data<br />
Figure 6.16 Distribution and classification <strong>of</strong> Phase 1 anomalies falling within the<br />
Rathlin Island SAC.<br />
As part <strong>of</strong> the Phase 2 analysis, each <strong>of</strong> these anomalies was visually reassessed<br />
using the <strong>JIBS</strong> 1m DEM and the associated backscatter data. If necessary, the<br />
anomalies were reclassified. Further, new anomalies not visible on the Phase 1<br />
datasets were also added to the database. In addition to the classes described<br />
above, the following new classes were used:<br />
• Class 4 – anomaly detected in Phase 1. No longer visible on 1m<br />
data, definite processing error.<br />
• Class 5 - anomaly detected in Phase 1. Visible on 1m data, but now<br />
confirmed geological feature.<br />
The results <strong>of</strong> the reclassification are summarized in Table 6.2 and Figure 6.17.<br />
The most noticeable outcome <strong>of</strong> the re-analysis was the reclassification <strong>of</strong> all but<br />
three Class 3 anomalies into Class 4. Effectively, these were possible processing<br />
errors/wrecks that were confirmed to be processing errors. The three exceptions<br />
were found to be geological features, with two confirmed (i.e. Class 5) and one<br />
possible geological/wreck (i.e. Class 2). The three most probable wreck anomalies<br />
were confirmed as wrecks, hence the lack <strong>of</strong> change in class 1. Of the Class 2<br />
anomalies, 12 were reinterpreted as confirmed geological features. This was<br />
particularly clear for the north side <strong>of</strong> Rathlin Island where a number <strong>of</strong> anomalies<br />
were confirmed to be slump deposits. Finally, 13 new anomalies were detected.<br />
These were all small (
INSTAR Project 16702: <strong>Archaeological</strong> applications <strong>of</strong> the Joint Irish Bathymetric Survey [<strong>JIBS</strong>] data<br />
Table 6.2Anomaly classes within the Rathlin SAC as identified during Phase 1<br />
and Phase 2 <strong>of</strong> the project<br />
Phase 1 analysis (n)<br />
Phase 2 re-analysis<br />
Class 1 3 3<br />
Class 2 16 17<br />
Class 3 25 0<br />
Class 4 - 24<br />
Class 5 - 14<br />
Total 44 58<br />
Figure 6.17 Distribution and classification <strong>of</strong> anomalies falling within the Rathlin<br />
Island SAC following the Phase 2 reclassification<br />
Revised contact sheets<br />
In addition to re-assessing the anomalies within the Rathlin Island SAC<br />
boundaries, a revised contact sheet for each known and definite shipwreck was<br />
created. This led to the removal <strong>of</strong> four such sheets created during Phase 1,<br />
which had initially been interpreted as shipwreck but were now found to be<br />
processing errors. Three new wrecks were added to the contact sheets; two<br />
(Towey and Templemore) represented by very low (
INSTAR Project 16702: <strong>Archaeological</strong> applications <strong>of</strong> the Joint Irish Bathymetric Survey [<strong>JIBS</strong>] data<br />
Vessel Name<br />
Geophysical data<br />
Position<br />
Geographical location<br />
Water Depth (m)<br />
Andania?<br />
<strong>JIBS</strong> multibeam 1m resolution<br />
Latitude-Longitude 1 6° 12’ 47’’W 55° 19’ 33’’N<br />
UTM (zone 29)<br />
676817E 6134602N<br />
2km north <strong>of</strong> Rathlin Island<br />
195m<br />
Anomaly description<br />
Seabed description<br />
Inferred Energy<br />
Conditions<br />
Interpretation<br />
Notes<br />
Appearance<br />
Dimensions<br />
Max. height above<br />
seabed<br />
3m high sand waves<br />
E-W linear mound<br />
123x21m<br />
14m<br />
Moderate to high energy, formation <strong>of</strong> bedforms<br />
possible despite great depth<br />
Largely intact shipwreck<br />
The anomaly is listed in the UKHO database as the Andania, an armed liner<br />
torpedoed in 1918. The MSMR record for the Andania is 16km E <strong>of</strong> this anomaly<br />
while a dive record is 12.5km to the NW and lists her as lying in 123m water.<br />
Anomaly dimensions do fit historical dimensions (158x19m). Wreck is upright and<br />
lies in a field <strong>of</strong> bedforms (sandwaves?). Bathymetry and backscatter suggest the<br />
bedforms are lapping onto the wreck and there may be scour on its southerm side.<br />
It is worth noting that another vessel <strong>of</strong> similar size, the Calgarian, is also listed as<br />
being torpedoed 2miles N <strong>of</strong> Rathlin in 1918. Given the discrepancies with the dive<br />
record, it is possible that this wreck could be the anomaly or the dive record is<br />
actually that <strong>of</strong> the Calgarian.<br />
Associated Imagery<br />
Top: <strong>JIBS</strong> 1m multibeam bathymetry showing the Andania. View from directly<br />
overhead<br />
Middle: <strong>JIBS</strong> backscatter image <strong>of</strong> the Andania and surrounding seabed. View from<br />
directly overhead<br />
Bottom: <strong>JIBS</strong> backscatter draped over 1m multibeam bathymetry. Perspective (3D)<br />
view looking northwest<br />
1<br />
Latitude Longitude in WGS-84<br />
[ 77 ]
INSTAR Project 16702: <strong>Archaeological</strong> applications <strong>of</strong> the Joint Irish Bathymetric Survey [<strong>JIBS</strong>] data<br />
[ 78 ]
INSTAR Project 16702: <strong>Archaeological</strong> applications <strong>of</strong> the Joint Irish Bathymetric Survey [<strong>JIBS</strong>] data<br />
Vessel Name<br />
Geophysical data<br />
S.S. Castle Eden<br />
<strong>JIBS</strong> multibeam 1m resolution<br />
Position<br />
Latitude-Longitude 2 7° 3’ 17’’W 55° 19’ 17’’N<br />
UTM (zone 29)<br />
623429E 6132276N<br />
Geographical location 5.2km NNW <strong>of</strong> Ballymagaraghy Point, Co. Donegal<br />
Water Depth (m) 30-31m<br />
Anomaly description<br />
Appearance<br />
E-W collection <strong>of</strong> upstanding<br />
anomalies<br />
Dimensions<br />
85x16m<br />
Max. height above 2.5m<br />
seabed<br />
Seabed description Hummocky terrain: look like glacial features but could<br />
be sand/gravel waves<br />
Inferred Energy<br />
? medium energy ?<br />
Conditions<br />
Interpretation<br />
Partially buried (?) remains <strong>of</strong> a shipwreck<br />
Notes<br />
MSMR 420m to NW <strong>of</strong> anomaly: S.S. Castle Eden (square). Dive record 470m to NW<br />
<strong>of</strong> anomaly: S.S. Castle Eden (diamond). Dimensions similar to historical information<br />
(86.25x12.21x5.61m). Steel steam collier, torpedoed in 1918. Dive record notes<br />
seabed as coarse gravel. Backscatter shows relatively little difference between the<br />
wreck and the surrounding seabed, possibly indicating a hard substrate.<br />
Associated Imagery<br />
Top: <strong>JIBS</strong> 1m multibeam bathymetry showing the Castle Eden. View from directly<br />
overhead<br />
Middle: <strong>JIBS</strong> backscatter image <strong>of</strong> the Castle Eden and surrounding seabed. View<br />
from directly overhead<br />
Bottom: <strong>JIBS</strong> backscatter draped over 1m multibeam bathymetry. Perspective (3D)<br />
view looking NE. Image has been 2 times vertically exaggerated<br />
2<br />
Latitude Longitude in WGS-84<br />
[ 79 ]
INSTAR Project 16702: <strong>Archaeological</strong> applications <strong>of</strong> the Joint Irish Bathymetric Survey [<strong>JIBS</strong>] data<br />
[ 80 ]
INSTAR Project 16702: <strong>Archaeological</strong> applications <strong>of</strong> the Joint Irish Bathymetric Survey [<strong>JIBS</strong>] data<br />
Vessel Name<br />
Geophysical data<br />
H.M.T. Corienties<br />
<strong>JIBS</strong> multibeam 1m resolution<br />
Position<br />
Latitude-Longitude 3 7° 10’ 13’’W 55° 22’ 1’’N<br />
UTM (zone 29)<br />
615968E 6137154N<br />
Geographical location 3.3km N <strong>of</strong> Glengad Head, Co. Donegal<br />
Water Depth (m) 30-31m<br />
Anomaly description<br />
Appearance<br />
Dimensions<br />
2 sections (one highly<br />
protruding, one elongate)<br />
with developed scour pit<br />
High anomaly: 15x6m;<br />
elongated anomaly: 20x6m<br />
Max. height above 1.5m<br />
seabed<br />
Seabed description Sand/gravel waves or glacial features<br />
Inferred Energy<br />
? medium energy?<br />
Conditions<br />
Interpretation<br />
Remains <strong>of</strong> a shipwreck with scour, broken up in at<br />
least 2 sections<br />
Notes<br />
Dive record 800m to NW <strong>of</strong> anomaly: H.M.T Corienties. MSMR 1900m to ENE <strong>of</strong><br />
anomaly: H.M.T Corienties. Dimensions close to historical information (40.1x6.9m).<br />
Steel admiralty trawler, mined in 1917. Dive record notes seabed as coarse shell<br />
gravel, backscatter suggests hard undifferentiated substrate with scour pits<br />
surrounding the wreck.<br />
Associated Imagery<br />
Top: <strong>JIBS</strong> 1m multibeam bathymetry showing the Corientes. View from directly<br />
overhead<br />
Middle: <strong>JIBS</strong> backscatter image <strong>of</strong> the Corientes and surrounding seabed. View from<br />
directly overhead<br />
Bottom: <strong>JIBS</strong> backscatter draped over 1m multibeam bathymetry. Perspective (3D)<br />
view looking SE.<br />
3<br />
Latitude Longitude in WGS-84<br />
[ 81 ]
INSTAR Project 16702: <strong>Archaeological</strong> applications <strong>of</strong> the Joint Irish Bathymetric Survey [<strong>JIBS</strong>] data<br />
[ 82 ]
INSTAR Project 16702: <strong>Archaeological</strong> applications <strong>of</strong> the Joint Irish Bathymetric Survey [<strong>JIBS</strong>] data<br />
Vessel Name<br />
Geophysical data<br />
Position<br />
Geographical location<br />
Water Depth (m)<br />
H.M.S. Drake<br />
<strong>JIBS</strong> multibeam 1m resolution<br />
Latitude-Longitude 4 6° 12’ 31’’W 55° 17’ 7’’N<br />
UTM (zone 29)<br />
677272E 6130079N<br />
West <strong>of</strong>f Rathlin; Church Bay<br />
15m<br />
Anomaly description<br />
Appearance<br />
NW-SW elongated anomaly<br />
with scour pit<br />
Dimensions<br />
150x27m<br />
Max. height above 4m<br />
seabed<br />
Seabed description Fairly featureless<br />
Inferred Energy<br />
No clear bedforms around wreck, small ripples to<br />
Conditions<br />
southwest. Low energy?<br />
Interpretation<br />
Remains <strong>of</strong> a shipwreck, not intact<br />
Notes<br />
There is a MSMR record 520m to N <strong>of</strong> anomaly: H.M.S. Drake (square). There is a<br />
dive record 210m to NW <strong>of</strong> anomaly: H.M.S. Drake (diamond). Position <strong>of</strong> H.M.S.<br />
Drake noted on Admiralty Chart and UKHO database in location <strong>of</strong> anomaly.<br />
Dimension fit historical information (152x22x8m). Armour plating. Torpedoed in<br />
1917. Dive record noted seabed to be sand over clay. Backscatter data indicates<br />
sand around wreck is featureless. Wreck is very low-lying and broken up, result <strong>of</strong><br />
demolition work following sinking. Protrusion from NW section <strong>of</strong> anomaly is the<br />
wreck <strong>of</strong> Ella Hewitt, a trawler which collided with the wreck and sank in 1962.<br />
Associated Imagery<br />
Top: <strong>JIBS</strong> 1m multibeam bathymetry showing the Drake. View from directly<br />
overhead<br />
Middle: <strong>JIBS</strong> backscatter image <strong>of</strong> the Drake and surrounding seabed. View from<br />
directly overhead<br />
Bottom: <strong>JIBS</strong> backscatter draped over 1m multibeam bathymetry. Perspective (3D)<br />
view looking SSE. Image has been 2 times vertically exaggerated<br />
4<br />
Latitude Longitude in WGS-84<br />
[ 83 ]
INSTAR Project 16702: <strong>Archaeological</strong> applications <strong>of</strong> the Joint Irish Bathymetric Survey [<strong>JIBS</strong>] data<br />
[ 84 ]
INSTAR Project 16702: <strong>Archaeological</strong> applications <strong>of</strong> the Joint Irish Bathymetric Survey [<strong>JIBS</strong>] data<br />
Vessel Name<br />
Geophysical data<br />
H.M.S. Laurentic<br />
<strong>JIBS</strong> multibeam 1m resolution<br />
Position<br />
Latitude-Longitude 5 7° 35’ 31’’W 55° 18’ 16’’N<br />
UTM (zone 29)<br />
589379E 6129571N<br />
Geographical location Mouth Lough Swilly, 3.7km NE <strong>of</strong> Fanad Head, Co.<br />
Donegal<br />
Water Depth (m) 36-37m<br />
Anomaly description Appearance<br />
Similar to bedrock outcrop<br />
but more distinct upstanding<br />
features<br />
Dimensions<br />
125x36m<br />
Max. height above 5m<br />
seabed<br />
Seabed description Some bedrock outcrop to W; sand/gravel waves or<br />
glacial features<br />
Inferred Energy<br />
? medium energy ?<br />
Conditions<br />
Interpretation<br />
Partially broken remains <strong>of</strong> a shipwreck<br />
Notes<br />
MSMR close to anomaly: S.S. Laurentic (square). Wreck indicated on Admiralty<br />
Chart and dive records in position <strong>of</strong> the anomaly. Dimensions similar to historical<br />
information (167.6x20.4x12.5m). Part <strong>of</strong> vessel appears to be broken <strong>of</strong>f. Steel liner,<br />
mined in 1917. Dive record notes seabed as stones and shale. Backscatter suggest<br />
chaotic bedforms at the southern end <strong>of</strong> the anomaly and a scour pit running along<br />
the eastern side <strong>of</strong> the wreck.<br />
Associated Imagery<br />
Top: <strong>JIBS</strong> 1m multibeam bathymetry showing the Laurentic. View from directly<br />
overhead<br />
Middle: <strong>JIBS</strong> backscatter image <strong>of</strong> the Laurentic and surrounding seabed. View from<br />
directly overhead<br />
Bottom: <strong>JIBS</strong> backscatter draped over 1m multibeam bathymetry. Perspective (3D)<br />
view looking SW<br />
5<br />
Latitude Longitude in WGS-84<br />
[ 85 ]
INSTAR Project 16702: <strong>Archaeological</strong> applications <strong>of</strong> the Joint Irish Bathymetric Survey [<strong>JIBS</strong>] data<br />
[ 86 ]
INSTAR Project 16702: <strong>Archaeological</strong> applications <strong>of</strong> the Joint Irish Bathymetric Survey [<strong>JIBS</strong>] data<br />
Vessel Name<br />
Geophysical data<br />
S.S. Lochgarry<br />
<strong>JIBS</strong> multibeam 1m resolution<br />
Position<br />
Latitude-Longitude 6 6° 10’ 27’’W 55° 15’ 57’’N<br />
UTM (zone 29)<br />
679549E 6128026N<br />
Geographical location East <strong>of</strong>f Rathlin; 1.4km NE <strong>of</strong> Rue Point<br />
Water Depth (m) 31-32m<br />
Anomaly description Appearance<br />
NW-SE elongated mound<br />
Dimensions<br />
84x14m<br />
Max. height above 6m<br />
seabed<br />
Seabed description Bedrock coastline<br />
Inferred Energy<br />
Conditions<br />
No clear bedforms, prob. very strong currents resulting<br />
in high erosion<br />
Interpretation<br />
Largely intact shipwreck<br />
Notes<br />
Dive record 50m to the NE (diamond): S.S. Lochgarry, steel, struck rocks, lost in<br />
1942. MSMR record for Lochgarry is located 1km to the SE <strong>of</strong> the anomaly. Location<br />
<strong>of</strong> wreck indicated on the Admiralty Chart and UKHO database. Dimensions agree<br />
with historical information (80.8x10.2x4.7m). Seabed noted as stones and shale in<br />
dive record, based on current strength, this is probably a thin lag over bedrock.<br />
Associated Imagery<br />
Top: <strong>JIBS</strong> 1m multibeam bathymetry showing the Lochgarry. View from directly<br />
overhead<br />
Middle: <strong>JIBS</strong> backscatter image <strong>of</strong> the Lochgarry and surrounding seabed. View from<br />
directly overhead<br />
Bottom: <strong>JIBS</strong> backscatter draped over 1m multibeam bathymetry. Perspective (3D)<br />
view looking north<br />
6<br />
Latitude Longitude in WGS-84<br />
[ 87 ]
INSTAR Project 16702: <strong>Archaeological</strong> applications <strong>of</strong> the Joint Irish Bathymetric Survey [<strong>JIBS</strong>] data<br />
[ 88 ]
INSTAR Project 16702: <strong>Archaeological</strong> applications <strong>of</strong> the Joint Irish Bathymetric Survey [<strong>JIBS</strong>] data<br />
Vessel Name<br />
Geophysical data<br />
S.S. Lugano<br />
<strong>JIBS</strong> multibeam 1m resolution<br />
Position<br />
Latitude-Longitude 7 6° 17’ 36’’W 55° 16’ 49’’N<br />
UTM (zone 29)<br />
671912E 6129316N<br />
Geographical location 1.5km SSW <strong>of</strong>f Bull Point, Rathlin Island<br />
Water Depth (m) 84-86m<br />
Anomaly description<br />
Appearance<br />
E-W mound, collection <strong>of</strong><br />
irregular anomalies<br />
Dimensions<br />
107x18m<br />
Max. height above 8m<br />
seabed<br />
Seabed description Fairly featureless<br />
Inferred Energy<br />
No clear bedforms: very low (bedforms do not form) or<br />
Conditions<br />
very high currents (everything eroded) ?<br />
Interpretation<br />
Intact shipwreck<br />
Notes<br />
There is a dive record 140 to ESE <strong>of</strong> anomaly: S.S. Lugano (diamond).There is an<br />
MSMR record 1600m to SW <strong>of</strong> anomaly: S.S. Lugano (square). Wreck indicated on<br />
Admiralty Chart and UKHO database. Dimensions close to historical information<br />
(107x16x7m). S.S. Lugano was steel cargo steamer, torpedoed in 1917. Dive record<br />
describes seabed as rocky, backscatter indicates uniform seabed substrate and<br />
possible associated wreckage located c. 25m <strong>of</strong>f the south side <strong>of</strong> the wreck<br />
Associated Imagery<br />
Top: <strong>JIBS</strong> 1m multibeam bathymetry showing the Lugano. View from directly<br />
overhead<br />
Middle: <strong>JIBS</strong> backscatter image <strong>of</strong> the Lugano and surrounding seabed. View from<br />
directly overhead<br />
Bottom: <strong>JIBS</strong> backscatter draped over 1m multibeam bathymetry. Perspective (3D)<br />
view looking SE.<br />
7<br />
Latitude Longitude in WGS-84<br />
[ 89 ]
INSTAR Project 16702: <strong>Archaeological</strong> applications <strong>of</strong> the Joint Irish Bathymetric Survey [<strong>JIBS</strong>] data<br />
[ 90 ]
INSTAR Project 16702: <strong>Archaeological</strong> applications <strong>of</strong> the Joint Irish Bathymetric Survey [<strong>JIBS</strong>] data<br />
Vessel Name<br />
Geophysical data<br />
S.S. Santa Maria<br />
<strong>JIBS</strong> multibeam 1m resolution<br />
Position<br />
Latitude-Longitude 8<br />
UTM (zone 29)<br />
Geographical location 1.4km NW <strong>of</strong>f Fair Head<br />
Water Depth (m) 60-65m<br />
6° 9’ 47’’W 55° 14’ 11’’N<br />
680389E 6124766N<br />
Anomaly description Appearance<br />
High E-W mound<br />
Dimensions<br />
90x14m<br />
Max. height above 10m<br />
seabed<br />
Seabed description Hummocky terrain: look like glacial features but could<br />
be sand/gravel waves, some sand ripples<br />
Inferred Energy<br />
Medium energy (eddies noted on Admiralty Chart)<br />
Conditions<br />
Interpretation<br />
Largely intact shipwreck, possibly some broken<br />
fragments to the E<br />
Notes<br />
MSMR 1040m to E (square): S.S. Santa Maria, steel, lost in 1918. Dive record 530m<br />
to the NNW (diamond): S.S. Santa Maria, steel, lost in 1918. A wreck is noted on the<br />
Admiralty Chart and UKHO database in this location. Dive records indicate that S.S.<br />
Santa Maria is broken into two sections, with one section on a ledge at 30m water<br />
depth and another at the bottom <strong>of</strong> a cliff at 60m water depth. The multibeam does<br />
not show such a steep drop-<strong>of</strong>f. However, the dimensions <strong>of</strong> the anomaly fit those <strong>of</strong><br />
the dive record. Therefore, this wreck has been interpreted as S.S. Santa Maria.<br />
Steel steam tanker, torpedoed in 1918. Dive record notes seabed as rocky,<br />
backscatter suggests hard substrate, with possible scour or additional wreckage at<br />
the eastern end <strong>of</strong> the anomaly.<br />
Associated Imagery<br />
Top: <strong>JIBS</strong> 1m multibeam bathymetry showing the Santa Maria. View from directly<br />
overhead<br />
Middle: <strong>JIBS</strong> backscatter image <strong>of</strong> the Santa Maria and surrounding seabed. View<br />
from directly overhead<br />
Bottom: <strong>JIBS</strong> backscatter draped over 1m multibeam bathymetry. Perspective (3D)<br />
view looking NE. Note that lighter areas in this image show where there is no<br />
backscatter coverage<br />
8<br />
Latitude Longitude in WGS-84<br />
[ 91 ]
INSTAR Project 16702: <strong>Archaeological</strong> applications <strong>of</strong> the Joint Irish Bathymetric Survey [<strong>JIBS</strong>] data<br />
[ 92 ]
INSTAR Project 16702: <strong>Archaeological</strong> applications <strong>of</strong> the Joint Irish Bathymetric Survey [<strong>JIBS</strong>] data<br />
Vessel Name<br />
Geophysical data<br />
Templemore<br />
<strong>JIBS</strong> multibeam 1m resolution<br />
Position<br />
Latitude-Longitude 9 6° 13’ 54’’W 55° 12’ 40’’N<br />
UTM (zone 29)<br />
676120E 6121798N<br />
Geographical location 500m NW from Ballycastle<br />
Water Depth (m) 17-18m<br />
Anomaly description<br />
Appearance<br />
Irregular linear anomaly,<br />
with peaks at its northern<br />
and southern end<br />
Dimensions<br />
40x11m<br />
Max. height above 3m<br />
seabed<br />
Seabed description Fairly featureless seabed<br />
Inferred Energy<br />
Probable high energy<br />
Conditions<br />
Interpretation<br />
Shipwreck, broken up<br />
Notes<br />
MSMR 440m to the SW, diver record (diamond) is 50m to the NW. Adjacent MSMR<br />
(square) is from another vessel. Wreck is listed in the UKHO database as<br />
Templemore, an iron coaster lost in 1911. Anomaly dimensions are close to historical<br />
dimensions (48x8m). Wreck lies low to the seabed, and is heavily broken up and<br />
hence shows as a small anomaly on the backscatter. Diver records report seabed as<br />
rock and sand, backscatter indicates a featureless seabed. Both records combined<br />
indicate high energy conditions.<br />
Associated Imagery<br />
Top: <strong>JIBS</strong> 1m multibeam bathymetry showing the Templemore. View from directly<br />
overhead<br />
Middle: <strong>JIBS</strong> backscatter image <strong>of</strong> the Templemore and surrounding seabed. View<br />
from directly overhead<br />
Bottom: <strong>JIBS</strong> backscatter draped over 1m multibeam bathymetry. Perspective (3D)<br />
view looking SE. Image has been 2 times vertically exaggerated<br />
9<br />
Latitude Longitude in WGS-84<br />
[ 93 ]
INSTAR Project 16702: <strong>Archaeological</strong> applications <strong>of</strong> the Joint Irish Bathymetric Survey [<strong>JIBS</strong>] data<br />
[ 94 ]
INSTAR Project 16702: <strong>Archaeological</strong> applications <strong>of</strong> the Joint Irish Bathymetric Survey [<strong>JIBS</strong>] data<br />
Vessel Name<br />
Geophysical data<br />
Towey<br />
<strong>JIBS</strong> multibeam 1m resolution<br />
Position<br />
Latitude-Longitude 10 6° 41’ 3’’W 55° 12’ 4’’N<br />
UTM (zone 29)<br />
647371E 6119638N<br />
Geographical location 1.7km ESE <strong>of</strong> Portrush Harbour<br />
Water Depth (m) 13-14m<br />
Anomaly description<br />
Appearance<br />
Two isolated anomalies<br />
aligned W-E<br />
Dimensions<br />
45x11m<br />
Max. height above 1m<br />
seabed<br />
Seabed description Fairly featureless seabed, rocky outcrops to S<br />
Inferred Energy<br />
Probable high energy<br />
Conditions<br />
Interpretation<br />
Shipwreck, broken up<br />
Notes<br />
MSMR record is 460m East, diver record is 880m to the NW. Wreck is listed in the<br />
UKHO database as Towey, a steel coaster lost in 1930. Anomaly dimensions are<br />
close to historical dimensions (34x7m) and include scour feature surrounding the<br />
two parts <strong>of</strong> the wreck. Wreck lies low to the seabed, and is heavily broken up and<br />
hence shows as a small anomaly on the backscatter. Diver records report seabed as<br />
sand and shingle, backscatter indicates a featureless seabed (with exception <strong>of</strong> rocky<br />
outcrops to S). Both records combined indicate high energy conditions.<br />
Associated Imagery<br />
Top: <strong>JIBS</strong> 1m multibeam bathymetry showing the Towey. View from directly<br />
overhead<br />
Middle: <strong>JIBS</strong> backscatter image <strong>of</strong> the Towey and surrounding seabed. View from<br />
directly overhead<br />
Bottom: <strong>JIBS</strong> backscatter draped over 1m multibeam bathymetry. Perspective (3D)<br />
view looking SE. Image has been 2 times vertically exaggerated<br />
10<br />
Latitude Longitude in WGS-84<br />
[ 95 ]
INSTAR Project 16702: <strong>Archaeological</strong> applications <strong>of</strong> the Joint Irish Bathymetric Survey [<strong>JIBS</strong>] data<br />
[ 96 ]
INSTAR Project 16702: <strong>Archaeological</strong> applications <strong>of</strong> the Joint Irish Bathymetric Survey [<strong>JIBS</strong>] data<br />
Vessel Name<br />
Geophysical data<br />
U-1003?<br />
<strong>JIBS</strong> multibeam 1m resolution<br />
Position<br />
Latitude-Longitude 11 6° 44’ 33’’W 55° 17’ 54’’N<br />
UTM (zone 29)<br />
643328E 6130321N<br />
Geographical location 14km N <strong>of</strong> Portstewart strand<br />
Water Depth (m) 65-66m<br />
Anomaly description Appearance<br />
Long E-W anomaly<br />
Dimensions<br />
65x9m<br />
Max. height above 4m<br />
seabed<br />
Seabed description Fairly featureless, some sand waves to the South<br />
Inferred Energy<br />
Low – medium energy<br />
Conditions<br />
Interpretation<br />
Shipwreck, largely intact<br />
Notes<br />
Dive record (diamond) almost exactly on location <strong>of</strong> the anomaly. Position <strong>of</strong> a wreck<br />
is indicated on the Admiralty chart to the NW <strong>of</strong> the anomaly. Wreck has been<br />
identified by divers as a steel U-Boat (U-1003), wrecked after collision in 1945. Dive<br />
record notes the seabed as sand and rocks. There may be some uncertainty with<br />
respect to which U-boat it is. The UKHO database lists U-1003 as being lost 16km<br />
NW. Backscatter shows a relatively featureless seabed, with a possible scour tail<br />
extending from the W end <strong>of</strong> the wreck.<br />
Associated Imagery<br />
Top: <strong>JIBS</strong> 1m multibeam bathymetry showing the U-1003. View from directly<br />
overhead<br />
Middle: <strong>JIBS</strong> backscatter image <strong>of</strong> the U-1003 and surrounding seabed. View from<br />
directly overhead<br />
Bottom: <strong>JIBS</strong> backscatter draped over 1m multibeam bathymetry. Perspective (3D)<br />
view looking NE. Lighter north <strong>of</strong> the anomaly and black area show where there is no<br />
backscatter coverage<br />
11<br />
Latitude Longitude in WGS-84<br />
[ 97 ]
INSTAR Project 16702: <strong>Archaeological</strong> applications <strong>of</strong> the Joint Irish Bathymetric Survey [<strong>JIBS</strong>] data<br />
[ 98 ]
INSTAR Project 16702: <strong>Archaeological</strong> applications <strong>of</strong> the Joint Irish Bathymetric Survey [<strong>JIBS</strong>] data<br />
Vessel Name<br />
Geophysical data<br />
Position<br />
Geographical location<br />
Water Depth (m)<br />
S.F.V. William Mannel<br />
<strong>JIBS</strong> multibeam 1m resolution<br />
Latitude-Longitude 12 7° 4’ 31’’W 55° 18’ 28’’N<br />
UTM (zone 29)<br />
622165E 6130734N<br />
2.6km NNE <strong>of</strong> Rubonid Point, Co. Donegal<br />
26.5-27.5m<br />
Anomaly description<br />
Appearance<br />
Irregular long upstanding<br />
anomaly, NE-SW, large<br />
scour pit to SW, debris to NE<br />
Dimensions<br />
53x11m<br />
Max. height above 0.5m<br />
seabed<br />
Seabed description Hummocky terrain: sand waves or glacial features. Poss<br />
small sand waves/ripples around the wreck<br />
Inferred Energy<br />
Medium energy<br />
Conditions<br />
Interpretation<br />
Remains <strong>of</strong> a shipwreck with scour pits surrounding the<br />
wreck<br />
Notes<br />
Dive record 33m to SE <strong>of</strong> anomaly: S.F.V. William Mannel. MSMR and indication on<br />
Admiralty Chart 355m to NW <strong>of</strong> anomaly: S.F.V. William Mannel (square). Iron<br />
fishing trawler, sank in 1946 while under tow after she struck rocks near Glengad<br />
Head. Anomaly slightly bigger than historic dimensions (38.3x7.1x3.9m), but<br />
measured dimensions include scour features.<br />
Associated Imagery<br />
Top: <strong>JIBS</strong> 1m multibeam bathymetry showing the William Mannel. View from directly<br />
overhead<br />
Middle: <strong>JIBS</strong> backscatter image <strong>of</strong> the William Mannel and surrounding seabed. View<br />
from directly overhead<br />
Bottom: <strong>JIBS</strong> backscatter draped over 1m multibeam bathymetry. Perspective (3D)<br />
view looking WSW. Image has been two times vertically exaggerated<br />
12<br />
Latitude Longitude in WGS-84<br />
[ 99 ]
INSTAR Project 16702: <strong>Archaeological</strong> applications <strong>of</strong> the Joint Irish Bathymetric Survey [<strong>JIBS</strong>] data<br />
[ 100 ]
INSTAR Project 16702: <strong>Archaeological</strong> applications <strong>of</strong> the Joint Irish Bathymetric Survey [<strong>JIBS</strong>] data<br />
<strong>Archaeological</strong> implications<br />
1) The fact that the data has gone through more rigorous cleaning means<br />
that all anomalies that were previously classified as ‘processing errors or<br />
possible wreck (class 3)’ have now been eliminated around Rathlin Island.<br />
This implies that the same will be true for the wider dataset, though this<br />
will have to be confirmed with future re-analysis.<br />
2) Owing to the higher resolution <strong>of</strong> the DEM, it is easier to confirm the<br />
nature <strong>of</strong> features on the seabed as being geological. It is anticipated that,<br />
when analyzing the full dataset, a large number <strong>of</strong> class 2 (possible<br />
geological feature or possible shipwreck) will be found to be geological.<br />
3) However, the higher resolution <strong>of</strong> the data also means that more smaller<br />
anomalies are now being detected. This will necessitate an examination <strong>of</strong><br />
the full 1m data rather than simply re-assessing the previously picked<br />
anomalies.<br />
4) Addition <strong>of</strong> the backscatter has proven to be a great aid in determining the<br />
nature <strong>of</strong> the anomalies. Further studies on backscatter should<br />
demonstrate the possibility to use such data for the characterization <strong>of</strong> the<br />
archaeological material.<br />
5) Overall, we are confident that we should be able to reduce the amount <strong>of</strong><br />
potential archaeological anomalies to a realistic number for<br />
groundtruthing.<br />
6.4 Dissemination <strong>of</strong> results<br />
6.4.1 Web-based dissemination<br />
Web-based dissemination occurs through the dedicated project web-site (Figure<br />
6.18): http://www.science.ulster.ac.uk/cma/instar/<br />
6.4.2 Research output<br />
Two manuscripts resulting from Phase 1 and early Phase 2 <strong>of</strong> the project have been<br />
submitted for review to the International Journal <strong>of</strong> Nautical Archaeology .We will<br />
continue to publish the results from the project in international peer-reviewed<br />
journals and make these outputs available in PDF format on the CMA web-site.<br />
Additionally, a news article detailing preliminary results <strong>of</strong> the <strong>JIBS</strong>-INSTAR work<br />
was published in the Northern Ireland Environment Agency’s ‘Coast’ magazine:<br />
Plets R & Westley K. 2009. The seabed revealed. Northern Ireland Environment<br />
Agency Coast Magazine 5:10-13. [Appendix B]<br />
[ 101 ]
INSTAR Project 16702: <strong>Archaeological</strong> applications <strong>of</strong> the Joint Irish Bathymetric Survey [<strong>JIBS</strong>] data<br />
Figure 6.18 Front page <strong>of</strong> the dedicated project web-site, launched in August<br />
2008.<br />
6.4.3 Conferences and public seminars<br />
Results from Phase 1 and early 2 <strong>of</strong> the project have been presented at a series <strong>of</strong><br />
national and international conferences and seminars:<br />
Forsythe, W. and Westley, K., 2009, Shipwrecks and Settlements on the North<br />
Coast. Invited Seminar as part <strong>of</strong> the Autumn Talks Series, Northern Ireland<br />
Environment Agency Coastal Zone centre, Portrush (12th November 2009).<br />
[Appendix B]<br />
Plets, R., Bell, T., Quinn, R., Westley, K., O’ Sullivan, A. and Renouf, M.A.P., 2009,<br />
A research strategy for mapping prehistoric submerged archaeological landscapes<br />
on the seabed <strong>of</strong>f Ireland and Newfoundland. Poster presented at the European<br />
Association <strong>of</strong> Archaeologists Conference, Riva del Garda (15-20 th September 2009).<br />
[Appendix B]<br />
Quinn, R., Forsythe, W., Plets, R., Westley, K., Clements, A., Benetti, S., Bell, T.,<br />
McGrath, F. and Robinson, R., 2009, <strong>Archaeological</strong> applications <strong>of</strong> the Joint Irish<br />
Bathymetric (<strong>JIBS</strong>) data. Poster presented at the Irish Shelf Petroleum Studies<br />
Group Atlantic Ireland 2009 Conference, IMI Conference Centre, Dublin (19-20<br />
October 2009) [Appendix B]<br />
Quinn, R., Plets, R., Westley, K., Clements, A., Forsythe, W., Benetti, S., Bell, T.,<br />
McGrath, F. and Robinson, R., 2009, Methodologies to Assess Shipwreck Sites and<br />
Submerged Landscapes. Invited Seminar at Near Surface 2009 – the 15th European<br />
Meeting <strong>of</strong> Environmental and Engineering Geophysics <strong>of</strong> the Near Surface,<br />
[ 102 ]
INSTAR Project 16702: <strong>Archaeological</strong> applications <strong>of</strong> the Joint Irish Bathymetric Survey [<strong>JIBS</strong>] data<br />
Geoscience Division, European Association <strong>of</strong> Geophysicists and Engineers, Dublin<br />
Castle, Ireland (7-9 th September 2009). [Appendix B]<br />
Westley, K., Quinn, R., Forsythe, W., Plets, R. and Bell, T., 2009, <strong>Archaeological</strong><br />
applications <strong>of</strong> the <strong>JIBS</strong> dataset: Submerged landscape mapping andr econstruction<br />
<strong>of</strong>f the north coast <strong>of</strong> Ireland. Paper presented at the European Association <strong>of</strong><br />
Archaeologists Conference, Riva del Garda (15-20 th September 2009). [Appendix B]<br />
[ 103 ]
INSTAR Project 16702: <strong>Archaeological</strong> applications <strong>of</strong> the Joint Irish Bathymetric Survey [<strong>JIBS</strong>] data<br />
7. IMPACT OF THE PROJECT<br />
Provision <strong>of</strong> the <strong>JIBS</strong> data is transforming geo-archaeological research and teaching<br />
at the University <strong>of</strong> Ulster. These data represent an unrivalled opportunity to<br />
contribute to the understanding <strong>of</strong> post-glacial sea-level change and colonization <strong>of</strong><br />
Ireland and afford the opportunity to produce models for shipwreck site formation at<br />
a resolution previously unachievable.<br />
7.1 Teaching<br />
<strong>JIBS</strong> case studies are now being used in the delivery <strong>of</strong> undergraduate and<br />
postgraduate modules, providing the next generation <strong>of</strong> earth- and archaeologicalscientists<br />
graduating from the University <strong>of</strong> Ulster with data processing and<br />
interpretation skills to meet the demands <strong>of</strong> a range <strong>of</strong> employers within the marine<br />
sector in Ireland.<br />
For example, new lectures and practical classes involving <strong>JIBS</strong> data were introduced<br />
into Modules EGM310 (Introduction to Remote Sensing and GIS) and EGM502<br />
(Seafloor Mapping) in 2009 [Appendix C]. The undergraduate students response to<br />
these data has been resoundingly positive.<br />
7.2 Research<br />
In 2009, the investigators were successful in securing ship time on the state<br />
Research Vessel Celtic Explorer (Figure 7.1) to continue to acquire data and<br />
samples within the <strong>JIBS</strong> study area. This research cruise will serve the dual purpose<br />
<strong>of</strong> acquiring new data for research and also act as a student training cruise to train<br />
undergraduate students in the methods to acquire, process, integrate and interpret<br />
marine geospatial data.<br />
Figure 7.1 The Marine Institute’s RV Celtic Explorer<br />
7.3 Practise<br />
Two main groups will benefit from this project:<br />
[ 104 ]
INSTAR Project 16702: <strong>Archaeological</strong> applications <strong>of</strong> the Joint Irish Bathymetric Survey [<strong>JIBS</strong>] data<br />
7.3.1 Policy makers and heritage bodies<br />
Managing cultural heritage is particularly difficult when objects are found on, or<br />
buried within, the seabed. Heritage bodies are generally faced with two major<br />
issues: (i) how to build up the underwater archaeological record (i.e. how to find<br />
sites) and (ii) how to manage a site once it has been discovered. Results from this<br />
study will address both <strong>of</strong> these issues ensuring that the Northern Ireland<br />
Environment Agency (NIEA) and the Republic <strong>of</strong> Ireland's Department <strong>of</strong><br />
Environment, Heritage and Local Government (DEHLG) will be able to supplement<br />
the known archaeological record, prioritize which sites need immediate attention<br />
and aid the development <strong>of</strong> longer term management plans through the adaptation<br />
<strong>of</strong> site formation models.<br />
Current policies and laws in place for shipwreck finds (e.g. Merchant Shipping Act<br />
1995 for Northern Ireland and the National Monuments Act 1994 for the Republic <strong>of</strong><br />
Ireland), are <strong>of</strong>ten difficult to enforce. While any wreck over 100 years old is<br />
automatically protected in the Republic <strong>of</strong> Ireland, in Northern Ireland, there is only<br />
a single wreck designated under the Protection <strong>of</strong> Wrecks Act 1973 (Spanish<br />
Armada site <strong>of</strong> La Girona). This project will potentially highlight more candidates for<br />
designation and steer future heritage policy.<br />
Although the case studies in this project focus on the maritime archaeology <strong>of</strong> the<br />
northern Irish coast, there is wider global applicability as heritage agencies from<br />
different nations should benefit from a critique <strong>of</strong> the methodology followed by this<br />
project for the assessment <strong>of</strong> acoustic data for archaeological purposes. This will be<br />
written up and published in international peer-reviewed journals (e.g. International<br />
Journal <strong>of</strong> Nautical Archaeology or Journal <strong>of</strong> <strong>Archaeological</strong> Science).<br />
Furthermore, the study <strong>of</strong> <strong>of</strong>fshore hydrodynamic processes as part <strong>of</strong> the site<br />
formation processes study provides invaluable information for coastal managers,<br />
particularly in the study <strong>of</strong> coastal vulnerability and the impact <strong>of</strong> rising sea-levels.<br />
7.3.2 The commercial/private sector<br />
Commercial seabed developers are increasingly required to ensure that they cause<br />
minimal disturbance to the underwater archaeological record. EU Council Directives<br />
require that environmental assessments are undertaken in the face <strong>of</strong> development<br />
applications, including an assessment <strong>of</strong> the archaeological impact. Licenses are<br />
required to dredge and dispose <strong>of</strong> material and other substances at sea, and also for<br />
work that involves building below the average spring high-water level. At present, in<br />
Northern Ireland, the CMA acts on behalf <strong>of</strong> the NIEA in assessing whether proposed<br />
work will affect the archaeological record, whether a licence should be granted or<br />
whether further mitigation measures are required.<br />
Information derived from the archaeological analysis <strong>of</strong> the <strong>JIBS</strong> and<br />
acoustic/geophysical data (e.g. accurate positions <strong>of</strong> submerged sites) will speed up<br />
the licensing and assessment process by ensuring a faster turnaround <strong>of</strong> the license<br />
application's approval or suggestions for amendments to the proposed<br />
development. Further, it will allow the CMA and DEHLG to advise developers during<br />
the survey planning stage by identifying the location <strong>of</strong> archaeologically sensitive<br />
areas or data gaps.<br />
[ 105 ]
INSTAR Project 16702: <strong>Archaeological</strong> applications <strong>of</strong> the Joint Irish Bathymetric Survey [<strong>JIBS</strong>] data<br />
8. SCHEDULE OF EXPENDITURE<br />
Below is the schedule <strong>of</strong> expenditure from 01.09.09 to 04.12.09. Please refer to the<br />
interim report for the schedule <strong>of</strong> expenditure for the earlier part <strong>of</strong> the project.<br />
Item Amount ( )<br />
Salaries 19,188.40<br />
Travel 1,669.77<br />
Consumables and lab supplies 2,078.96<br />
TOTAL 22,937.13<br />
[ 106 ]
INSTAR Project 16702: <strong>Archaeological</strong> applications <strong>of</strong> the Joint Irish Bathymetric Survey [<strong>JIBS</strong>] data<br />
9. REFERENCES<br />
Bamford, D.B. and Woodman, P., 2004. Tool hoards and Neolithic use <strong>of</strong> the<br />
landscape in North-Eastern Ireland. Oxford Journal <strong>of</strong> Archaeology, 23(1): 21-44.<br />
Bell, T. et al., 2008. A research strategy for mapping prehistoric archaeological<br />
potential on the seabed <strong>of</strong>f Newfoundland and Ireland, World <strong>Archaeological</strong><br />
Congress 6, Dublin.<br />
Bell, T., O' Sullivan, A. and Quinn, R., 2006, Discovering ancient landscapes under<br />
the sea, Archaeology Ireland, 20 (2): 12-17.<br />
Breen, C., 1996. Maritime archaeology in Northern Ireland: An interim statement.<br />
International Journal <strong>of</strong> Nautical Archaeology, 25(1): 55-65.<br />
Breen, C. and Forsythe, W., 2001. Management and protection <strong>of</strong> the maritime<br />
cultural resource in Ireland. Coastal Management, 29(1): 41-51.<br />
Breen, C. and Forsythe, W., 2004. Boats and Shipwrecks <strong>of</strong> Ireland. Tempus<br />
Publishing Ltd., Stroud, Gloucestershire, 192 pp.<br />
Breen, C., Quinn, R. and Forsythe, W., 2007. A preliminary analysis <strong>of</strong> historic<br />
shipwrecks in northern Ireland. Historical Archaeology, 41(3): 4-8.<br />
Brooks, A. and Edwards, R., 2006. The Development <strong>of</strong> a Sea-Level <strong>Data</strong>base for<br />
Ireland. Irish Journal <strong>of</strong> Earth Sciences, 24: 13-27.<br />
Brooks, A.J., 2007. Late Devensian and Holocene Relative Sea-Level Change<br />
around Ireland, Unpublished PhD Thesis. Dept. <strong>of</strong> Geography, Trinity College,<br />
Dublin.<br />
Brooks, A.J., Bradley, S.L., Edwards, R.J., Milne, G.A., Horton, B.P., Shennan, I.<br />
2008. Post-Glacial Relative Sea-Level Observations from Ireland and their Role in<br />
Glacial Rebound Modelling. Journal <strong>of</strong> Quaternary Science 23(2), 175-192.<br />
Bull, J.M., Quinn, R. and Dix, J.K., 1998, Reflection coefficient calculation from<br />
marine high-resolution seismic reflection (Chirp) data and application to an<br />
archaeological case study. Marine Geophysical Researches, 20: 1-11.<br />
Cooper, J. A. G., J. T. Kelley, D. F. Belknap, R. Quinn & J. McKenna, 2002. Inner<br />
shelf seismic stratigraphy <strong>of</strong>f the north coast <strong>of</strong> Northern Ireland: new data on the<br />
depth <strong>of</strong> the Holocene lowstand. Marine Geology, 186, 369-87.<br />
Edwards, R., A. J. Brooks, I. Shennan, G. A. Milne & S. L. Bradley, 2008. Reply:<br />
Postglacial relative sea-level observations from Ireland and their role in glacial<br />
rebound modelling. A. J. Brooks, S. L. Bradley, R. J. Edwards, G. A. Milne, B.<br />
Horton and I. Shennan (2008). Journal <strong>of</strong> Quaternary Science 23: 175-192.<br />
Journal <strong>of</strong> Quaternary Science, 23(8), 821-5.<br />
Evans, 2005. Computer s<strong>of</strong>tware: grid convert version 1.0. URL Available from:<br />
http://www.geospatialdesigns.com/gridconvert.htm (2005) (accessed 13.10.09)<br />
Flemming, N.C., 1998. <strong>Archaeological</strong> evidence for vertical movement on the<br />
continental shelf during the Palaeolithic, Neolithic and Bronze Age periods. In: I.<br />
[ 107 ]
INSTAR Project 16702: <strong>Archaeological</strong> applications <strong>of</strong> the Joint Irish Bathymetric Survey [<strong>JIBS</strong>] data<br />
Stewart and C. Vita-Finzi (Editors), Coastal Tectonics. Geological Society Special<br />
Publications. Geological Society, London pp. 129-146.<br />
Forsythe, W., Breen, C., Callaghan, C. & McConkey, R., 2000, Historic storms and<br />
shipwrecks in Ireland - a preliminary survey <strong>of</strong> severe synoptic conditions as a<br />
causal factor in underwater archaeology. International Journal <strong>of</strong> Nautical<br />
Archaeology 29, 2, 247-259.<br />
International Hydrographic Bureau, 1998. IHO Standards for Hydrographic<br />
Surveys - Special Publication No. 44.<br />
Kelley, J.T., Cooper, J.A.G., Jackson, D.W.T., Belknap, D.F. and Quinn, R., 2006,<br />
Sea-level change and inner shelf stratigraphy <strong>of</strong>f Northern Ireland. Marine Geology,<br />
232: 1-15.<br />
Lambeck, K., 1995. Late Devensian and Holocene shorelines <strong>of</strong> the British Isles<br />
and North Sea from models <strong>of</strong> glacio-hydro-isostatic rebound. Journal <strong>of</strong> the<br />
Geological Society, London, 152: 437-448.<br />
Lambeck, K. and Chappell, J., 2001. Sea level change through the Last Glacial<br />
cycle. Science, 292: 679-686.<br />
Lambeck, K. and Purcell, T., 2001. Sea-level change in the Irish Sea since the<br />
Last Glacial Maximum: constraints from isostatic modelling. Journal <strong>of</strong> Quaternary<br />
Science, 16(5): 497-506.<br />
McCabe, A.M., Carter, R.W.G. and Haynes, J.R., 1994. A shallow marine<br />
emergent sequence from the northwestern sector <strong>of</strong> the last British ice sheet,<br />
Portballintrae, Northern Ireland. Marine Geology, 117: 19-34.<br />
McCabe, A.M., Cooper, J.A.G. and Kelley, J.T., 2007. Relative sea-level changes<br />
from NE Ireland during the last glacial termination. Journal <strong>of</strong> the Geological<br />
Society, London,, 164: 1059-1063.<br />
McDowell, J.L., Knight, J. and Quinn, R., 2005. High-resolution geophysical<br />
investigations seaward <strong>of</strong> the Bann Estuary, Northern Ireland coast. In: D.M.<br />
FitzGerald and J. Knight (Editors), High Resolution Morphodynamics and<br />
Sedimentary Evolution <strong>of</strong> Estuaries. Coastal Systems and Continental Margins.<br />
Springer, pp. 11-31.<br />
McGonigle, C., Brown, C., Quinn, R and Grabowski, J. 2009. Evaluation <strong>of</strong> imagebased<br />
multibeam sonar backscatter classification for benthic habitat discrimination<br />
and mapping at Stanton Banks, UK. Estuarine, Coastal and Shelf Science, 81: 423-<br />
437<br />
McGonigle, C., Brown, C. and Quinn, R. in press. Operational parameters, data<br />
density and benthic ecology: considerations for image-based classification <strong>of</strong> MBES<br />
backscatter, Marine Geodesy<br />
O' Sullivan, A., 2001, Foragers, farmers and fishers in a coastal landscape: an<br />
intertidal archaeological survey <strong>of</strong> the Shannon estuary (Discovery Programme<br />
Monograph 5), Royal Irish Academy, Dublin, Ireland.<br />
Peltier, W.R., 1994. Ice Age paleotopography. Science, 265(5169): 195-201.<br />
[ 108 ]
INSTAR Project 16702: <strong>Archaeological</strong> applications <strong>of</strong> the Joint Irish Bathymetric Survey [<strong>JIBS</strong>] data<br />
Peltier, W.R. and Fairbanks, R.G., 2006. Global glacial ice volume and Last Glacial<br />
Maximum duration from an extended Barbados sea level record. Quaternary<br />
Science Reviews, 25: 3322-3337.<br />
Preston, J. 2009. Automated acoustic seabed classification <strong>of</strong> multibeam images <strong>of</strong><br />
Stanton Banks. Applied Acoustics. 70, 10: 1277-1287<br />
QTC, 2005 Quester Tangent Corporation, 2005. QTC MULTIVIEW Acoustic Seabed<br />
Classification for Multibeam Sonar, User Manual and Reference. Version 3. Quester<br />
Tangent, 201–9865 West Saanich Road, Sidney, B.C., Canada V8L 5Y8<br />
Quinn, R., 2006, The role <strong>of</strong> scour in shipwreck site formation processes and the<br />
preservation <strong>of</strong> wreck-associated scour signatures in the sedimentary record.<br />
Journal <strong>of</strong> <strong>Archaeological</strong> Science, 33 (10): 1419-1432.<br />
Quinn, R., Adams, J.R., Dix, J.K. and Bull, J.M., 1998a, The Invincible (1758) site –<br />
an integrated geophysical assessment. International Journal <strong>of</strong> Nautical<br />
Archaeology, 27.3: 126-138.<br />
Quinn, R., Bull, J.M. and Dix, J.K., 1998b, Optimal processing <strong>of</strong> marine highresolution<br />
seismic reflection (Chirp) data. Marine Geophysical Researches, 20: 13-<br />
20.<br />
Quinn, R., Cooper, JAG and Williams, B., 2000, Marine geophysical investigation <strong>of</strong><br />
the inshore coastal waters <strong>of</strong> Northern Ireland, International Journal <strong>of</strong> Nautical<br />
Archaeology, 29.2: 294-298.<br />
Quinn, R., Breen, C., Forsythe, W., Barton, K., Rooney, S. and O' Hara, D., 2002a,<br />
Integrated Geophysical Surveys <strong>of</strong> The French Frigate La Surveillante (1797),<br />
Bantry Bay, Co. Cork, Ireland, Journal <strong>of</strong> <strong>Archaeological</strong> Science, 29: 413-422.<br />
Quinn, R., Forsythe, W., Breen, C., Dean, M., Lawrence, M. and Liscoe, S., 2002b,<br />
Comparison <strong>of</strong> the Maritime Sites and Monuments Record with side-scan sonar and<br />
diver surveys: A case study from Rathlin Island, Ireland. Geoarchaeology, 17 (5):<br />
441-451.<br />
Quinn, R., Dean, M., Lawrence, M., Liscoe, S. and Boland, D., 2005, Backscatter<br />
responses and resolution considerations in archaeological side-scan sonar surveys:<br />
a control experiment, Journal <strong>of</strong> <strong>Archaeological</strong> Science, 32: 1252-1264.<br />
Quinn, R., Forsythe, W., Breen, C., Boland, D., Lane, P. and Lali Omar, A., 2007,<br />
Process-based models for port evolution and wreck site formation at Mombasa,<br />
Kenya. Journal <strong>of</strong> <strong>Archaeological</strong> Science, 34 (9): 1449-1460.<br />
Robidoux, L., Fonseca, L. and Wyatt, G. 2008. A Qualitative assessment <strong>of</strong> two<br />
multibeam echo sunder (MBES) backscatter analysis approach, Canadian<br />
Hydrographic Conference. Victoria, British Columbia, Canada, 5 - 8 May, pp. 1 - 1.<br />
Conference Proceeding<br />
Rochon, A., de Vernal, A., Sejrup, H.P. and Haflidason, H., 1998. Palynological<br />
evidence <strong>of</strong> climatic and oceanographic changes in the North Sea during the last<br />
deglaciation. Quaternary Research, 49: 197-207.<br />
Rowley-Conwy, C., 2004. How the West was lost. A reconsideration <strong>of</strong> agricultural<br />
origins in Britain, Ireland, and Southern Scandinavia. Current Anthropology, 45:<br />
S83-S113.<br />
[ 109 ]
INSTAR Project 16702: <strong>Archaeological</strong> applications <strong>of</strong> the Joint Irish Bathymetric Survey [<strong>JIBS</strong>] data<br />
Saville, A., Ballin, T.B. and Ward, T., 2007, Howburn, near Biggar, South<br />
Lanarkshire: Preliminary notice <strong>of</strong> a Scottish inland early Holocene lithic<br />
assemblage, Journal <strong>of</strong> the Lithic Studies Society, 28, 41-48<br />
Sejrup, H.P. et al., 2005. Pleistocene glacial history <strong>of</strong> the NW European<br />
continental margin. Marine and Petroleum Geology, 22: 1111-1129.<br />
Shennan, I. et al., 2006. Relative sea-level changes, glacial isostatic modelling<br />
and ice-sheet reconstructions from the British Isles since the Last Glacial<br />
Maximum. Journal <strong>of</strong> Quaternary Science, 21(6): 585-599.<br />
Smith, C., 1992. Late Stone Age hunters <strong>of</strong> the British Isles. Routledge, London.<br />
Van Wijngaarden-Bakker, L.H., 1990. Faunal remains and the Irish Mesolithic. In:<br />
C. Bonsall (Editor), The Mesolithic in Europe. Papers presented at the Third<br />
International Symposium Edinburgh 1985. John Donald Publishers Ltd,<br />
Edinburgh, pp. 125-133.<br />
Wheeler, A.J., 2002. Environmental Controls on Shipwreck Preservation: The Irish<br />
Context. Journal <strong>of</strong> <strong>Archaeological</strong> Science, 29: 1149-1159.<br />
Woodman, P., 1990. The Mesolithic <strong>of</strong> Munster: a preliminary assessment. In: C.<br />
Bonsall (Editor), The Mesolithic in Europe. Papers presented at the Third<br />
International Symposium Edinburgh 1985. John Donald Publishers Ltd,<br />
Edinburgh, pp. 116-124.<br />
Woodman, P., 2000. Getting back to basics: transitions to farming in Ireland. In:<br />
T.D. Price (Editor), Europe's First Farmers. Cambridge University Press,<br />
Cambridge, pp. 219-259.<br />
Woodman, P., McCarthy, M. and Monaghan, N., 1997. The Irish Quaternary fauna<br />
project. Quaternary Science Reviews, 16: 129-159.<br />
[ 110 ]