- Page 1 and 2:
INTRODUCTION OPPORTUNITIES AND CHAL
- Page 3 and 4:
Forest law enforcement and governan
- Page 5 and 6:
■ Protecting vital local and glob
- Page 7 and 8:
Figure 3 Commitment from the World
- Page 9 and 10:
Figure 6 Regional Distribution of I
- Page 11 and 12:
management and biodiversity conserv
- Page 13:
PART I Priority Themes and Operatio
- Page 16 and 17:
Angelsen and Wunder 2003; and Malli
- Page 18 and 19:
harvesting forest products that are
- Page 20 and 21:
forest management and ownership hav
- Page 22 and 23:
Institutional development of capaci
- Page 24 and 25:
Contreras-Hermosilla, A., and M. Si
- Page 26 and 27:
Box 1.4 Poverty-Forest Linkages Too
- Page 28 and 29:
Box 1.6 An Overview of the Tools fo
- Page 30 and 31:
NOTE 1.2 Community-Based Forest Man
- Page 32 and 33:
the biophysical resource through fo
- Page 34 and 35:
Box 1.12 Andhra Pradesh Community F
- Page 36 and 37:
Box 1.14 Community Forestry in Mexi
- Page 38 and 39:
World Bank, 1978. Forestry. Sector
- Page 40 and 41:
[Indigenous Peoples’] rights of o
- Page 42 and 43:
inappropriate. Thus, development pr
- Page 44 and 45:
nity territory into individual plot
- Page 46 and 47:
LESSONS LEARNED AND RECOMMENDATIONS
- Page 48 and 49:
Borrini-Feyerabend, G., M. Pimbert,
- Page 50 and 51:
In what are considered public fores
- Page 52 and 53:
Figure 1.1 Toward Tenure Security:A
- Page 54 and 55:
Box 1.21 Opportunities to Advance C
- Page 56 and 57:
NOTE 1.5 Making Markets Work for th
- Page 58 and 59:
■ environmental groups to produce
- Page 60 and 61:
Box 1.25 Medicinal Plants as NTFPs
- Page 63 and 64:
CHAPTER 2 Engaging the Private Sect
- Page 65 and 66:
dred to tens of thousands of new jo
- Page 67 and 68:
Box 2.2 Since 1995, Brazilian small
- Page 69 and 70:
Macqueen, D., N. Armitage, M. Jaeck
- Page 71 and 72:
NOTE 2.1 COMPANY-COMMUNITY PARTNERS
- Page 73 and 74:
inputs (communities), and cost savi
- Page 75 and 76:
community arrangements, such as eth
- Page 77 and 78:
NOTE 2.2 Small and Medium Enterpris
- Page 79 and 80:
must be distinguished from products
- Page 81 and 82:
overregulation falls most heavily o
- Page 83 and 84:
da Amazônia (IPAM) and the Interna
- Page 85 and 86:
NOTE 2.3 Innovative Marketing Arran
- Page 87 and 88:
Table 2.2 World Bank Projects with
- Page 89 and 90:
payments for reforestation can enco
- Page 91:
Wunder, S. 2005. “Payments for En
- Page 94 and 95:
Box 3.1 Technical Definitions Wood
- Page 96 and 97:
Table 3.2 Wood Fuel Data for Select
- Page 98 and 99:
ered it important to have the World
- Page 100 and 101:
operations (such as community-based
- Page 102 and 103:
also needs to be extended in many c
- Page 104 and 105:
NOTE 3.1 Mainstreaming Conservation
- Page 106 and 107:
areas that can be used more intensi
- Page 108 and 109:
Box 3.7 Applying HCVF in Papua New
- Page 110 and 111:
Finally, any existing protections,
- Page 112 and 113:
However, these general rules are se
- Page 114 and 115:
the origin of products from a certi
- Page 116 and 117:
management practices in selected en
- Page 118 and 119:
Reforms) provide the framework for
- Page 120 and 121:
lenges to weak institutions, which
- Page 123 and 124:
CHAPTER 4 Optimizing Forest Functio
- Page 125 and 126:
People and human societies are seen
- Page 127 and 128:
Encourage stakeholder participation
- Page 129 and 130:
Box 4.5 Tradeoffs Framework Used in
- Page 131 and 132:
Sector and Thematic Evaluation, Ope
- Page 133 and 134:
Identify planning team members and
- Page 135 and 136:
Involve relevant stakeholders in de
- Page 137 and 138:
needs of implementing partners and
- Page 139 and 140:
NOTE 4.2 Assessing Outcomes of Land
- Page 141 and 142:
Box 4.13 Possible Indicators for As
- Page 143 and 144:
NOTE 4.3 Using Adaptive Management
- Page 145 and 146:
■ ■ ■ ■ Develop a project p
- Page 147 and 148:
Another important and useful proces
- Page 149 and 150:
theless, it is never too late to st
- Page 151 and 152:
CHAPTER 5 IMPROVING FOREST GOVERNAN
- Page 153 and 154:
Improving forest governance and leg
- Page 155 and 156:
tant part of the World Bank’s con
- Page 157 and 158:
sector with broader governance and
- Page 159 and 160:
NOTE 5.1 Decentralized Forest Manag
- Page 161 and 162:
Assess the overall decentralization
- Page 163 and 164:
Box 5.5 Nicaragua: Asymmetries Betw
- Page 165 and 166:
Parker, A. 1995. “Decentralizatio
- Page 167 and 168:
■ ■ ■ Management of forests (
- Page 169 and 170:
such as designing a transparent con
- Page 171 and 172:
Box 5.11 Citizen Report Cards: Benc
- Page 173 and 174:
NOTE 5.3 Strengthening Legal Framew
- Page 175 and 176:
Box 5.13 Working on the Law with La
- Page 177 and 178:
In addition, the process of public
- Page 179 and 180:
ANNEX 5.3B SIX DRAFTING PRINCIPLES
- Page 181 and 182:
forestry policy or to promote other
- Page 183 and 184:
The most common fiscal incentives i
- Page 185 and 186: is reasonable to allow the administ
- Page 187 and 188: ANNEX 5.4A A SUMMARY OF THE DIFFERE
- Page 189 and 190: NOTE 5.5 ADDRESSING ILLEGAL LOGGING
- Page 191 and 192: Box 5.17 Measures Specific to Comba
- Page 193 and 194: ■ ■ ■ initially have to compe
- Page 195 and 196: enterprises may be motivated to joi
- Page 197 and 198: NOTES 1. This note is based on Worl
- Page 199 and 200: ANNEX 5.5B TYPICAL CONTEXTS OF ILLE
- Page 201: Typical contexts Potential drivers
- Page 204 and 205: Box 6.1 Indonesian Structural Adjus
- Page 206 and 207: Box 6.2 Upstream Analyses on Energy
- Page 208 and 209: Box 6.3 Positive Impact of Agrarian
- Page 210 and 211: Box 6.4 Use of the Rapid CEA Approa
- Page 212 and 213: ———. 2005. “Development Pol
- Page 214 and 215: NOTE 6.1 Using National Forest Prog
- Page 216 and 217: Box 6.6 Basic Principles of NFP Pre
- Page 218 and 219: Implementation. The implementation
- Page 220 and 221: allow for each country’s differen
- Page 222 and 223: limited in the coverage and duratio
- Page 224 and 225: Box 6.12 The Use of DPLs to Support
- Page 226 and 227: Box 6.13 Using DPLs in Lao PDR for
- Page 228 and 229: OPCS. 2004. “Good Practice Notes
- Page 230 and 231: OPERATIONAL ASPECTS Prioritizing th
- Page 232 and 233: orientation of the DPL operations c
- Page 234 and 235: Indicators are helpful in these sit
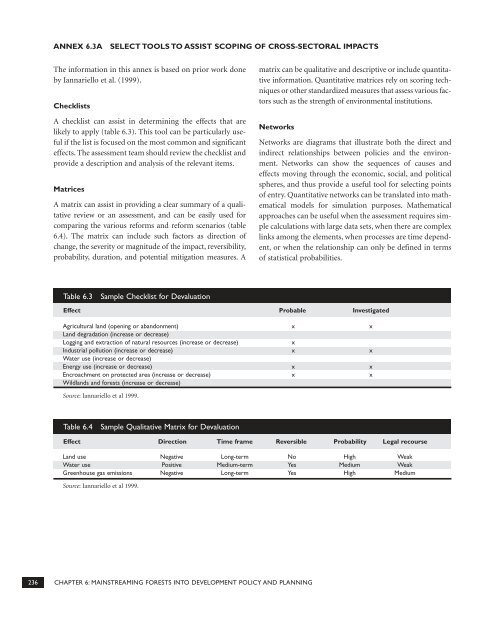
- Page 238 and 239: NOTE 6.4 Assessing Cross-Sectoral I
- Page 240 and 241: Box 6.16 The Forests Component in t
- Page 242 and 243: Considering the above issues, an in
- Page 244 and 245: Box 6.19 Implementation of the Keny
- Page 246 and 247: World Bank SEA Web resources: http:
- Page 248 and 249: Box 7.1 Monitoring Promotes Changes
- Page 250 and 251: collected via remote sensing rather
- Page 252 and 253: Discussions and proposals on how to
- Page 254 and 255: Assessment (www.millenniumassessmen
- Page 256 and 257: FAO. 2004. “Manual for Environmen
- Page 258 and 259: ■ ■ ■ enables implementation
- Page 260 and 261: selecting the technology. Technolog
- Page 262 and 263: USFS Field Guides: www.fia.fs.fed.u
- Page 264 and 265: Box 7.13 System Architecture of a S
- Page 266 and 267: Box 7.14 FMIS in Bosnia and Herzego
- Page 268 and 269: and client-rich system, which would
- Page 270 and 271: ANNEX 7.2A MODEL TERMS OF REFERENCE
- Page 272 and 273: ■ ■ ■ ■ ■ ■ ■ ■ ■
- Page 274 and 275: NOTE 7.3 Spatial Monitoring of Fore
- Page 276 and 277: ■ ■ ■ ■ Availability of ref
- Page 278 and 279: Box 7.19 Selecting the Appropriate
- Page 280 and 281: Table 7.4 Existing Satellite Remote
- Page 282 and 283: Tropical Ecosystem Environment Obse
- Page 285: PART II Guidance on Implementing Fo
- Page 288 and 289:
forestry activities was counterprod
- Page 290 and 291:
waterways, or the quantity or quali
- Page 292 and 293:
■ ■ ■ ■ ■ an independent
- Page 294 and 295:
■ In the case of forest harvestin
- Page 296 and 297:
■ ■ harvesting supported by Wor
- Page 298 and 299:
However, some of the World Bank’s
- Page 300 and 301:
■ ■ ■ ■ ■ ■ Examine the
- Page 302 and 303:
Box 9.2 Participation Strategy To m
- Page 304 and 305:
Box 9.5 Process Framework for Invol
- Page 306 and 307:
Box 9.8 Market Analysis A market an
- Page 308 and 309:
“no-project” option); and recom
- Page 310 and 311:
Box 9.16 Environmental Management P
- Page 312 and 313:
■ ■ ■ ■ ■ ■ ■ ■ ■
- Page 314 and 315:
the detailed Biodiversidade Brasile
- Page 316 and 317:
■ ■ management plan—prepared
- Page 319 and 320:
CHAPTER 10 Consultation and Communi
- Page 321 and 322:
media, NGOs, other interest groups,
- Page 323 and 324:
Box 10.4 Consultation in the Democr
- Page 325 and 326:
Box 10.6 Elements of Communication
- Page 327 and 328:
Table 10.2 Listening to the Public
- Page 329 and 330:
■ - Preliminary research should i
- Page 331 and 332:
Box 10.8 Managing Risks through Str
- Page 333 and 334:
Bank project cycle related to Commu
- Page 335 and 336:
CHAPTER 11 Forest Certification Ass
- Page 337 and 338:
carried out under a specific certif
- Page 339 and 340:
once more practical experience has
- Page 341 and 342:
ANNEX 11A MODEL TERMS OF REFERENCE
- Page 343 and 344:
ANNEX 11B PROCEDURES AND TERMS OF R
- Page 347 and 348:
CHAPTER 12 Applying OP 4.10 on Indi
- Page 349 and 350:
lack of opportunities relative to o
- Page 351 and 352:
Box 12.2 When a project affects Ind
- Page 353 and 354:
ples receive social and economic be
- Page 355 and 356:
Bank’s supervision team must incl
- Page 357:
ANNEX 12A ELEMENTS OF AN INDIGENOUS
- Page 360 and 361:
forest monitoring, 275b social and
- Page 362 and 363:
FOMAS. See National Forest Sector M
- Page 364 and 365:
and forest certification, 335 toolk
- Page 366 and 367:
applying to Indigenous Peoples, 347
- Page 368 and 369:
strategic partnership, LFI example,
- Page 372:
Eco-Audit Environmental Benefits St