to view the Maryland School Performance Reports - Harford County ...
to view the Maryland School Performance Reports - Harford County ...
to view the Maryland School Performance Reports - Harford County ...

Create successful ePaper yourself
Turn your PDF publications into a flip-book with our unique Google optimized e-Paper software.
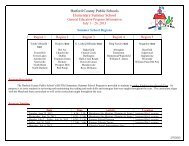
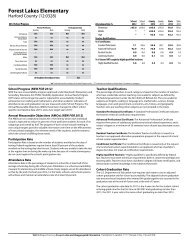
Churchville Elementary<br />
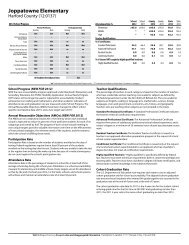
2012 <strong>School</strong> Progress Index<br />
2012 SPI: 1.0925<br />
Values 1.0000 and above met <strong>the</strong> target.<br />
Strand: 1<br />
Elementary <strong>School</strong> Indica<strong>to</strong>rs <br />
Grades 3 - 5<br />
≥2.00<br />
1.75<br />
Surpassed<br />
1.50<br />
1.25<br />
Met ➡ 1.00<br />
0.75<br />
0.50<br />
Not Met<br />
0.25<br />
0.00<br />
ACHIEVEMENT GAP REDUCTION GROWTH<br />
Ma<strong>the</strong>matics Reading Science Ma<strong>the</strong>matics Reading Science Ma<strong>the</strong>matics Reading<br />
1.0748 1.0640 1.0415 1.1088 1.0843 1.1939 1.0453<br />
<strong>School</strong> Progress Index (SPI)<br />
(NEW FOR 2012)<br />
The new <strong>Maryland</strong> <strong>School</strong> Progress Index<br />
is based on high expectations and multiple<br />
measures that include student achievement<br />
data in Reading, Ma<strong>the</strong>matics, and Science;<br />
growth data in English/Language Arts and<br />
Ma<strong>the</strong>matics; and gaps, based on <strong>the</strong> gap<br />
score between <strong>the</strong> highest-achieving and<br />
lowest-achieving subgroup in ma<strong>the</strong>matics,<br />
reading, science, cohort graduation and<br />
cohort dropout rates. <strong>Maryland</strong>’s <strong>School</strong><br />
Progress Index will differentiate schools<br />
in<strong>to</strong> one of five strands which determine<br />
<strong>the</strong> system and State support schools<br />
receive. The State affords <strong>to</strong>p-performing<br />
schools greater flexibility, while lowerperforming<br />
schools receive progressively<br />
more prescriptive technical assistance,<br />
expectations, and moni<strong>to</strong>ring.<br />
The <strong>School</strong> Progress Index evaluates schools<br />
on a continuous scale based on <strong>the</strong> variables<br />
of Achievement, Growth, Gap Reduction,<br />
and College- and Career-Readiness. The<br />
Indica<strong>to</strong>rs are specific <strong>to</strong> Elementary and<br />
Middle <strong>School</strong>s or High <strong>School</strong>s. Each<br />
Indica<strong>to</strong>r is comprised of specific Measures<br />
for Elementary and Middle schools or High<br />
<strong>School</strong>s. An index score of 1.0 is indicative<br />
of meeting all <strong>the</strong> targets, whereas a score<br />
greater than 1.0 means <strong>the</strong> school surpassed<br />
its targets.<br />
Achievement: Achievement represents<br />
<strong>the</strong> acquisition of <strong>the</strong> skills and knowledge<br />
students have acquired. The Achievement<br />
Indica<strong>to</strong>r represents <strong>the</strong> school’s<br />
performance for “all students” on <strong>the</strong><br />
MSA, Alt-MSA, and Mod-HSA in meeting<br />
Ma<strong>the</strong>matics, Reading, and Science<br />
proficient and advanced levels relative <strong>to</strong> <strong>the</strong><br />
school’s targets. Achievement is measured<br />
in all grades.<br />
Growth: Growth represents a student’s<br />
progress from one year <strong>to</strong> <strong>the</strong> next. The<br />
Growth Indica<strong>to</strong>r represents all students’<br />
growth within an elementary or middle<br />
school in attaining Ma<strong>the</strong>matics Proficiency<br />
and Reading Proficiency.<br />
Gap Reduction: Gap Reduction represents<br />
a decrease in <strong>the</strong> difference between <strong>the</strong><br />
highest-achieving subgroup and <strong>the</strong> lowestachieving<br />
subgroup by content areas. The<br />
Gap Indica<strong>to</strong>r represents <strong>the</strong> differences<br />
between <strong>the</strong> highest and lowest performing<br />
Visit MdReportCard.org for up-<strong>to</strong>-date and disaggregated information.<br />
subgroups in Ma<strong>the</strong>matics Proficiency,<br />
English/Language Arts Proficiency, and<br />
Science Proficiency at all grade levels and<br />
<strong>the</strong> five-year adjusted cohort graduation<br />
rate and four-year adjusted cohort dropout<br />
rate for high schools.<br />
College- and Career-Readiness (CCR):<br />
College- and Career-Readiness represents<br />
a combination of measures that ensure<br />
students are college and career ready upon<br />
graduation. Measured in high schools,<br />
CCR consists of <strong>the</strong> 5-year adjusted cohort<br />
graduation rate and College and Career<br />
Preparation (CCP). CCP is a measurement<br />
of a student who has exited high school<br />
with a <strong>Maryland</strong> State High <strong>School</strong> Diploma<br />
and met success in one of <strong>the</strong> following<br />
areas: Earning a 3 or better on an Advanced<br />
Placement (AP) Exam or a 4 or better on<br />
an International Baccalaureate Exam;<br />
Attaining advanced standing in a Career<br />
and Technology Education (CTE) Program<br />
of study; or Enrolled in a post-secondary<br />
institution (2-year, 4-year, or technical)<br />
within 16 months of graduation.<br />
Strands for Intervention,<br />
Support, and Recognition<br />
(NEW FOR 2012)<br />
The <strong>School</strong> Progress Index (SPI) and <strong>the</strong><br />
school’s result on each of <strong>the</strong> Indica<strong>to</strong>rs of<br />
<strong>the</strong> Index will give <strong>the</strong> school a very clear<br />
picture of its progress <strong>to</strong>ward meeting<br />
targets. Once <strong>the</strong> <strong>School</strong> Progress Index is<br />
calculated (with values of 0 <strong>to</strong> 1 or greater),<br />
<strong>the</strong> scores will be broken in<strong>to</strong> five strands<br />
for identifying interventions, support, and<br />
recognition <strong>to</strong> schools. <strong>School</strong>s in Strand<br />
1 will be schools meeting all targets and<br />
schools not meeting any of <strong>the</strong>ir targets<br />
will be in Strand 5. Although schools will,<br />
as always, have very unique profiles, <strong>the</strong><br />
<strong>Maryland</strong> State Department of Education<br />
(MSDE) will group <strong>the</strong> schools based on<br />
a measure of <strong>the</strong> magnitude of <strong>the</strong> issues<br />
<strong>the</strong>se schools face when meeting <strong>the</strong>ir<br />
targets. This Strand categorization allows<br />
MSDE and <strong>the</strong> Local Education Agency (LEA)<br />
<strong>to</strong> differentiate resources <strong>to</strong> schools by<br />
magnitude of need while precise diagnosis<br />
occurs at <strong>the</strong> school.