to view the Maryland School Performance Reports - Harford County ...
to view the Maryland School Performance Reports - Harford County ...
to view the Maryland School Performance Reports - Harford County ...

Create successful ePaper yourself
Turn your PDF publications into a flip-book with our unique Google optimized e-Paper software.
Churchville Elementary<br />
<strong>Harford</strong> <strong>County</strong> (12:0316)<br />
2012 <strong>School</strong> Progress<br />
All Students<br />
American Indian or<br />
Alaska Native<br />
Asian<br />
Black or African American<br />
Hispanic/Latino of any race<br />
Native Hawaiian or<br />
O<strong>the</strong>r Pacific Islander<br />
White<br />
Two or more races<br />
Free/Reduced Meals<br />
Special Education<br />
Limited English Proficient<br />
Percent Proficient<br />
Participation Rate<br />
Reading Math Reading Math<br />
Met Met Met Met<br />
na na na na<br />
na na na na<br />
Met Met na na<br />
Met Met na na<br />
na na na na<br />
Met Met Met Met<br />
Met Met na na<br />
Met Met na na<br />
Met Met na na<br />
* * * *<br />
Attendance Rate %<br />
<strong>School</strong><br />
2012<br />
<strong>School</strong><br />
2011<br />
<strong>County</strong><br />
2012<br />
<strong>County</strong><br />
2011<br />
State<br />
2012<br />
State<br />
2011<br />
Elementary ≥95.0 ≥95.0 ≥95.0 ≥95.0 95.9 95.6<br />
Middle * * ≥95.0 ≥95.0 95.4 95.3<br />
High * * 93.6 93.6 92.2 92.3<br />
Teacher Qualifications<br />
% of certificates:<br />
Standard Professional 31.6 33.3 24.6 28.1 29.0 30.8<br />
Advanced Professional 68.4 61.9 70.8 67.6 65.2 62.8<br />
Resident Teacher 0.0 0.0 0.0 0.0 0.9 1.4<br />
Conditional Teacher 0.0 0.0 0.1 0.6 0.9 1.2<br />
% of classes NOT taught by highly qualified teachers:<br />
Highly Qualified Teachers 5.0 4.5 3.5 4.4 6.9 7.6<br />
All Students Attendance Rate:<br />
Met<br />
“na” indicates <strong>to</strong>o few students for <strong>School</strong> Progress rules., “*” indicates no students or fewer than 10 students in category.<br />
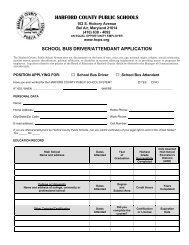
<strong>School</strong> Progress (NEW FOR 2012)<br />
With <strong>the</strong> new accountability program approved under <strong>Maryland</strong>’s Elementary and<br />
Secondary Education Act (ESEA) Flexibility Application, Annual Yearly Progress<br />
(AYP) status will no longer be used or reported for accountability. Student<br />
achievement on reading and ma<strong>the</strong>matics, and o<strong>the</strong>r academic indica<strong>to</strong>rs of<br />
attendance rate and graduation rate are measured under <strong>School</strong> Progress. The<br />
Annual Measurable Objectives (AMOs) have been changed <strong>to</strong> reflect school<br />
specific new baseline data (2011) and a new target year (2017).<br />
Annual Measurable Objectives (AMOs) (NEW FOR 2012)<br />
The AMOs are on a trajec<strong>to</strong>ry <strong>to</strong>ward 2017, <strong>the</strong> time by which each individual<br />
school is expected <strong>to</strong> reduce its percent of non-proficient students for each of its<br />
subgroups and overall by half. The progress of each school <strong>to</strong>ward meeting its<br />
own unique targets provides valuable information over time on <strong>the</strong> effectiveness<br />
of instructional strategies, <strong>the</strong> inherent needs of <strong>the</strong> students, and <strong>the</strong> extent <strong>to</strong><br />
which <strong>the</strong> school is fulfilling those needs.<br />
Participation Rate<br />
Participation Rate is based on <strong>the</strong> number of students enrolled on <strong>the</strong> day of<br />
testing. Federal regulations require that at least 95 percent of <strong>the</strong> students<br />
enrolled on <strong>the</strong> testing day take <strong>the</strong> test. Students who are unable <strong>to</strong> take <strong>the</strong> test<br />
at <strong>the</strong> regular time or during <strong>the</strong> make-up time because of a medical emergency<br />
do not count against <strong>the</strong> school’s participation rate.<br />
Attendance Rate<br />
Attendance Rate is <strong>the</strong> percentage of students in school for at least half of <strong>the</strong><br />
average school day during <strong>the</strong> school year. Attendance is a school accountability<br />
measure for elementary and middle schools. Yearly targets are set for attendance<br />
so that by <strong>the</strong> end of school year 2013-14, <strong>the</strong> State, schools, and school systems<br />
will achieve and maintain an attendance rate of at least 94 percent.<br />
Teacher Qualifications<br />
The percentage of teachers in each category is based on <strong>the</strong> number of teachers<br />
who have credentials and are teaching core academic subjects as defined by<br />
<strong>the</strong> federal government under <strong>the</strong> No Child Left Behind Act. The core academic<br />
subjects are English, reading or language arts, ma<strong>the</strong>matics, science, foreign<br />
languages, civics and government, economics, arts, his<strong>to</strong>ry, and geography.<br />
Teachers who are teaching o<strong>the</strong>r subjects are not included in <strong>the</strong> <strong>to</strong>tals.<br />
Standard Professional Certificate: A Standard Professional Certificate indicates<br />
<strong>the</strong> teacher meets all certification requirements.<br />
Advanced Professional Certificate: The Advanced Professional Certificate<br />
requires three years of satisfac<strong>to</strong>ry professional school-related experience, and a<br />
master’s degree or a minimum of 36 semester hours of post baccalaureate course<br />
work.<br />
Resident Teacher Certificate: The Resident Teacher Certificate is issued <strong>to</strong> a<br />
teacher in an approved alternative preparation program at <strong>the</strong> request of a local<br />
school system superintendent.<br />
Conditional Certificate: The Conditional Certificate is issued only at <strong>the</strong> request<br />
of a local school system superintendent <strong>to</strong> an applicant who has a bachelor’s<br />
degree but does not meet all certification requirements.<br />
Highly Qualified Teachers: “Highly qualified” is specifically defined by federal<br />
law. Teachers must meet minimum requirements both in content knowledge and<br />
teaching skills. Teachers must have a bachelor’s degree, full State certification, and<br />
demonstrate content knowledge in <strong>the</strong> subjects <strong>the</strong>y teach.<br />
Cohort Graduation Rate<br />
The U.S. Department of Education now requires each state <strong>to</strong> use an adjusted<br />
cohort graduation rate for school accountability. The adjusted cohort graduation<br />
rate ensures that all students who entered 9th grade <strong>to</strong>ge<strong>the</strong>r are counted in <strong>the</strong><br />
graduation rate at <strong>the</strong> end of 4 years and at <strong>the</strong> end of 5 years.<br />
The cohort graduation rate data for 2011 is <strong>the</strong> 4-year rate for <strong>the</strong> student cohort<br />
entering grade nine for <strong>the</strong> first time in fall 2007 and graduating no later than<br />
2011; <strong>the</strong> 2011 5-year rate is <strong>the</strong> same cohort graduating no later than 2012.<br />
Visit MdReportCard.org for up-<strong>to</strong>-date and disaggregated information.
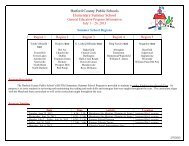
Churchville Elementary<br />
MSA Proficiency Levels<br />
Basic % Proficient % Advanced %<br />
Approximately 99% of <strong>Maryland</strong> students take MSA.<br />
The Basic Level is below <strong>the</strong> goal set for all students.<br />
Ma<strong>the</strong>matics Reading<br />
3 2012<br />
2011<br />
4 2012<br />
2011<br />
5 2012<br />
2011<br />
6 2012<br />
2011<br />
7 2012<br />
2011<br />
8 2012<br />
2011<br />
• E 2012<br />
2011<br />
3 2012<br />
2011<br />
4 2012<br />
2011<br />
5 2012<br />
2011<br />
6 2012<br />
2011<br />
7 2012<br />
2011<br />
8 2012<br />
2011<br />
≤5.0<br />
14.9<br />
≤5.0<br />
7.3<br />
7.4<br />
10.6<br />
*<br />
*<br />
*<br />
*<br />
*<br />
*<br />
*<br />
*<br />
7.9<br />
10.4<br />
≤5.0<br />
9.1<br />
7.4<br />
21.2<br />
*<br />
*<br />
*<br />
*<br />
*<br />
*<br />
63.5<br />
53.7<br />
49.3<br />
49.1<br />
22.2<br />
21.2<br />
*<br />
*<br />
*<br />
*<br />
*<br />
*<br />
*<br />
*<br />
58.7<br />
52.2<br />
32.8<br />
36.4<br />
44.4<br />
54.5<br />
*<br />
*<br />
*<br />
*<br />
*<br />
*<br />
31.7<br />
31.3<br />
46.3<br />
43.6<br />
70.4<br />
68.2<br />
*<br />
*<br />
*<br />
*<br />
*<br />
*<br />
*<br />
*<br />
33.3<br />
37.3<br />
62.7<br />
54.5<br />
48.1<br />
24.2<br />
*<br />
*<br />
*<br />
*<br />
*<br />
*<br />
11.4<br />
12.7<br />
6.1<br />
8.0<br />
6.9<br />
7.4<br />
12.3<br />
13.1<br />
13.2<br />
12.4<br />
14.5<br />
11.5<br />
16.2<br />
15.7<br />
10.1<br />
11.8<br />
7.3<br />
7.5<br />
10.5<br />
13.6<br />
12.9<br />
15.2<br />
14.8<br />
22.0<br />
27.0<br />
27.3<br />
65.8<br />
67.9<br />
54.0<br />
59.8<br />
32.5<br />
30.6<br />
45.2<br />
41.5<br />
33.2<br />
38.8<br />
39.2<br />
37.4<br />
53.3<br />
52.7<br />
52.9<br />
55.5<br />
34.9<br />
39.2<br />
56.6<br />
64.9<br />
48.7<br />
50.5<br />
54.4<br />
52.1<br />
38.0<br />
38.0<br />
22.8<br />
19.4<br />
39.9<br />
32.1<br />
60.7<br />
62.0<br />
42.5<br />
45.5<br />
53.6<br />
48.8<br />
46.3<br />
51.1<br />
30.6<br />
31.6<br />
37.0<br />
32.6<br />
57.8<br />
53.3<br />
32.9<br />
21.5<br />
38.4<br />
34.3<br />
30.8<br />
25.9<br />
35.1<br />
34.8<br />
15.0<br />
14.9<br />
10.2<br />
11.3<br />
10.1<br />
9.8<br />
15.5<br />
16.2<br />
18.8<br />
15.9<br />
19.2<br />
17.3<br />
16.9<br />
18.3<br />
12.2<br />
13.7<br />
10.1<br />
9.7<br />
14.7<br />
17.7<br />
17.0<br />
19.0<br />
23.7<br />
25.7<br />
30.7<br />
33.9<br />
64.4<br />
64.6<br />
55.6<br />
59.3<br />
34.9<br />
34.4<br />
42.7<br />
41.0<br />
35.5<br />
40.6<br />
36.6<br />
36.8<br />
54.9<br />
53.4<br />
49.0<br />
50.9<br />
38.6<br />
40.6<br />
54.8<br />
59.4<br />
47.6<br />
48.9<br />
49.5<br />
48.9<br />
36.2<br />
33.7<br />
20.6<br />
20.5<br />
34.2<br />
29.4<br />
55.1<br />
55.8<br />
41.8<br />
42.8<br />
45.7<br />
43.4<br />
44.2<br />
45.9<br />
28.2<br />
28.4<br />
38.7<br />
35.4<br />
51.2<br />
49.7<br />
30.5<br />
22.8<br />
35.5<br />
32.1<br />
26.9<br />
25.4<br />
33.1<br />
32.4<br />
• A 2012<br />
2011<br />
*<br />
*<br />
*<br />
*<br />
*<br />
*<br />
10.6<br />
10.6<br />
53.7<br />
58.4<br />
35.7<br />
31.1<br />
16.1<br />
16.4<br />
53.1<br />
53.6<br />
30.8<br />
30.0<br />
Science<br />
Description of MSA Proficiency Levels<br />
Basic %<br />
Proficient %<br />
Advanced %<br />
5 2012<br />
2011<br />
8 2012<br />
2011<br />
• B 2012<br />
2011<br />
Reading: English: Ma<strong>the</strong>matics: Algebra/Data Analysis: Science: Biology:<br />
Students are unable <strong>to</strong> read<br />
and understand literature<br />
and passages of information<br />
that are written for students<br />
in <strong>the</strong>ir grade.<br />
Students can read text<br />
written for students in<br />
<strong>the</strong>ir grade, and <strong>the</strong>y can<br />
demonstrate <strong>the</strong> ability <strong>to</strong><br />
understand literature and<br />
passages of information.<br />
Students can regularly read<br />
text that is above <strong>the</strong>ir<br />
grade level, and <strong>the</strong>y can<br />
demonstrate <strong>the</strong> ability<br />
<strong>to</strong> understand complex<br />
literature and passages of<br />
information.<br />
13.0<br />
18.2<br />
*<br />
*<br />
*<br />
*<br />
74.1<br />
62.1<br />
*<br />
100 50 0 50 100<br />
Students have difficulty<br />
comprehending gradeappropriate<br />
literature<br />
and applying language<br />
choices when writing.<br />
*<br />
*<br />
*<br />
Students can comprehend<br />
grade-appropriate<br />
literature and apply<br />
appropriate language<br />
choices when writing.<br />
Students can regularly<br />
comprehend and<br />
interpret complex<br />
literature and consistently<br />
apply appropriate<br />
language choices <strong>to</strong> write<br />
effectively.<br />
13.0<br />
“*” indicates no students or fewer than 10 students in category., • E: English; • A: Algebra/Data Analysis; • B: Biology<br />
Students show <strong>the</strong>y have only Students show <strong>the</strong>y have only<br />
partially mastered <strong>the</strong> skills and partially mastered <strong>the</strong> skills and<br />
concepts that <strong>Maryland</strong> expects concepts defined in <strong>the</strong> <strong>Maryland</strong><br />
students <strong>to</strong> know and be able <strong>to</strong> Algebra/Data Analysis Core<br />
do at this grade level.<br />
Learning Goals.<br />
Students show <strong>the</strong>y have an<br />
understanding of fundamental<br />
grade level skills and concepts<br />
and can generally solve entrylevel<br />
problems in ma<strong>the</strong>matics.<br />
Students show <strong>the</strong>y can<br />
regularly solve complex<br />
problems in ma<strong>the</strong>matics and<br />
demonstrate superior ability <strong>to</strong><br />
reason ma<strong>the</strong>matically.<br />
Students show <strong>the</strong>y have an<br />
understanding of fundamental<br />
algebra/data analysis skills and<br />
concepts and can generally solve<br />
entry-level problems in algebra/<br />
data analysis.<br />
Visit MdReportCard.org for up-<strong>to</strong>-date and disaggregated information.<br />
19.7<br />
*<br />
*<br />
*<br />
*<br />
23.2<br />
22.8<br />
19.7<br />
18.8<br />
15.9<br />
13.9<br />
64.7<br />
67.3<br />
73.4<br />
73.9<br />
65.0<br />
69.4<br />
100 50 0 50 100<br />
12.1<br />
Students show <strong>the</strong>y need more<br />
work <strong>to</strong> attain proficiency.<br />
They use minimal supporting<br />
evidence, and responses<br />
provide little or no syn<strong>the</strong>sis of<br />
information.<br />
Students use supporting<br />
evidence that is generally<br />
complete with some integration<br />
of scientific concepts, principles,<br />
and/or skills.<br />
Students can regularly solve Students use scientific evidence<br />
complex algebra/data analysis <strong>to</strong> demonstrate a full integration<br />
problems and demonstrate superior of scientific concepts, principles,<br />
ability <strong>to</strong> reason ma<strong>the</strong>matically. and/or skills.<br />
9.9<br />
6.9<br />
7.3<br />
19.1<br />
16.7<br />
31.5<br />
33.2<br />
29.3<br />
30.5<br />
18.3<br />
18.7<br />
57.5<br />
57.0<br />
63.3<br />
63.1<br />
59.6<br />
61.5<br />
100 50 0 50 100<br />
11.1<br />
Students demonstrate a minimal understanding of<br />
biology concepts, principles, and/or skills. Student<br />
responses indicate limited syn<strong>the</strong>sis of information<br />
and understanding of scientific terminology.<br />
Students demonstrate a realistic and rigorous<br />
level of achievement by providing evidence of<br />
an understanding of biology concepts and <strong>the</strong><br />
ability <strong>to</strong> use scientific evidence <strong>to</strong> generally<br />
integrate scientific concepts, principles, and/or<br />
skills. Student responses indicate some syn<strong>the</strong>sis<br />
of information and understanding of scientific<br />
terminology.<br />
9.9<br />
7.4<br />
6.5<br />
22.1<br />
19.8<br />
Students demonstrate an exemplary level of<br />
achievement by providing evidence of a complete<br />
understanding of biology concepts and <strong>the</strong><br />
ability <strong>to</strong> use scientific evidence <strong>to</strong> fully integrate<br />
scientific concepts, principles, and/or skills.<br />
Student responses indicate a complete syn<strong>the</strong>sis<br />
of information and understanding of scientific<br />
terminology.
Churchville Elementary<br />
Alt-MSA Proficiency Levels<br />
Basic % Proficient % Advanced %<br />
Approximately 1% of <strong>Maryland</strong> students take Alt-MSA.<br />
The Basic Level is below <strong>the</strong> goal set for all students.<br />
3 2012<br />
2011<br />
*<br />
*<br />
*<br />
*<br />
*<br />
*<br />
5.9<br />
21.7<br />
23.5<br />
39.1<br />
70.6<br />
39.1<br />
7.2<br />
7.5<br />
18.5<br />
30.9<br />
74.3<br />
61.6<br />
4 2012<br />
2011<br />
*<br />
*<br />
*<br />
*<br />
*<br />
*<br />
13.0<br />
≤5.0<br />
17.4<br />
28.6<br />
69.6<br />
71.4<br />
8.7<br />
10.3<br />
16.8<br />
24.2<br />
74.5<br />
65.5<br />
Ma<strong>the</strong>matics Reading<br />
5 2012<br />
2011<br />
6 2012<br />
2011<br />
7 2012<br />
2011<br />
8 2012<br />
2011<br />
10 2012<br />
2011<br />
3 2012<br />
2011<br />
4 2012<br />
2011<br />
5 2012<br />
2011<br />
6 2012<br />
2011<br />
7 2012<br />
2011<br />
*<br />
*<br />
*<br />
*<br />
*<br />
*<br />
*<br />
*<br />
*<br />
*<br />
*<br />
*<br />
*<br />
*<br />
*<br />
*<br />
*<br />
*<br />
*<br />
*<br />
*<br />
*<br />
*<br />
*<br />
*<br />
*<br />
*<br />
*<br />
*<br />
*<br />
*<br />
*<br />
*<br />
*<br />
*<br />
*<br />
*<br />
*<br />
*<br />
*<br />
*<br />
*<br />
*<br />
*<br />
*<br />
*<br />
*<br />
*<br />
*<br />
*<br />
*<br />
*<br />
*<br />
*<br />
*<br />
*<br />
*<br />
*<br />
*<br />
*<br />
5.3<br />
8.3<br />
10.0<br />
≤5.0<br />
≤5.0<br />
≤5.0<br />
10.6<br />
≤5.0<br />
5.3<br />
6.9<br />
17.6<br />
26.1<br />
8.7<br />
≤5.0<br />
5.3<br />
20.8<br />
13.3<br />
11.1<br />
≤5.0<br />
≤5.0<br />
26.3<br />
33.3<br />
23.3<br />
38.9<br />
14.3<br />
23.9<br />
14.9<br />
21.1<br />
18.4<br />
34.5<br />
29.4<br />
52.2<br />
30.4<br />
35.7<br />
31.6<br />
50.0<br />
36.7<br />
44.4<br />
38.1<br />
52.2<br />
68.4<br />
58.3<br />
66.7<br />
61.1<br />
81.0<br />
76.1<br />
74.5<br />
76.3<br />
76.3<br />
58.6<br />
52.9<br />
21.7<br />
60.9<br />
64.3<br />
63.2<br />
29.2<br />
50.0<br />
44.4<br />
57.1<br />
45.7<br />
6.5<br />
7.9<br />
7.2<br />
6.0<br />
6.1<br />
5.6<br />
8.1<br />
8.1<br />
10.7<br />
9.1<br />
10.9<br />
12.0<br />
9.9<br />
12.4<br />
9.5<br />
10.3<br />
9.8<br />
10.7<br />
8.7<br />
8.7<br />
16.2<br />
29.7<br />
17.6<br />
27.9<br />
13.1<br />
23.2<br />
15.2<br />
24.7<br />
15.3<br />
21.0<br />
30.7<br />
40.0<br />
30.0<br />
40.4<br />
33.7<br />
46.3<br />
30.9<br />
41.3<br />
31.2<br />
38.2<br />
77.3<br />
62.4<br />
75.2<br />
66.1<br />
80.7<br />
71.1<br />
76.7<br />
67.2<br />
74.0<br />
69.9<br />
58.5<br />
47.9<br />
60.1<br />
47.2<br />
56.8<br />
43.4<br />
59.3<br />
48.0<br />
60.1<br />
53.1<br />
8 2012<br />
2011<br />
*<br />
*<br />
*<br />
*<br />
*<br />
*<br />
14.9<br />
5.3<br />
34.0<br />
47.4<br />
51.1<br />
47.4<br />
9.9<br />
13.2<br />
36.8<br />
36.3<br />
53.3<br />
50.5<br />
10 2012<br />
2011<br />
*<br />
*<br />
*<br />
*<br />
*<br />
*<br />
5.3<br />
10.3<br />
28.9<br />
58.6<br />
65.8<br />
31.0<br />
14.0<br />
11.8<br />
31.8<br />
42.8<br />
54.2<br />
45.5<br />
Science<br />
5 2012<br />
2011<br />
8 2012<br />
2011<br />
10 2012<br />
2011<br />
*<br />
*<br />
*<br />
*<br />
*<br />
*<br />
*<br />
*<br />
*<br />
*<br />
*<br />
*<br />
*<br />
*<br />
*<br />
*<br />
*<br />
*<br />
31.6<br />
12.5<br />
10.6<br />
7.9<br />
7.9<br />
24.1<br />
31.6<br />
70.8<br />
44.7<br />
52.6<br />
39.5<br />
51.7<br />
36.8<br />
16.7<br />
44.7<br />
39.5<br />
52.6<br />
24.1<br />
15.5<br />
13.5<br />
16.8<br />
17.0<br />
21.7<br />
23.8<br />
37.2<br />
50.3<br />
42.6<br />
48.7<br />
41.4<br />
46.8<br />
47.3<br />
36.2<br />
40.6<br />
34.3<br />
36.9<br />
29.5<br />
100 50 0 50 100<br />
100 50 0 50 100<br />
100 50 0 50 100<br />
“*” indicates no students or fewer than 10 students in category.,<br />
MARYLAND SCHOOL ASSESSMENT (MSA)<br />
The MSA measures what students in grades 3-8 know about reading<br />
and ma<strong>the</strong>matics. High school performance is measured by <strong>the</strong> English<br />
and Algebra/Data Analysis High <strong>School</strong> Assessment (HSA). Science was<br />
measured in grades 5 and 8 and by <strong>the</strong> Biology HSA starting in 2011.<br />
Science is not part of <strong>School</strong> Progress. <strong>Performance</strong> is reported as <strong>the</strong><br />
percent of students in each grade who achieved <strong>the</strong> Basic, Proficient, or<br />
Advanced standard. All students should be achieving at <strong>the</strong> Proficient or<br />
Advanced standard. High school special education students working on<br />
grade level content who may need an assessment that is more accessible<br />
for a student with disabilities may be eligible <strong>to</strong> take <strong>the</strong> Mod-HSA. This is<br />
determined by <strong>the</strong> Individualized Education Program (IEP) Team.<br />
ALTERNATE MARYLAND SCHOOL ASSESSMENT<br />
(Alt-MSA)<br />
The Alternate <strong>Maryland</strong> <strong>School</strong> Assessment (Alt-MSA) is taken by<br />
students with disabilities who cannot take <strong>the</strong> MSA even with <strong>the</strong><br />
special accommodations <strong>the</strong>y receive as part of <strong>the</strong>ir regular classroom<br />
instruction. The test measures <strong>the</strong> student’s mastery of reading and<br />
ma<strong>the</strong>matics content standards or appropriate access skills. Eligible<br />
students take <strong>the</strong> test in grades 3-8 and once during <strong>the</strong> high school<br />
grade band. <strong>Performance</strong> is reported as <strong>the</strong> percent of students in each<br />
grade who achieved <strong>the</strong> Basic, Proficient, or Advanced standard.<br />
Visit MdReportCard.org for up-<strong>to</strong>-date and disaggregated information.
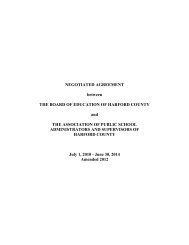
Churchville Elementary<br />
2012 <strong>School</strong> Progress Index<br />
2012 SPI: 1.0925<br />
Values 1.0000 and above met <strong>the</strong> target.<br />
Strand: 1<br />
Elementary <strong>School</strong> Indica<strong>to</strong>rs <br />
Grades 3 - 5<br />
≥2.00<br />
1.75<br />
Surpassed<br />
1.50<br />
1.25<br />
Met ➡ 1.00<br />
0.75<br />
0.50<br />
Not Met<br />
0.25<br />
0.00<br />
ACHIEVEMENT GAP REDUCTION GROWTH<br />
Ma<strong>the</strong>matics Reading Science Ma<strong>the</strong>matics Reading Science Ma<strong>the</strong>matics Reading<br />
1.0748 1.0640 1.0415 1.1088 1.0843 1.1939 1.0453<br />
<strong>School</strong> Progress Index (SPI)<br />
(NEW FOR 2012)<br />
The new <strong>Maryland</strong> <strong>School</strong> Progress Index<br />
is based on high expectations and multiple<br />
measures that include student achievement<br />
data in Reading, Ma<strong>the</strong>matics, and Science;<br />
growth data in English/Language Arts and<br />
Ma<strong>the</strong>matics; and gaps, based on <strong>the</strong> gap<br />
score between <strong>the</strong> highest-achieving and<br />
lowest-achieving subgroup in ma<strong>the</strong>matics,<br />
reading, science, cohort graduation and<br />
cohort dropout rates. <strong>Maryland</strong>’s <strong>School</strong><br />
Progress Index will differentiate schools<br />
in<strong>to</strong> one of five strands which determine<br />
<strong>the</strong> system and State support schools<br />
receive. The State affords <strong>to</strong>p-performing<br />
schools greater flexibility, while lowerperforming<br />
schools receive progressively<br />
more prescriptive technical assistance,<br />
expectations, and moni<strong>to</strong>ring.<br />
The <strong>School</strong> Progress Index evaluates schools<br />
on a continuous scale based on <strong>the</strong> variables<br />
of Achievement, Growth, Gap Reduction,<br />
and College- and Career-Readiness. The<br />
Indica<strong>to</strong>rs are specific <strong>to</strong> Elementary and<br />
Middle <strong>School</strong>s or High <strong>School</strong>s. Each<br />
Indica<strong>to</strong>r is comprised of specific Measures<br />
for Elementary and Middle schools or High<br />
<strong>School</strong>s. An index score of 1.0 is indicative<br />
of meeting all <strong>the</strong> targets, whereas a score<br />
greater than 1.0 means <strong>the</strong> school surpassed<br />
its targets.<br />
Achievement: Achievement represents<br />
<strong>the</strong> acquisition of <strong>the</strong> skills and knowledge<br />
students have acquired. The Achievement<br />
Indica<strong>to</strong>r represents <strong>the</strong> school’s<br />
performance for “all students” on <strong>the</strong><br />
MSA, Alt-MSA, and Mod-HSA in meeting<br />
Ma<strong>the</strong>matics, Reading, and Science<br />
proficient and advanced levels relative <strong>to</strong> <strong>the</strong><br />
school’s targets. Achievement is measured<br />
in all grades.<br />
Growth: Growth represents a student’s<br />
progress from one year <strong>to</strong> <strong>the</strong> next. The<br />
Growth Indica<strong>to</strong>r represents all students’<br />
growth within an elementary or middle<br />
school in attaining Ma<strong>the</strong>matics Proficiency<br />
and Reading Proficiency.<br />
Gap Reduction: Gap Reduction represents<br />
a decrease in <strong>the</strong> difference between <strong>the</strong><br />
highest-achieving subgroup and <strong>the</strong> lowestachieving<br />
subgroup by content areas. The<br />
Gap Indica<strong>to</strong>r represents <strong>the</strong> differences<br />
between <strong>the</strong> highest and lowest performing<br />
Visit MdReportCard.org for up-<strong>to</strong>-date and disaggregated information.<br />
subgroups in Ma<strong>the</strong>matics Proficiency,<br />
English/Language Arts Proficiency, and<br />
Science Proficiency at all grade levels and<br />
<strong>the</strong> five-year adjusted cohort graduation<br />
rate and four-year adjusted cohort dropout<br />
rate for high schools.<br />
College- and Career-Readiness (CCR):<br />
College- and Career-Readiness represents<br />
a combination of measures that ensure<br />
students are college and career ready upon<br />
graduation. Measured in high schools,<br />
CCR consists of <strong>the</strong> 5-year adjusted cohort<br />
graduation rate and College and Career<br />
Preparation (CCP). CCP is a measurement<br />
of a student who has exited high school<br />
with a <strong>Maryland</strong> State High <strong>School</strong> Diploma<br />
and met success in one of <strong>the</strong> following<br />
areas: Earning a 3 or better on an Advanced<br />
Placement (AP) Exam or a 4 or better on<br />
an International Baccalaureate Exam;<br />
Attaining advanced standing in a Career<br />
and Technology Education (CTE) Program<br />
of study; or Enrolled in a post-secondary<br />
institution (2-year, 4-year, or technical)<br />
within 16 months of graduation.<br />
Strands for Intervention,<br />
Support, and Recognition<br />
(NEW FOR 2012)<br />
The <strong>School</strong> Progress Index (SPI) and <strong>the</strong><br />
school’s result on each of <strong>the</strong> Indica<strong>to</strong>rs of<br />
<strong>the</strong> Index will give <strong>the</strong> school a very clear<br />
picture of its progress <strong>to</strong>ward meeting<br />
targets. Once <strong>the</strong> <strong>School</strong> Progress Index is<br />
calculated (with values of 0 <strong>to</strong> 1 or greater),<br />
<strong>the</strong> scores will be broken in<strong>to</strong> five strands<br />
for identifying interventions, support, and<br />
recognition <strong>to</strong> schools. <strong>School</strong>s in Strand<br />
1 will be schools meeting all targets and<br />
schools not meeting any of <strong>the</strong>ir targets<br />
will be in Strand 5. Although schools will,<br />
as always, have very unique profiles, <strong>the</strong><br />
<strong>Maryland</strong> State Department of Education<br />
(MSDE) will group <strong>the</strong> schools based on<br />
a measure of <strong>the</strong> magnitude of <strong>the</strong> issues<br />
<strong>the</strong>se schools face when meeting <strong>the</strong>ir<br />
targets. This Strand categorization allows<br />
MSDE and <strong>the</strong> Local Education Agency (LEA)<br />
<strong>to</strong> differentiate resources <strong>to</strong> schools by<br />
magnitude of need while precise diagnosis<br />
occurs at <strong>the</strong> school.