

LIFE01200604005 Shri Somnath Ghosh - Homi Bhabha National ...
LIFE01200604005 Shri Somnath Ghosh - Homi Bhabha National ...
LIFE01200604005 Shri Somnath Ghosh - Homi Bhabha National ...

You also want an ePaper? Increase the reach of your titles
YUMPU automatically turns print PDFs into web optimized ePapers that Google loves.
Cancer Invest Downloaded from informahealthcare.com by University of Chicago Library on 06/10/11<br />
For personal use only.<br />
Table 1. The Sequences of Gene Specific Primers and Their<br />
Annealing Temperature (Tm) Used in RT-PCR Experiments<br />
Gene Primer Sequence Tm ( ◦ C)<br />
β-actin F 5 ′ -TGGAATCCTGTGGCATCCATGAAA-3 ′ 55<br />
R5 ′ -TAAAACGCAGCTCAGTAACAGTCCG-3 ′<br />
ATM F 5 ′ -GGACAGTGGAGGCACAAAAT-3 ′ 57<br />
R5 ′ -GTGTCGAAGACAGCTGGTGA-3 ′<br />
ATR F 5 ′ -CTCGCTGAACTGTACGTGGA-3 ′ 57<br />
R5 ′ -GCATAGCTCGACCATGGATT-3 ′<br />
DNA-PK F 5 ′ -TGCCAATCCAGCAGTCATTA-3 ′ 64<br />
R5 ′ -GGTCCATCAGGCACTTCACT-3 ′<br />
Chk2 F 5 ′ -GGCTTCAGGATGAAGACATGA-3 ′ 64<br />
R5 ′ -CACAACACAGCAGCACACAC-3 ′<br />
Chk1 F 5 ′ -TGTCAGAGTCTCCCAGTGGA-3 ′ 59<br />
R5 ′ -AGGGGCTGGTATCCCATAAG-3 ′<br />
Bax F 5 ′ -TCCCCCCGAGAGGTCTTT-3 ′ 56<br />
R5 ′ -CGGCCCCAGTTGAAGTTG-3 ′<br />
Bcl-2 F 5 ′ -GAGGATTGTGGCCTTCTTTG-3 ′ 59<br />
R5 ′ -ACAGTTCCACAAAGGCATCC-3 ′<br />
F indicates forward and R indicates reverse.<br />
The bands in the gel were visualized under UV lamp and relative<br />
intensities were quantified using Gel doc software (Syngene).<br />
Immunofluorescence staining<br />
Cells were grown in cover slips that were kept in 35 mm<br />
petri dishes and irradiated as mentioned above. Cell layers were<br />
washed 4 h after irradiation in PBS and fixed for 20 min in 4%<br />
paraformaldehyde at room temperature. Afterward, the cells<br />
were washed twice in PBS. For immunofluorescence staining,<br />
cells were permeabilized for 3 min in 0.25% Triton X-100 in<br />
PBS, washed two times in PBS, and blocked for 1 hr with 5%<br />
BSA in PBS. Antibodies were diluted (1:200) in 1% BSA in<br />
PBS. Cells were incubated with primary antibodies for 1 hr<br />
30 min at room temperature, washed three times in PBS, and<br />
incubated with secondary antibodies for 1 hr at room temperature.<br />
Finally, cells were rinsed and mounted with ProLong<br />
Gold antifede with DAPI mounting media (Molecular Probe,<br />
USA). Images were captured using Carl Zeiss confocal microscope.<br />
Acquisition settings were optimized to obtain maximal<br />
signal in immunostained cells with minimal background. The<br />
primary antibodies used were mouse anti-pATM (S1981), rabbit<br />
anti-γ -H2AX (S139), rabbit anti-pChk2 (Thr68), and mouse<br />
anti-phospho-p53 (S15) (Cell Signaling). Secondary antibodies<br />
used were Alexa Fluor 488 goat antirabbit IgG and Alexa Fluor<br />
488 goat antimouse IgG (Molecular Probe, USA).<br />
Image analysis using ImageJ software<br />
The captured images were analyzed for relative quantification<br />
of phosphorylation using ImageJ software (23). A 25 × 25<br />
pixel box was positioned over the fluorescent image of each cell,<br />
and the average intensity within the selection (the sum of the<br />
intensities of all the pixels in the selection divided by the number<br />
of pixels) was measured. At least 100 cells per experiment<br />
were analyzed from three independent experiments.<br />
Statistical analysis<br />
The data were imported to excel worksheets, and graphs<br />
were made using Origin version 5.0. One-way ANOVA with<br />
Tukey–Kramer Multiple Comparisons as post-test for p < .05<br />
used to study the significant level. Data were insignificant at<br />
p > .05. Each point represented as mean ± S.E. (standard error<br />
of the mean).<br />
RESULTS<br />
Cell survival assay<br />
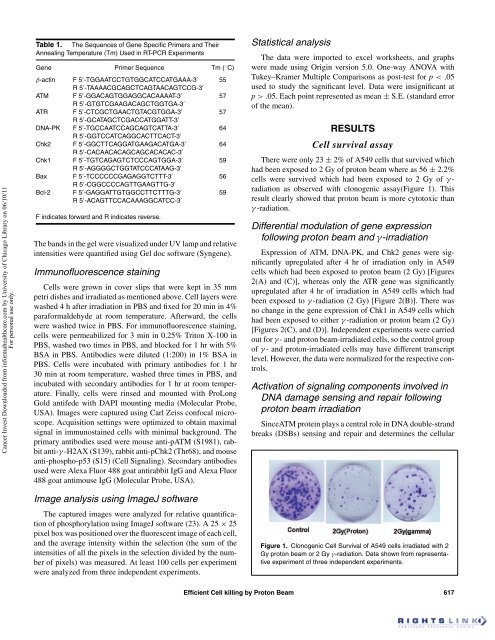
There were only 23 ± 2% of A549 cells that survived which<br />
had been exposed to 2 Gy of proton beam where as 56 ± 2.2%<br />
cells were survived which had been exposed to 2 Gy of γ -<br />
radiation as observed with clonogenic assay(Figure 1). This<br />
result clearly showed that proton beam is more cytotoxic than<br />
γ -radiation.<br />
Differential modulation of gene expression<br />
following proton beam and γ-irradiation<br />
Expression of ATM, DNA-PK, and Chk2 genes were significantly<br />
upregulated after 4 hr of irradiation only in A549<br />
cells which had been exposed to proton beam (2 Gy) [Figures<br />
2(A) and (C)], whereas only the ATR gene was significantly<br />
upregulated after 4 hr of irradiation in A549 cells which had<br />
been exposed to γ -radiation (2 Gy) [Figure 2(B)]. There was<br />
no change in the gene expression of Chk1 in A549 cells which<br />
had been exposed to either γ -radiation or proton beam (2 Gy)<br />
[Figures 2(C), and (D)]. Independent experiments were carried<br />
out for γ - and proton beam-irradiated cells, so the control group<br />
of γ - and proton-irradiated cells may have different transcript<br />
level. However, the data were normalized for the respective controls.<br />
Activation of signaling components involved in<br />
DNA damage sensing and repair following<br />
proton beam irradiation<br />
SinceATM protein plays a central role in DNA double-strand<br />
breaks (DSBs) sensing and repair and determines the cellular<br />
Figure 1. Clonogenic Cell Survival of A549 cells irradiated with 2<br />
Gy proton beam or 2 Gy γ-radiation. Data shown from representative<br />
experiment of three independent experiments.<br />
Efficient Cell killing by Proton Beam 617


